Executive Summary
Financial analysis and company share valuation assumes importance from the perspectives of creditors, management and investors for making meaningful decisions based on the financial performance of the company. Fundamental analysis, ratio analysis and technical analysis are some of the techniques this report uses to analyze the financial performance of Computershare Limited Australia. This report also makes use of forecasted sales revenues, earnings and dividend payments for estimated share price of Computershare Limited as at the end of the financial year 2009-2010. The report indicates a subdued performance by the company during 2009-2010 with a lower level stock price as compared to the year 2008-2009.
Objectives of the Report
An analysis of the financial status and valuation of a corporate entity is undertaken from three different perspectives; lender or creditor, management of the company and investor. From the creditors point of view the analysis is required to take financial decisions as to the extending of credit to the company. Management of the company is interested in the analysis and valuation for finding the ways to improve the value of the company.
Investor is looking for the analysis and valuation for deciding on his investments in the shares of the company. This report analyses the financial results of Computershare Limited for the last three years of working with a view to ascertain the financial strength of the company which will form the basis for the decision to invest in the shares of the company. The report is useful for the management to know the present financial standing of the company and to take decisions on future course of action to improve the value of the company.
Computershare Limited – Profile
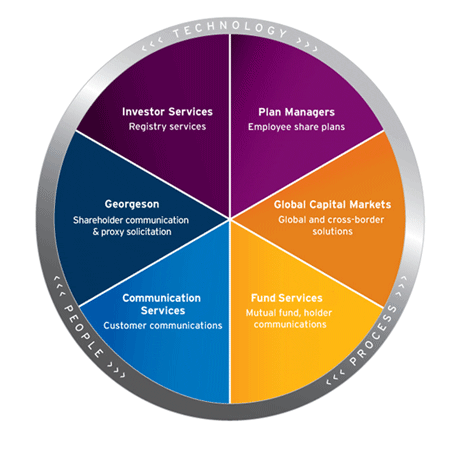
Computershare Limited is a leading financial market services and technology provider catering to the global securities industry. The company has offices spread in all the five continents and provides solutions to listed companies, investors, employees, stock exchanges and other financial institutions. The company manages the accounts of 100 million shareholders holding stocks in more than 14,000 corporate entities. Computershare was established in Melbourne, Australia in the year 1978 and listed in the Australian Stock Exchange in 1994. Computershare expanded the registry business to Australia, New Zealand and United Kingdom markets from 1997.
With global acquisitions in Ireland, South Africa, Hong Kong, United States and Canada the company enlarged its presence in several geographical locations across the globe. The company entered the European market by entering a joint venture with Deutsche Borse AG for providing share registration and other related services in the European continent. The company has a notable presence in the Russian market also (Computershare, 2009). The areas of activities of Computershare Limited are exhibited in the following figure.
Economic Analysis
Computershare Limited has a competitive advantage gained by the company because of its solid performance, a strong position in the core market, and a unique global presence which is superior to its competitors. These competitive advantages are sustainable by the company as they are unique and cannot be imitated by the competitors. In addition the brokers Morgan Stanley is of the view that the company’s future prospects are bright as the broker expects the activities in the corporate actions to go up in the years 2010 and 2011 with more mergers and acquisitions with the rebounding of the global economy.
The broker has also predicted increased activities in the Initial Public Offerings (IPOs) by various corporations and higher level of investor confidence in the coming years. This will result in enhanced earnings of the company. This view of Morgan Stanley is supported by BA-Merrill Lynch (Shaw, 2009).
Despite these positive indications about the economic outlook for the near future, the Australian economy will shrink by around half a percent, before returning to positive growth in 2010, as reported by the Organization for Economic Cooperation and Development (OECD) forecasts. However the forecast reports that the Australian economy would be the best performer in this period compared to all other OECD’s industrialized member nations. OECD report also indicates that the world economy is through its worst of the global recessionary trends (Australian Broadcasting Corporation, 2009). The forecasts indicate that Computershare will have its turnover and profitability improved in the year 2010-2011 if not in 2009-2010 with renewed economic activities in Australia.
The recovery of Australian economy is evidenced by the return of confidence in both consumers and business in mid 2009. The retail sales in Australia have experienced a boost backed by the multi-billion dollar one-off cash payments from the Commonwealth to households. This has made the rebound in the retail sales in Australia more apparent and obvious. The increased momentum in the housing sector activity is also evidence of expected bouncing back of the economy during the mid to fag end of 2009 (Westpac.com, 2009).
There is an increase in the export performance of the country due to resurgence of China and a quantum jump in the rural exports to the extent of 22%. Thus an all round improvement in the Australian economy which will lead to increased corporate activities implying the business growth for Computershare Limited.
Fundamental Analysis
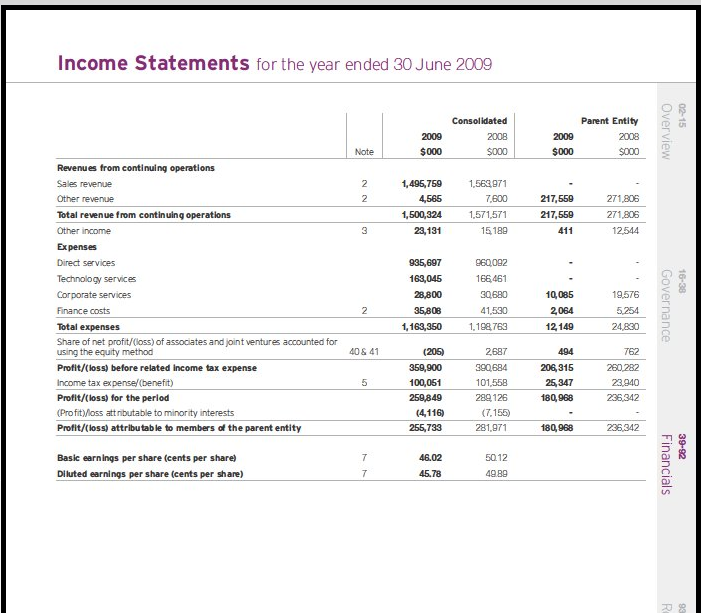
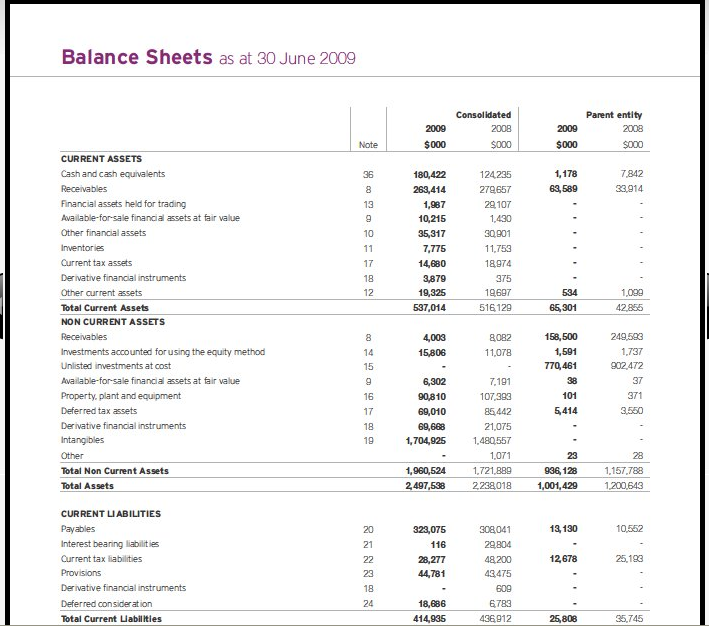
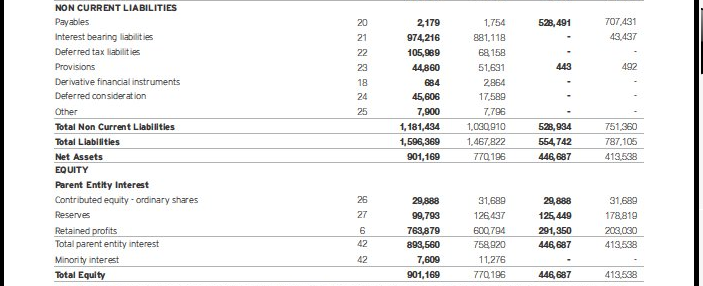
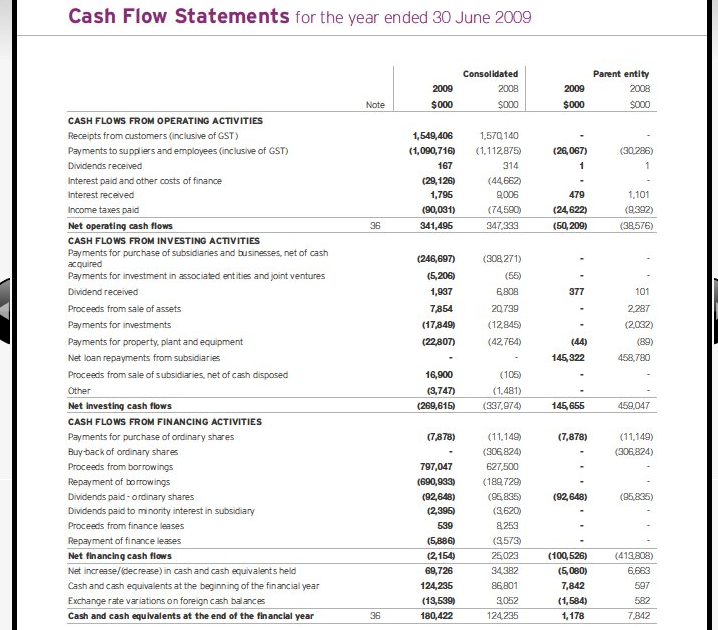
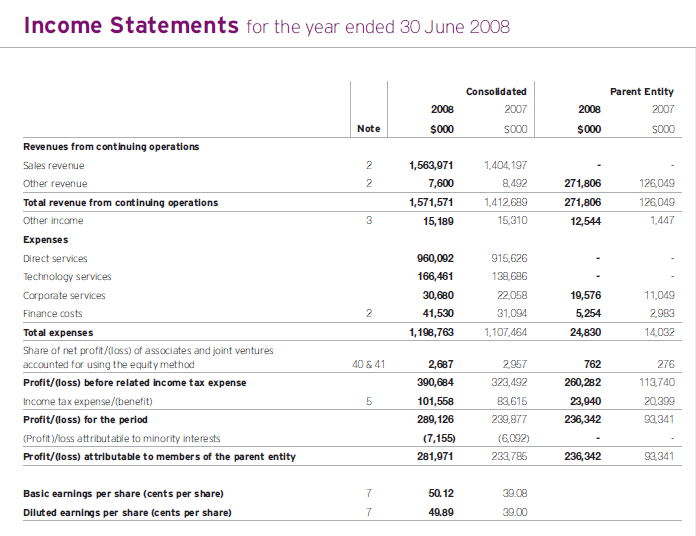
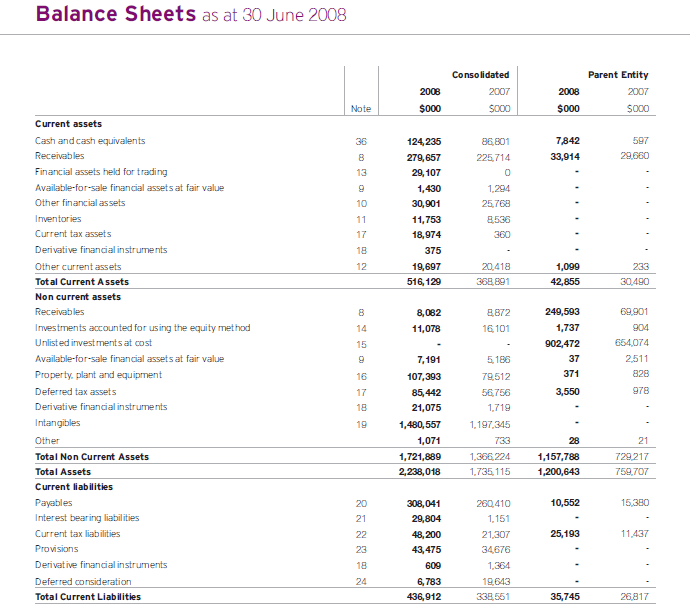
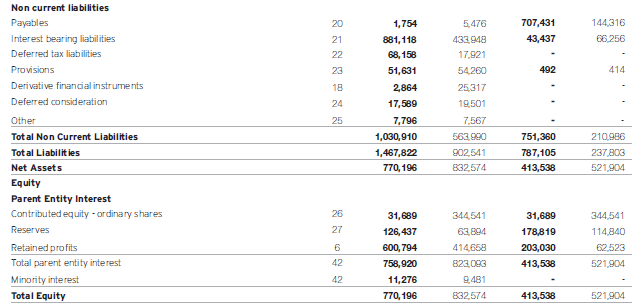
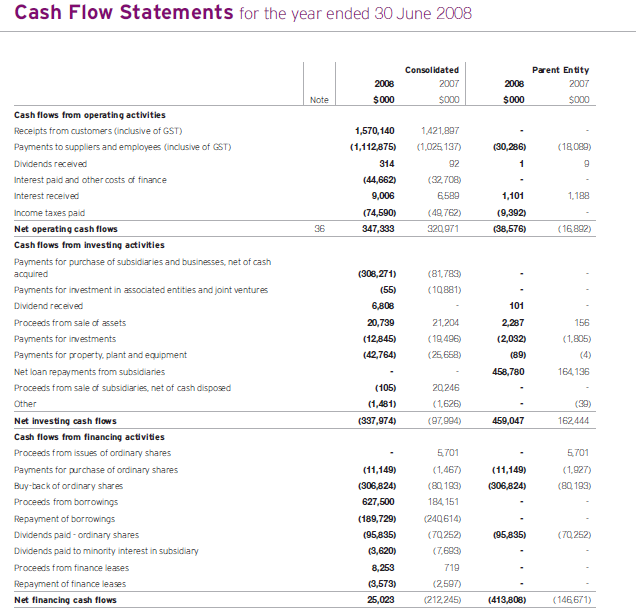
Fundamental analysis of Computershare Limited is carried out using the income statement, balance sheets and cash flow statements for the years ended 30th June, 2007, 2008 and 2009. (See Appendix I and II). A look at the turnover of the company reveals the following position.
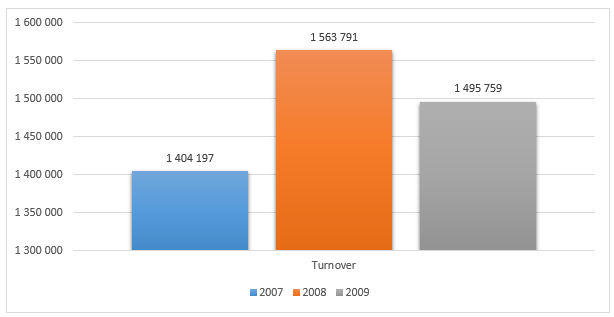
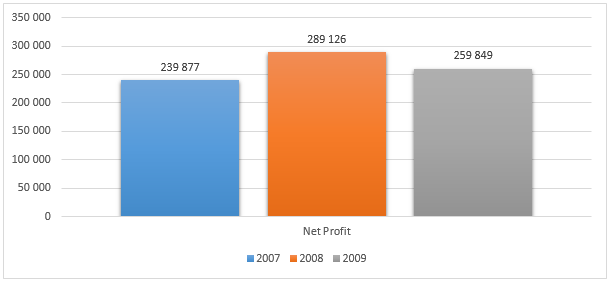
Because of the global economic slowdown during 2008-2009 there have been reduced corporate activities which have affected the sales growth of Computershare Limited. This is evident from the reduced turnover for the year 2009 as compared to the previous year. The reduced turnover has also affected the earnings of the company.
Ratio Analysis
Ratio analysis is the technique used to an evaluation of the financial position and performance o a business entity (UniversalTeacher4u, n.d.). Ratio analysis is usually undertaken by comparing the historical financial figures of the company for the past two or three years. The trend in the financial performance of the company is known by engaging a ratio analysis. Ratio analysis thus implies the comparison of one financial result with the same result for the previous period. The historical financial figures for Computershare are drawn from the annual reports of the company for the past three years and the ratios worked out for analysis. The report on the analysis of ratios is appended below:
Profitability Ratios
“Profitability ratios offer several different measures of the success of the firm at generating profits.” (NetMBA, n.d.) The profitability ratios for Computershare are shown in the following table.
The Return on Equity (ROE) shows how efficiently the company has used the company’s funds to increase the profitability to increase the value of the company to the equity shareholders. Computershare has performed to earn a return of 28.8 % in the year 2009 which is comparatively less than that of the year 2008 (37.54%). The return on equity depends on the net earnings of the company. The global economic downturn and the consequent drop in the Australian economic activities have resulted in a reduced ROE for the company. Return on total assets shows how effectively the company has utilized the assets of the company in enhancing the earnings for the company. In this respect also the company has not performed well during 2009 as compared to the year 2008.
Liquidity Ratio
Liquidity ratio is defined “as a class of financial metrics that is used to determine a company’s ability to pay off its short-terms debts obligations. Generally, the higher the value of the ratio, the larger is the margin of safety that the company possesses to cover short-term debts.” (Investopedia, n.d.) Liquidity Ratios are the ones that exhibit the short-term liquidity of the company.
Computershare is maintaining a reasonable current ratio throughout the three year period. Generally a current ratio between current assets and current liabilities at 2:1 is considered healthy. Therefore the company cannot be said to have a comfortable current ratio during the period under analysis. However for the year 2009 the company had a comparatively better current ratio implying that the company had strong current assets situation that will enable the company to meet its current liabilities comfortably. The current ratio analysis indicates a sound short-term financial ability of the company.
Assets Turnover Ratio
This ration indicates the ability of the company to utilize its total assets in the generation of sales for the company. The greater the ratio, the more is the ability and efficiency of the company in utilizing its assets to produce more sales.
Along with the trend of the other ratios discussed the assets turnover ratio for the year 2009 has shown a decline as compared to the previous year which is understandable from the prevailing economic situation.
Analysis of Per Share Measures
From the point of view of an investor, the ‘per share’ measures are the more important ones as these measures throw out the normal expected earnings of the share. The price earnings ratio is arrived at by dividing the market price of the share by the earnings per share.
Price earnings ratio varies according to the market price trends. However the price to earnings ratio typically falls between 8 and 20 times. A higher price to earnings ratio implies a strong potential for the share to offer future earnings to the investor (Peterson & Fabozzi, 1999). While the earnings per share indicates the amount earned by the shareholder by way of profit, dividend per share shows the actual amount of dividend paid to the shareholders. A growing dividend per share is the sign of the confidence of the company in maintaining its growth (Investopedia(a), 2007).
In the case of Computershare Limited the earnings per share for the year 2009 has decreased from the year 2008; but the market price of the stock as at 30th June 2009 has gone up as compared to the year 2008. This has resulted in a higher price to earnings ratio which shows a health trend for the stock prices of the company. The company has maintained the dividend payment per share for the year 2009 at the same level as that of 2008 which indicates the confidence level of the company on its future performance.
Industry Analysis
A comparison of the ratios for the industry in which Computershare is operating will reveal the relative position of the company as compared to the industry. The following table shows this position.
Comparison of the ratios of Computershare Limited with that of the industry reveals that the company stands in a comfortable financial standing.
Valuation of Shares
The shares of a company are valued for different purposes such as for sale, for determination of premium payable, for amalgamation or merger or for investment purposes. Depending on the purpose for which the valuation is required, different methods are adopted for valuation. Future growth, dividend paying capacity and historical performance in the matter of earnings per share are some of the important considerations in ascertaining the value of the shares of any company. In this report sales revenue growth, profitability growth and price earnings ratio of Computershare Limited are considered for valuation of the shares of the company.
Forecasted Growth in Sales Revenue and Earnings
The financial reports for the past three years reveal the growth rate as below:
Considering the economic outlook for the Australian Economy and the historical performance of the company in the last three years the company may be expected to achieve a negative growth of 2% in the year 2010. Accordingly the forecasted turnover for 2010 is arrived at $ 1,465, 843.
Based on the earnings percentage for the previous three years the earnings for the year 2010 has been estimated at 17% which on the forecasted turnover of $ 1,465,843 results in net earnings of $ 249,193. The figures of estimated net earnings percentage enables to formulate the assumption regarding the probable dividend that the company may choose to pay during the year 2009-2010.
Forecasted Dividends and Prices
For arriving at a proper valuation of the shares it is important to estimate the dividend payout for the next financial year. The dividend payout is calculated using an assumed dividend per share of $ 0.15 cents.
Based on the economic outlook and the forecasted sales revenue and net earnings it is assumed that Computershare would maintain the dividend payout at 0.33 cents reducing the previous year dividend by 0.04 cents per share. This assumption appears to be reasonable involving little risk considering the reserves and current financial position of the company.
The future price to earnings ratio depends on several factors like the historical P/E ratio, general trend of the market prices, gearing ratio – showing the amount of debt in the capital structure – the current and projected rate of inflation and the level of dividend payments. In the case of Computershare the company has a higher P/E ratio over the years which imply that the shares would get a favorable consideration for investment by the prospective investors. The economic outlook for Australia for the year 2010-2011 has been estimated to be favorable which would result in increase in the value of shares of the company.
The company has a high gearing ratio where the long-term debts are equal to the total equity of the company. This position would adversely impact the valuation of the shares of the company. However the profitability of the company is more or less constant indicating that the company is able to serve the long-term debts comfortably. Therefore the high gearing ratio need not be considered to vitiate the valuation of shares. The revival of the economy during 2010-2011 should bring down the inflation levels which will increase the P/E multiples for the company and increase the share prices.
The high P/E multiples would result in higher dividend payouts in the future. The Earnings per Share (EPS) though increased from 39.08 cents in the year 2007 to 50.12 cents in the year 2008, there is a decline in the EPS during 2009 (46.02 cents) which obviously was due to the economic situation. However with the revival of the economy, the EPS can also be expected to go up at a level higher than 2007. The growth rates of EPS for the previous years and the forecasted rate for 2010 is shown below:
From the historical trend it can be assumed that the EPS will have a negative growth of 2.3% during 2009-2010. This fact is corroborated by the economic analysis where it is stated that the economy will have a slight decline in 2009 before it rebounds in the year 2010. Based on the estimated growth the price to earnings for 2009-2010 can be estimated as below:
From the P/E of 19.60 for the year 2009, 2.3% is reduced for 2010 to arrive at the P/E of 19.15. By multiplying the P/E by the estimated earnings per share of 45 cents the market price of the share of Computershare can be estimated at $ 8.62 as at the end of 2010 financial year with an estimated dividend payment of $ 0.15 cents per share.
Technical Analysis
Technical analysis indicates the probable direction of the share prices in the stock exchange where the shares are listed. Several factors such as EPS, dividend payout, past performance of the stocks and intrinsic value of the company are taken into account while forecasting the share value.
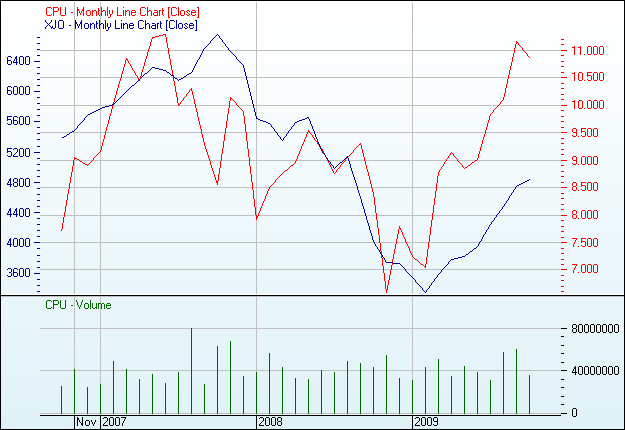
Based on the chart depicted above the shares of Computershare Limited will get supported at a price of $ 10.50 to $ 10.75 in the near future. Half yearly financial results of the company to be declared in January 2010 would have a positive or negative effect on the share price. However until such time the share prices would get supported at $10.50 as the price has already reached its peak in the recent times. As regards the volume when the price reaches $ 10.50 the number of shares traded would cross the 4000000 mark during second fortnight of October 2009.
Limitation of the Analysis
A major limitation of the analysis relates to the assumptions made on the forecasts of sales revenue, profits and future dividend payments by the company. Since these values are mere estimates there might be some variations in the actual results for 2010 as and when they are announced. The values and figures are mainly from the Internet sources where the reliability is somewhat skeptical.
Summary
The report predicts a declining trend in respect of the sales turnover, profitability, dividend payments, earnings and the share price in the near future which are dependent on the economic forecasts for Australia as a whole as well as for the global economy. The company is expected to perform at a lower level for the year 2010.
Recommendations
From the fundamental and technical analysis carried out by this report, it is recommended that the shares of Computershare Limited qualify as best investment for the near future and will fetch superior returns after a period of 12 to 18 months in correlation with the revival of Australian and global economies.
References
Annual Report, 2008. Computershare Limited. Web.
Annual Report, 2009. Computershare Limited. Web.
AustralianBroadcastingCorporation, 2009. Australian economic outlook better than regional nations. Web.
Computershare, 2009. Computershare Limited – About us. Web.
Investopedia(a), 2007. Dividend per Share – DPS. Web.
Investopedia, n.d. Liquidity Ratios. Web.
NetMBA, n.d. Financial Ratios. Web.
Peterson, P.P. & Fabozzi, F.J., 1999. Analysis of Financial Statements Volume 54. UK: John Wiley & Sons.
Shaw, C., 2009. Computershare To Benefit From M&A Rebound. Web.
UniversalTeacher4u, n.d. Ratio Analysis. Web.
Westpac.com, 2009. Economic Outlook Improves. Web.
Appendix I
Appendix II