Abstract
This paper examines an industrial company located in the United Arabs Emirates, Dubai. It examines the financial performance and health of the company using the company’s financial statements that include the income statement and the balance sheet and the ratio calculations, which include the short-term solvency ratios, asset management ratios, debt management ratios, profitability ratios, and the market value ratios. These statements and ratio calculations have been carefully analyzed and examined to give clear information about the company’s performance and series of decision-making. The company that is being examined in this paper is the Dubai Cable Company (Private) Ltd.
Introduction
Dubai Cable Company (Private) Ltd DUCAB manufactures and supplies high quality power cables to the United Arab Emirates and the Middle East region and in countries like India and Hong Kong (Sharjah, 2012, p.1). DUCAB was established by a man known as Sheikh Rashid Bin Saeed in the month of December in 1977. Sheikh Rashid Bin Saeed was the then president of Dubai and manged to establish the company through the partnership of BICC Cables based in the United Kingdom. Presently, DUCAB has about three facilities that produce cables hence having the ability of manufacturing close to 110,000 metal tones of cables per annum. The company’s product range is type tested and approved by international agencies like Lloyd’s Register, KEMA, and BASEC. Their product range includes the following:
- “High voltage cable systems.
- Ducab power plus medium voltage power cables up to 33kV.
- Ducab smoke master low smoke and fume cables.
- Ducab FR fire resistant cables.
- Control and auxiliary cables, instrumentation cables, lead-sheathed cables, pilot cables, wiring cables” (Sharjah, 2012, p.1).
In this paper, the financial analysis of DUCAB will be done by looking at the two main financial statements, which include the balance sheet, and the income statement. The main analysis to be done is the ratio analysis, which involves ratio computations to determine the financial status of the company based on the results of the computation.
Below is the income statement of DUCAB company ltd.
Income Statement
Income Statement For DUCAB FY 2007, 2008 and 2009.
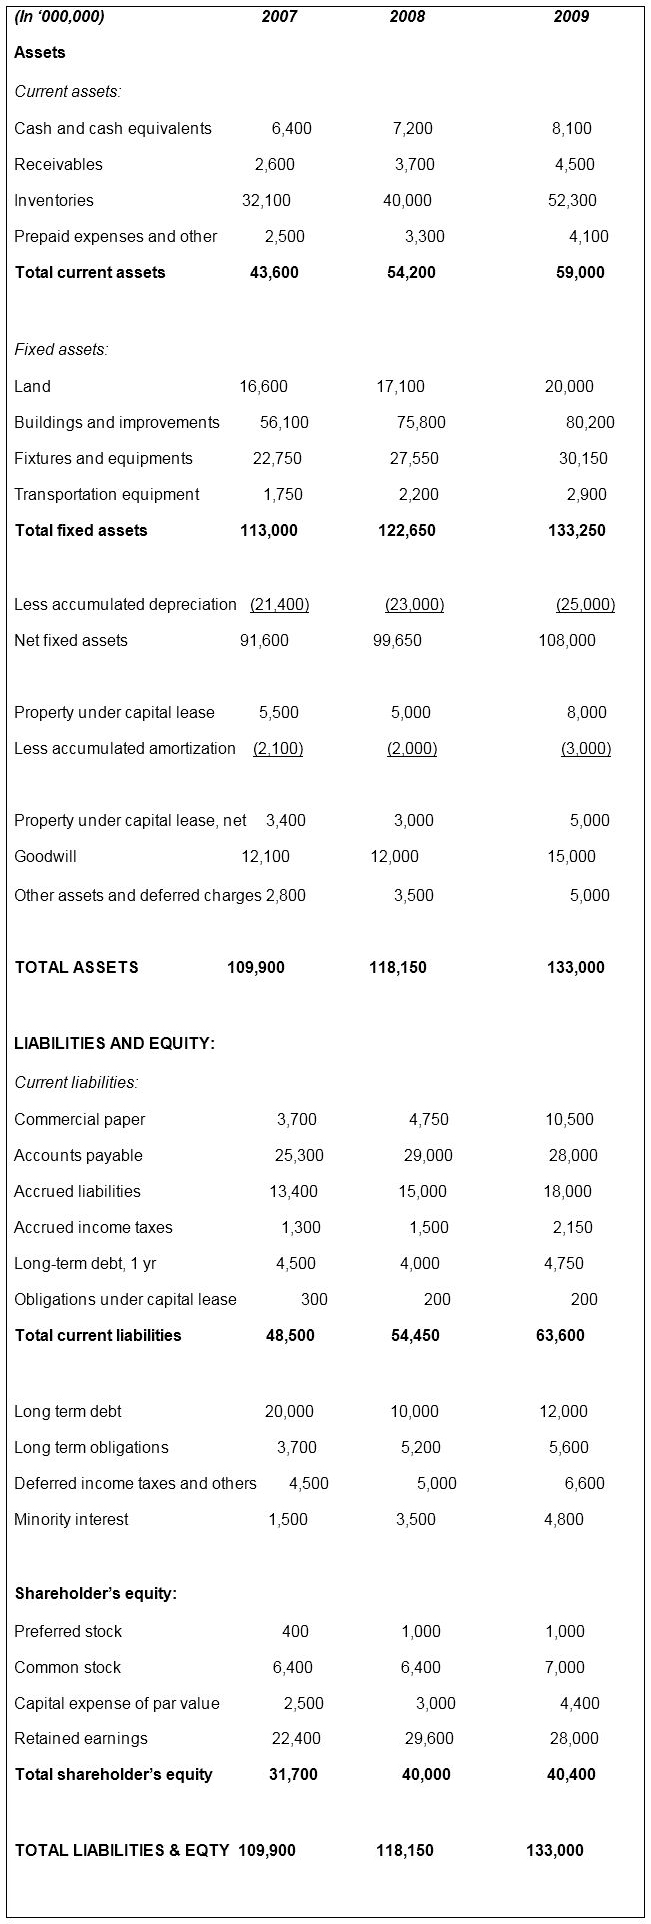
Balance Sheet
Balance Sheet for Dubai Cable Company (DUCAB) Ltd.
Report
In order for businesses to stay informed about how they are performing financially, they need to analyze the accounting ratios (Helfert, 2001). The information obtained from ration analysis is not only important to the business enterprise alone but to other stakeholders as well. Some of the other stakeholders that make use of the financial ratios report include debtors, creditors, customers and investment firms just to mention a few. It is because of this that companies are required to have their reports published for the entire public to view them.
In the calculation of the financial ratios, data used is obtained from the two main financial statements, which are the balance sheet, and the income statement. In the case of DUCAB ltd, the data used will be for three years running from 2007 to 2009 and the trend observed.
Short-term Solvency Ratios
Current ratio
The resulting figure of current ratio determines if a firm is in a position to pay its debts in the short-run. As such, it is an indication of the firms’ liquidity (Ferguson, 2003). “Generally, if current liabilities are over and above the current assets I.e. the current ratio is below 1, then the company may have problems meeting its creditors demand” (Ferguson, 2003). In the case of DCAN ltd, the current ratio above 1 in 2007, then goes down to 0.8 in 2008 before going up to 0.9 in 2009. This means that in 2007 the company was able to meet its short-term liabilities unlike in the next years of 2008 and 2009. It should however be noted that the firm’s inability to effectively meet its short-term obligations is not a critical point of correction as the firm may have efficient prospects in the long-term instead.
Quick ratio
Also known as the acid ratio or the liquidity ratio, it measures how fast a company can meet its current liabilities using the quick assets and/or the cash at hand. Quick assets are the current assets that can easily be converted into cash without a significant change in their book value. A company that has a quick ratio of lees than 1 is said not to be in a position of paying back its current liabilities. In our case here, the company’s quick ratio, which is less than 1 in all the three years, indicates that the company’s near cash and quick assets cannot be able to meet the current liabilities.
Receivables turnover
This measures the effectiveness of a firm in terms of credit extension. In other words, it measures how the firm uses its assets or rather resources. As such, it used to indicate how well the firm makes use of the company’s assets. For instance, if a firm does most of its transactions through operating cash, this will be detected using this ratio, as the receivables turnover will definitely be high.
Day’s receivables turnover
This measures the amount of time that it takes a customer to pay for purchases that have been extended to them on credit. If a company wants to know whether a change in receivables is brought about by a change in sales, it uses the days’ receivables turnover. Day’s receivables ratio is a ratio that seeks to determine the number of days taken by a firm in order to collect money for the products and services that have already been rendered. As for the interpretation of this ratio, if this period takes forty to fifty days on average, then it means that the firm is experiencing problems in regaining money for the services rendered or products sold. It can also imply that the firm has some pressure in its money- in -money -out balance. If the number of days is lower than forty, like in this case it implies that the firm has imposed very harsh policies regarding its credit levels, and this has the effect of blocking any future rise in the revenue obtained from sales.
Inventory turnover
This ratio is used to determine the status of management of a firm’s stock or inventory. In its interpretation, a high inventory turnover ratio implies that the firm is managing its stock efficiently. Inefficiency is depicted when the ratio is below a value of 1. This may be in the form of overstocking, which has the risk of goods becoming obsolete or leading to a rise in the costs of stock holding (Bragg, 2006). A high ratio on the other hand implies that there is some level of shortage, which may result to revenue loss.
Days; inventory
Fixed assets turnover
Total assets turnover
Debt Management Ratios
The role of these ratios is to determine how well a business enterprise is able to manage its debt both in the short-term and long-term.
Debt ratio
This ratio determines the level of debt that the firm has by relating to its assets level. If it is more than one, it implies that the firm is in trouble as its debts are more compared to the assets. If the firm has a debt ratio that is less than 1, it implies that its debt load is much lighter compared to its assets.
Debt equity ratio
Equity multiplier
This is used to indicate the value for investment leverage of a firm. It indicates the ratio of a firm’s assets compared to the equity of the shareholders. If the value of this ratio is high, it implies that the firm is highly leveraged.
Profitability Ratios
Profit margin
Return on assets
Return on equity
Market value ratios
Price/ Earnings Ratio
Market-to-Book Ratio
Other Ratios
Earnings per share
Book value per share
Reference List
Bragg, S. 2006. Financial analysis: A controller’s guide, John Wiley & Sons, Hoboken.
Ferguson, S. 2003. Financial analysis of M&A integration, McGraw-Hill, New York.
Helfert, E. 2001. Financial analysis: tools and techniques: A guide for managers, McGraw-Hill, Boston.
Sharjah, S. 2012. Ducab Dubai Cable Company. Web.