Introduction
The company selected in this report is Etisalat (Emirates Telecommunications Corporation), which is based in United Arab Emirates and listed on Abu Dhabi Securities Exchange (ADX). The company provides telecommunication based services in different regions including Middle Eastern countries, South Asia, South East Asia and Africa. Etisalat ranks 16th, amongst the largest mobile telecommunication and other related services providers and operators, on the globe. This report presents the information related to the operations, customers, suppliers and competitors of the company and also analyzes the financial information spanning over the last two financial years; 2009 and 2010 (Etisalat). Moreover, a side by side comparison of the company with its market competitor “du” EIT Company has also been presented.
Following is the trend analysis of major performance indicators of the company for the last five years.
Sales
Reviewing the performance of the company in the past five financial years, there is a general trend of growth recorded with respect to sales revenue. The company’s revenue stands doubled in the last financial year 2010 as compared to the figures for revenue in the financial year 2006 (Etisalat). Following table shows the trends of sales in the last five financial years:
Table – 01: Five year sales figures (Etisalat, EIT)
Keeping in view the figures for sales presented in the above table, it can be said that the company has maintained a steady growth in its revenue generation. Although the growing revenue trend has been observed throughout the five years period under consideration but the highest growth of 37.58 percent was surprisingly recorded in the year 2008 when global economic crisis was at its peak. In 2010, the sales figure has although grown up but the rate of growth was very low as compared to other years’ growth rate (Etisalat). On the other hand, EIT, the competitor of Etisalat shows an increase of 33% in annual sales in 2010. This significant increase shows that EIT has also managed to capture a significant portion of Etisalat’s customer base.
Net Income
Considering the same five years financial information, the trends in net income of the company can be analyzed. The trends in net income of the company show that there was a consistent growth recorded from the financial year 2006 to 2009, but this positive growth trend has been turned into a negative growth trend in the financial year 2010 (Etisalat). The amount of net income earned by Etisalat and the rate at which net income grew or came down are presented in the table below:
Table – 02: Five year net income figures (Etisalat, EIT)
As per the figures and rates presented above in the table, it can be argued that the net income of the company has seen a sharp decline of (– 11.37%) in the year 2010. Keeping in view the last five financial years, the net income grew to the highest rate of 24.52% in the year 2007 and started to decline and became negative in 2010. The principle reason for a significant decline in the net income in the year 2010 as compared to the year 2009 is a significant increase in the operating expenses of the company. In 2009, the operating expenses of the company were AED 14,365,129 millions and in 2010 the operating expenses increased to AED 18,545,525 millions. This increase in operating expense came out to be AED 4,180,396 millions, i.e. 29.10% of the last year’s figure. Upon reviewing the details of the operating expenses which are embodied in the notes to the financial statements of the company, it is observed that the major reasons for increase in operating costs were increased depreciation expense, regulatory expenses, operating lease rentals, foreign currency exchange losses, cost of equipment and other direct costs (Etisalat). Considering the net profit increase in 2010 from 2009 for EIT Company, there is a huge increase in the growth rate of net income. This increase is primarily due to the increase in sales volume of the company and increased profitability.
Cash Flow from Operating Activities
The table presented below shows the cash inflow or the net cash flow from operating activities of the company. The cash flows shown in the table and the corresponding growth rate for each year show that the company is experiencing a consistent decline in its cash inflows resulting from operating activities.
Table – 03: Five Years Cash Flows from Operating Activities (Etisalat, EIT)
As can be observed in the table above, the sharpest decline in cash flows from operating activities came in the financial year 2008, i.e. a decline of more than 30% in aggregate. However, the ratio of decline reduced to -2% in the next financial year but rose sharply again by almost -18.5%. The major reason behind such significant decrease is increase in depreciation expense in 2010 by approximately 36% (Etisalat). Apart from declining trends recorded for Etisalat with respect to cash flows, EIT has managed to increase its operating cash flows significantly in the year 2010, i.e. by 63% as compared to the previous year.
Total Assets
Changes in the total assets of the company for the last five financial years are shown in the table below. The table shows the portion of current and non-current assets in the total assets of the company in each of the selected year. Apart from this, changes in the overall assets of the company as compared to the previous year have been presented in percentage of the previous years’ figures (Etisalat).
Table – 04: Five Years Figures for Total Assets of the Company (Etisalat, EIT)
The figures presented in the table presented above show that the assets of the company have increased every year though not in the same proportion. The largest increase in total assets of the company has been recorded for the year 2008, i.e. 19.96% as compared to the previous year. After 2008, the total assets of the company increased but not at the same rate and in 2010 the assets of the company increased by only 5.92% of the value of the total assets held by the company in the financial year 2009. On the other hand, the current and non-current mix of assets in total assets has also been shown in the table above. Looking at the percentages calculated in this respect, it can be said that the company has focused on maintaining a 1:3 ratio for current assets and non-current assets ratios. However, there have been slight variations in this proportion during the selected five years (Etisalat). On the other hand, the EIT Company has maintained a different proportion of current and non-current assets. The annual increase in the total assets of EIT Company is also significant as compared to Etisalat.
Products
Products of the company are related to the following:
- Landline
- Mobile
- Internet
- E-life
Apart from this, the company also offers services to telecommunication industries by providing training, SIM cards production, invoicing and billing assistance, data transmission, etc. (Etisalat). Similarly, the competitor of the company EIT has also same line of products to offer to its customers.
Customer Base
The customer base of the company is spread in different parts of Asia, Middle East and Africa. The regions include West Africa, Nigeria, Egypt, Sudan, Tanzania, UAE, KSA, Afghanistan, Pakistan, Bangladesh, Sri Lanka, and Indonesia (Etisalat). On the other hand, the customer base of the EIT Company only comprises of UAE, as it is based in the UAE region and no operations are carried out by the company outside UAE.
Accounting Policies and Framework
Both Etisalat and EIT Company prepare their financial statements under the historical cost convention on the basis of framework provided by International Financial Reporting Framework (IFRS) (Etisalat).
Financial Ratios Analysis
In order to conduct the ratio analysis of the financial performance of the company, the financial information embodied in the financial statements of the last three financial years have been considered, i.e. 2010, 2009 and 2008. In addition to this, for the purpose of comparing the financial information of Etisalat with industry benchmark, financial ratios for the year 2010 of EIT Company have also been presented. Following is the interpretation of the major ratios calculated for Etisalat and an industry comparison:
Current Ratio
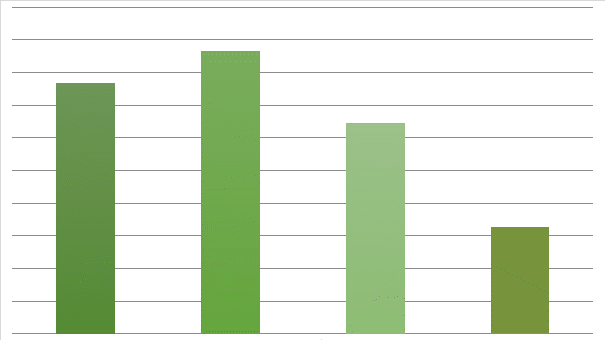
The current ratio of Etisalat has declined from the previous year. From 2008 to 2009, an increasing trend was observed but it started to decline in 2010. The principle reason behind this declining trend is a significant decrease in the cash reserves of the company by 9.1% and at the same time the trade payables amount increased by 3.5% (Etisalat). However, the current ratio for Etisalat is better than that of its competitor’s.
Quick Ratio
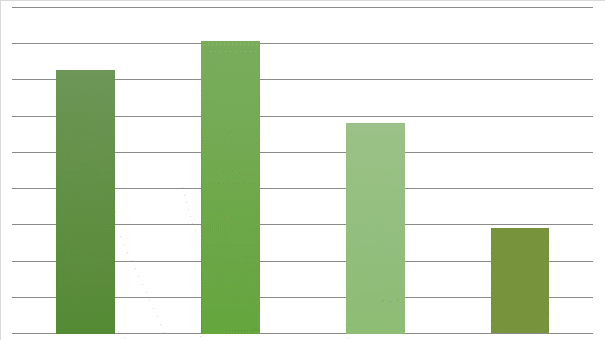
As discussed above, the decrease in cash and cash equivalent reserves caused the current ratio to decline in 2010; the same reason can also be quoted for the decline in quick ratio of the company. The quick ratio declined to 0.78 in 2010 as compared to 0.82 in 2009 (Etisalat). Similar to the case of current ratio, the quick ratio of Etisalat is also above than the quick ratio for EIT Company.
Average Collection Period
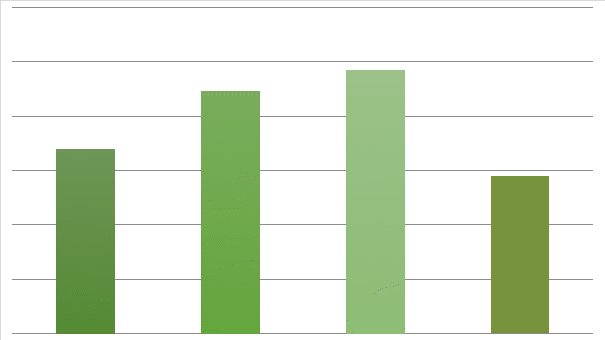
Average collection period for amounts to be received from the debtors / customers of the company can be seen increasing throughout the years selected in this analysis. This means that the efficiency of the company to collect its receivables is going down in each of the three years under consideration. Although, the increase in collection period in 2010, which is 8 days, is less than the increase of 21 days in 2009, but this is an alarming situation for the company because increased collection period means that the company may have to face liquidity issues in the long run (Etisalat). Apart from the improvement in the collection period, it can be seen that Etisalat’s is much quicker in collecting back its money from debtors as compared to the benchmark company.
Inventory Turnover
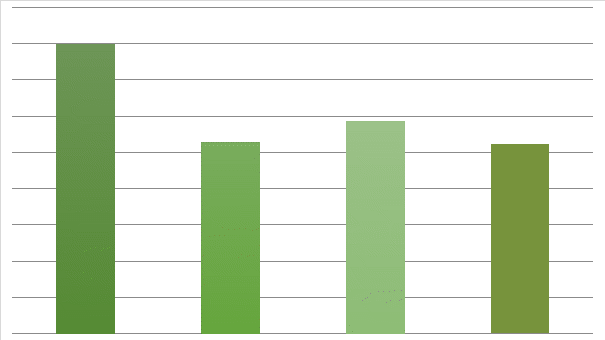
The inventory turnover ratio for the company here shows that the sales volume is not increasing as the level of inventory held has increased over time. This fact is shown by the decreasing inventory turnover as shown in the ratio calculation table for inventory turnover in Appendix–01. Apart from this, the ratio calculated is also indicative of the fact that the company has not been able to manage its sales in accordance with budgeted figures, because inventory levels maintained are in accordance with the quantity demanded and forecasted revenues but the actual sales have not been up to that level which could have rotated the inventory stocks as frequently as planned (Etisalat). Apart from this, the company still maintains a higher level of inventory turnover as compared to its competitor.
Debt Ratio
Keeping in view the debt to assets ratio for Etisalat, it can be stated that the company has focused more on obtaining or raising finance through debt rather than equity. This can be justified by observing the increasing trend of debt as a percentage of total assets of the company. In the financial year 2008, the debt ratio for the company was 0.36, whereas the ratio increased to 0.53 in 2010 (Etisalat). While comparing the ratio for 2010 with the market benchmark selected, it is observed that the competitor EIT Company is relying more on debt financing.
Time Interest Earned Ratio
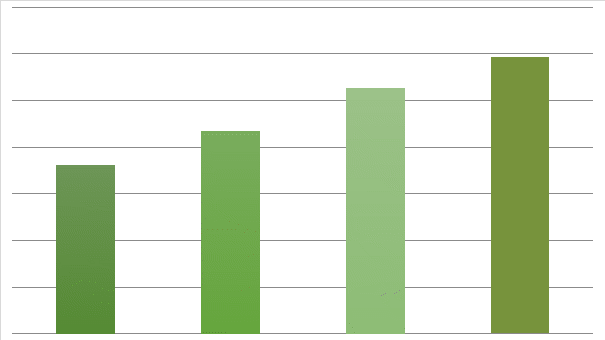
The increasing ratio for time interest earned shows that the company is paying high amounts of debt related costs out of profits. The increasing ratio in this respect is suggestive of the fact that the company has too many debt obligations to meet and they are increasing every year and thus more portions of profits earned by the company is being paid as finance costs (Etisalat). The industry benchmark in this respect suggests that the Etisalat’s TIE is significantly higher than the benchmark selected.
Total Assets Turnover Ratio
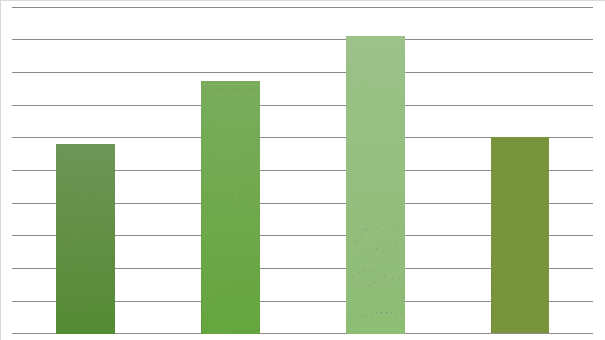
The company has shown good progress in generating sales from its investments in assets. This is depicted in the ratios calculated in this respect; the assets turnover ratio has increased steadily from 2008 to 2010 at an approximately a similar rate (Etisalat). However, apart from the improvement with consistency shown in the last three years, the company is still behind its competitor as shown in the ratios calculated table in Appendix.
Return on Total Assets
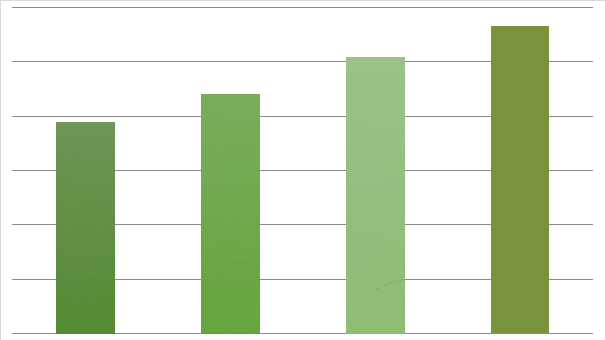
There is a consistency recorded with respect to return on assets for Etisalat. After an increase of 0.01% in 2009, the rate of return on total assets remained same in 2010, i.e. 12%. This shows that the increase in assets is proportionate to the increase in net earnings of the company during the last 2 years (Etisalat). The return in total assets is better than its competitor ETI Company.
Return on Equity
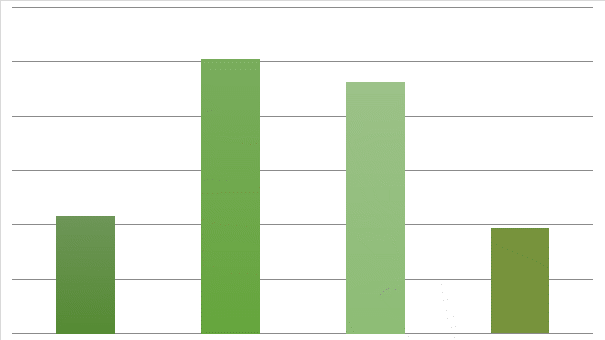
The return on equity for Etisalat is also following a declining trend. The major reason behind this is the downward trend of the profits of the company and the consistent increase in the equity. The decline in return on equity can be observed on consistent basis throughout the three years under consideration (Etisalat). On the other hand, the return on equity for the company is also seen as far below the benchmarked company’s ratio.
Net Profit Margin
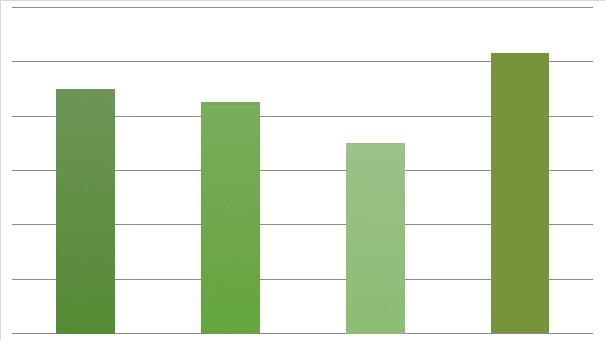
After being stable from 2008 to 2009, the net profit margin declined by 0.04% in the year 2010. The reason attributable to this decline is the sharp increase in the operating expenses of the company in 2010. As for instance, in 2009 the operating expenses of the company were AED 14,365,129 millions and in 2010 the operating expenses increased to AED 18,545,525 millions. This increase in operating expense came out to be AED 4,180,396 millions, i.e. 29.10% of the last year’s figure which reduced the profits of the company significantly (Etisalat). However, the net profit margin of Etisalat is much better than the company selected for comparison as benchmark.
Works Cited
ADX. Etisalat. 2011. Web.
EIT. Annual Report 2010. Financial Statements. Abu Dhabi: EIT, 2010.
Etisalat. About Us. 2011. Web.
Etisalat. Annual Report 2007. Financial Statements. Abu Dhabi: Etisalat, 2007.
Etisalat. Annual Report 2008. Financial Statements. Abu Dhabi: Etisalat, 2008.
Etisalat. Annual Report 2009. Financial Statements. Abu Dhabi: Etisalat, 2009.
Etisalat. Annual Report 2010. Financial Statements. Abu Dhabi: Etisalat, 2010.

