About the company
Ocado is a public limited company based in England. The company was formed by a group of three people who worked earlier as bankers at Goldman Sachs. The company was formed in 2002 and it was listed on the London Stock Exchange in 2010. The three founders are Tim Steiner, Jason Gissing, and Jonathan Faiman. The company trades in groceries in their brands. The company has about 600 products in its brand. The company receives suppliers from Waitrose supermarket outlets. Apart from groceries, the company also trades in an array of consumer goods such as items such as toys, flowers, magazines, and a range of Carrefour products.
The company heavily relies on online shopping for interacting with customers. It does not own physical shops as expected with retail companies (Ocado Group PLC 2013). The regional outlets are located in two hubs are Warwickshire and Hertfordshire. The two regions are located in the United Kingdom. The two outlets operate as wholesales. Thus, it is evident that the company has not exploited the potential of new markets outside the United Kingdom. Some of the regions that the company covers in the United Kingdom are Southampton, Wimbledon, Weighbridge, Bristol, White City, Dartford, Oxford, Coventry, Manchester, and Leeds. Thus, it is evident that the company reaches about 70% of the population of the United Kingdom (Ocado Group PLC 2013).
Review of operational performance and financial structure
For reporting purposes, the financial year of the Group ends in November. Thus, some financial years take 52 weeks as in the case of 2009 while others take 53 weeks as in the case of financial reports for the year 2012. This creates a challenge in comparing the financial performance of the company.
Income statement
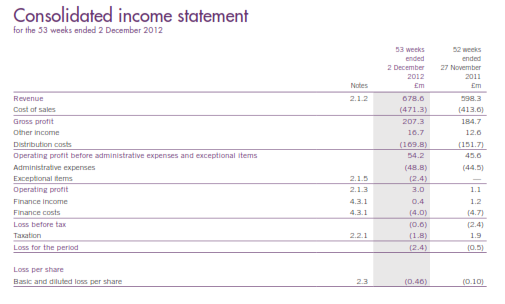
The income statement of the company does not show impressive performance. Even though revenue increased from £598.3 million in 2011 to £678.6 million in 2012, the company reported losses both in 2011 and 2012. In 2011, the amount of the loss was £0.5 million. The amount of the loss increased to £2.4 million in 2012. A further review of the income statement shows that the company reported a positive gross profit and operating margin with operating profit margin increasing by about 172.72% (Ocado Group PLC 2013). This indicates that the company is efficient in managing pricing decisions and operating costs to earn and increase the profit level of the company.
The negative net profit margin of the company is attributed to high finance costs. The amount of the finance cost exceeded the amount of the operating profit hence the losses. This is an indication that the company is highly levered. In addition, it indicates that the company is not solvent since it cannot over the finance cost (Ocado Group PLC 2013).
Balance sheet
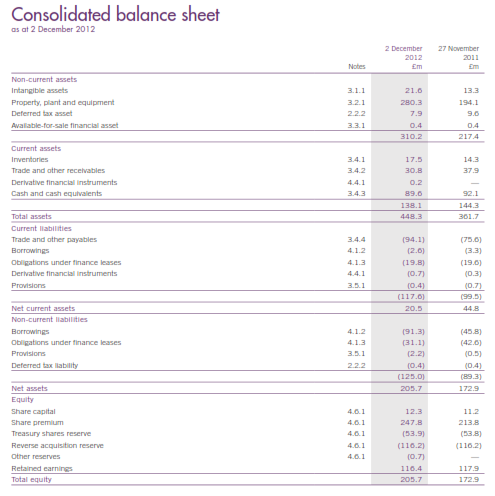
A review of the balance sheet of the company reveals that there is growth in key variables of the balance sheet. There is growth in the number of total assets and total equity. The growth in sales revenue can only be achieved when there is growth in the asset base and the amount of capital. On the other hand, the number of current liabilities and non-current liabilities increased. This shows the increased leverage of the company.
It is worth mentioning that the total liabilities of Ocado Group are more than half of the sum of equity and assets. It shows that most resources of the company are funded by obligations. It is also evident that the rate of growth of total liabilities is higher than the rate of growth of assets and equity. This might impact the leverage of the company and have a more serious impact on profitability. Besides, it will scare away potential equity shareholders and other stakeholders of the company (Ocado Group PLC 2013).
Operational ratios
Profitability and utilization ratios
Profitability ratios indicate the earning capacity of an entity. The ratios measure the effectiveness of a company in meeting the profit objectives both in the long run and short run. The table below summarizes the profitability ratios of the company for two years.
The ratios above show a decline in the profitability of the company. Besides, the profitability ratios of the company are generally low (Ocado Group PLC 2013).
Efficiency ratios
Efficiency ratios focus on the internal operations of the company. These ratios show the level of activity in a company. It focuses on efficiency in the allocation of resources to maximize output and income from the resources available.
There is a decline in the efficiency of the company as indicated by low and declining turnover ratios. Also, the operating working capital of the company declined. The decline in working capital shows that the financial health of the company is deteriorating (Ocado Group PLC 2013).
Financial structure
The Group makes use of the two common methods of financing these are debt and equity financing. A review of the balance sheet of the company shows that the amount of equity financing exceeds the total amount of debt financing by a small margin. The information on the financial structure of the company is shown in the table below.
The financial leverage of the company is increasing and this implies that the amount of debt might exceed the amount of equity in a few years.
Conclusion
The discussion above shows a worsening trend of profitability of the Group. It is of greater concern since the firm’s objectives are to maximize profitability and shareholders’ wealth. Thus, management should come up with turnaround strategies to help change the current trend. This should also focus on reducing the current leverage of the company. Further, the management needs to work on the efficiency of the company (Ocado Group PLC 2013).
Reference
Ocado Group PLC 2013, Annual report 2012. Web.
Appendices
Income Statement
Balance sheet