Background of the companies
Pepsi Company (PepsiCo, Inc.)
PepsiCo, Inc. is a multinational company that deals with snacks and soft drinks. PepsiCo, Inc. was established in 1965 when the Pepsi-cola Company merged with the Frito-Lay Company. Since its establishment, PepsiCo, Inc. had expanded through acquisitions and mergers with other companies. The company manufactures, distributes, and markets food and beverages. PepsiCo, Inc.’s main brands include Pepsi, Tropicana, Quaker Oats, Gatorade, and Frito- Lay. The company has expanded enormously in its struggle with its main competitor, the Coca-Cola Company. In 2012, PepsiCo, Inc. generated net revenue of about $43.3 billion and was ranked as the second-largest food and Beverage Company globally, and the largest food and beverage company in North America. Given its wide range of products, PepsiCo, Inc.’s target market comprises people of all ages. PepsiCo’s products are made from agricultural products. Therefore, the company tries to maintain a healthy relationship with its suppliers who comprise independent farmers, company-owned farms, and several intermediaries. For the effective management of the esteemed company, PepsiCo, Inc. employs the corporate governance strategy. PepsiCo‘s chief Executive director, Indra Nooyi, is one of the world’s most powerful women. The company’s top management team comprises a board of directors who have contributed greatly to the success of the esteemed company (PepsiCo, Inc., 2012).
The Coca-Cola Company
The Coca-Cola Company ranks first on the list of the world’s manufacturers of soft drinks. The company manufactures, distributes, and markets non-alcoholic beverage concentrates. John Stith Pemberton established the Coca-Cola Company in 1886. Like PepsiCo Inc., the Coca-Cola Company has expanded through its acquisition of other soft drink companies. Coca cola’s beverage concentrates and syrup are made from non-nutritive sweeteners such as potassium, saccharin, cyclamate, aspartame, and sucralose. The NutraSweet Company and Ajinomoto Co. Inc., Nutrinova Nutrition Specialties & Food Ingredients GmbH are the primary suppliers of the above-mentioned raw materials. With its low-calorie spackling beverage products, the Coca-Cola Company targets every thirsty consumer; all individuals aged 8-40 years. The Coca-Cola Company employs a corporate leadership strategy with a central Chief Executive Officer, Muhtar Kent, and company presidents across the world. The tireless efforts of the presidents have enabled the Coca-Cola Company to grow to its current position. Since 2009, the company has increased its daily servings to over 200 million, thus, adding about $30 billion to coca cola’s market capitalization (Coca-Cola Enterprises, Inc., 2012).
Stock trend analysis
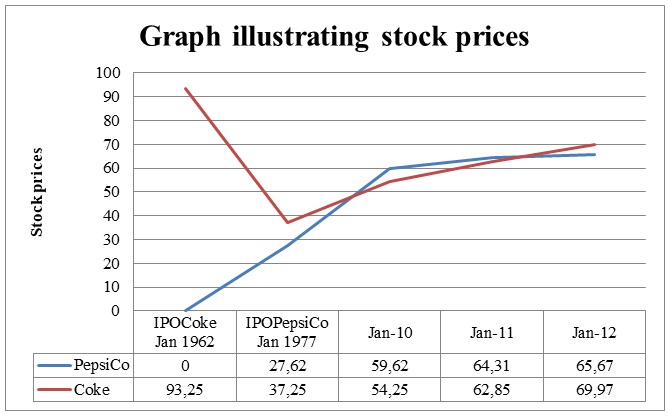
The Coca-Cola Company (KO) went public in January 1962 and its stock prices were relatively high. However, it split its stock prices in the ratio of 2:1 later on, such that by the time PepsiCo (PEP) went public in January 1977, the two companies were pair traders. In several events, harsh economic conditions or temporary changes in supply and demand have temporarily weakened the correlation of the two securities. However, trade forces eventually bet the spread between the two securities, and they finally converge. In January 2010, PEP’s stock traded at $59.62 and their value increased consistently, and by January 2012, there was a cumulative increase of $6.05 per share. Similarly, KO shares portrayed an upward trend during the mentioned period and ended up with a cumulative increase of $15.72 per share. The difference is an increase in prices is not very significant given that it is a 3-year difference, and an investor cannot rely on those prices to make an investment decision. In fact, from the stock prices we could conclude that both PEP and KO are correlated companies that shared somewhat similar dips and highs between January 2010 and January 2012. With the trend of increasingly high stock prices, both companies are likely to use the stocks to make acquisitions and other profitable deals. Moreover, the high stock prices would increase the investors’ confidence that both companies are not vulnerable to takeovers.
Analysis of the current events
PepsiCo, Inc.
Like any business, PepsiCo, Inc. makes use of every opportunity to acquire or merge with other companies as long as the move adds value to their company (Lai, Chen, & Huang, 2010). PepsiCo, Inc. acquired Wimm-Bill-Dann Foods OJSC (WBD) in 2011. This was one of the greatest company’s achievements. WBD was Russia’s leading Food and Beverage Company and PepsiCo would earn massive profits by acquiring the high-profile company. During the same year, PepsiCo’s snack volume increased by 35% and the beverage volume increased by 21%, because of the acquisition. Although the acquisition of the WBD was associated with merger costs and losses associated with unfavorable foreign exchange rates, there was an overall increase of 15% of the operating profit. PepsiCo, Inc. was able to offset the above-mentioned costs and losses by the effective net pricing strategy and planned for cost reductions in several expenses. The accounting books reflected a net revenue growth of 41% in 2011, which is a clear reflection of the positive effect of acquiring the WBD. Essentially, WBD contributed to 29% of the revenue growth while the rest of the revenue was related to the acquisition of PBG and PAS.
Before the acquisition of WBD in 2011, PepsiCo, Inc. had acquired the Pepsi Bottling Group (PBG) and PepsiAmericas, Inc. (PAS) in 2010. This acquisition enabled the company to re-acquire some previously denied franchise rights (PepsiCo, Inc., 2012). The rights enabled PepsiCo, Inc. to manufacture and distribute beverages across esteemed territories, and the PepsiCo was able to revive some previous bottling arrangements with earlier customers. The acquisition of PBS and PAS enabled PepsiCo, Inc. to earn profits of about $958 million.
PepsiCo, Inc. benefited greatly from the acquisition of PBG, PAS, and WBG. Due to the acquisitions, PepsiCo, Inc. had goodwill and non-amortizable assets of $3 billion by the end of the year 2012 (PepsiCo, Inc., 2012). These major acquisitions are just but a few of the events that are likely to increase the stock prices of the Pepsi Company. This is a clear indication that an investor who buys PEP shares is likely to sell the shares at a higher price and gain massive profits in the near future. Therefore, PEP is a potentially good investment company as the emerging and developing markets create an attractive growth space.
The Coca-Cola Company
Coca-Cola Enterprises Inc., (CCE), is the largest producer and distributor of Coca-Cola beverages in the world. In October 2010, CCE accomplished its merger with TCCC, (The Coca-Cola Company). After the merger, CCE split its operations across Europe and Canada and became a new legal entity. To add to the merger, two of CCE’s subsidiaries were able to acquire TCCC’s bottling operations in Sweden and Norway in accordance with the share purchase agreement of March 20 2010. To crown it all, the Coca-Cola Company was able to acquire CCE’s former North America business among several other acquisitions in 2010. The acquisition of CCE’s former North American business enhanced coca cola’s financial position as the move enabled the company to produce, sell, and distribute its products in the US, Canada, Virgin Islands, and Cayman Islands among other established places. The acquisitions and mergers played a critical role in enabling the Coca-Cola Company to evolve its franchise system and respond to the unique customer needs in North America. The company was able to upgrade its beverage brands and this somewhat increased their sales in the year 2010.
In fact, in 2010, the Coca-Cola Company recorded a profit of $4,978 million because of the acquisitions. The Coca-Cola Company purchased the former North American business in bits. It first acquired 67% of the shares and coca-cola had owned 100% of the shares by the end of the year. With regard to the full ownership of the CCE’s former North America business, the Coca-Cola Company made an agreement with the DPS, (Dr. Pepper Snapple Group, Inc.), to distribute some DPS brands in the US, Canada. This agreement came at a cost since the Coca-Cola Company had to make a one-time cash payment of $715 million to DPS. Moreover, the Coca-Cola Company had to meet certain standards to distribute the DPS products. However, it was a worthwhile project in the end as it was a 20-year contract that would earn the company some massive profits. Since 2010, the Coca-Cola Company has worked tirelessly to continually improve its system to achieve scale requirements and gain a competitive advantage.
Although the Coca-Cola Company has worked tirelessly to increase their scales of production, some factors have adversely affected its performance. Since 2010, the Coca-Cola Company has experienced massive losses following the harsh economic and political instabilities in some of their international markets. Iran and Syria are some of the coca cola markets that have experienced some political unrest over the past few years. In addition, the US made trade sanctions against the nations, which disabled the trade activities between the Coca-Cola Company and those countries. In essence, tough economic conditions and political unrest in international markets have a direct negative effect on the Coca-Cola Company business because a significant portion of their revenue comes from the international markets (Coca-Cola Enterprises, Inc., 2012). From these discussions, it is evident that the Coca-Cola Company is employing strategies to enhance its business despite the challenges it faces. An investor who buys KO shares will be at a higher risk, as stock prices are likely to lessen given the unstable economic environment of the Coca-Cola Company. Therefore, KO is a potentially good investment company, but investors are warned of the high risks associated.
Overall financial analysis
PepsiCo, Inc.
PepsiCo, Inc.’s financial statements are somewhat impressive. In 2010, PepsiCo, Inc. obtained $958 million from equity interests held in the prior periods. These gains were associated with the acquisition of the PBS and PAS companies. The acquisitions enabled PepsiCo, Inc. to create an integrated supply chain, improve its efficiency in the distribution of brands, and thus, enhance the company’s revenue growth. The acquisitions made PepsiCo, Inc. incur merger and integration charges, increased after-taxes, restructuring expenses, settlement charges, and other miscellaneous expenses. However, as mentioned, the mergers and acquisitions are long-term investments that would make the company’s revenue grow drastically. In 2010, PepsiCo, Inc. had some impressive accounting records. The company’s net revenue grew by $94 million and thereby, the gross profit grew by $693 million. With these growths, each of the PEP shares grew by $0.04. Since 2010, PepsiCo’s net revenues have grown consistently, and the cash dividends declared per common share have had an increasing trend. Generally, PepsiCo, Inc.’s financial statements are very attractive to investors and investors would consider buying the company’s shares.
Coca-cola
Like other public companies that work towards attracting investors, the Coca-Cola Company has presented some impressive financial statements. Following the acquisition of the TCCC, the company incurred some acquisition and merger costs, restructuring charges amounting to $85 million, and mark-to-market losses of $4 million. On the other hand, the Coca-Cola Company recorded deferred tax benefits of $62 million when the UK and Sweden declared tax rate deductions (Coca-Cola Enterprises, Inc., 2012). The above gains and expenses were replicated over a period of three years, 2010, 2011, and 2012, though the amounts were somewhat different.
In 2011, the company’s net sales increased by 23.5% following the acquisition of the TCCC and the efficiently managed operations in Norway and Sweden. However, in 2012, the Coca-Cola Company experienced a decrease of 2.5% of the total net sales. The net sales in 2011 amounted to $8.3billion, whereas the net sales in 2012 were about $8.1 billion. The change was attributed to the unfavorable currency exchange rates and an additional French exercise tax that was effective from the beginning of January 2012. It is noteworthy that the average outstanding debts balances of the Coca-Cola Company have had an upward trend since 2010. Although the dividends declared per common share increased from $0.12 in 2010 to $0.61 in 2011, and a further increase to $0.64 in 2012, investors can have doubts about investing in the coca-cola company.
Accuracy and reliability of the financial data
Investors should be keen while making investment decisions based on the financial data of companies. It is noteworthy that companies have a tendency of adjusting their financial statements to attack investors (Holthausen, 2012). PepsiCo’s financial data could appear very impressive, but they have some reasonable allowance of doubts and errors. The same thing may apply to coca cola’s financial statements, which may appear so unimpressive even though the company would be doing very well in the stock exchange market. Therefore, the financial data may not be accurate, and thus, it is not reliable.
Recommended Investment Company
Over the past 12 quarters, coca-cola has raised its dividends more slowly and consistently, whereas PepsiCo has drastically upped its dividends. From a literal point of view, PepsiCo has a diversification advantage over coke; it has impressive financial statements, and an impressive acquisition and merger history, and therefore, it would be wise to purchase PEP shares instead of KO. However, from a critical point of view, the best decision is to practice the pair trading strategy, where a pair trader will have shares for both companies, PEP and KO. The trader monitors the stock prices; if KO prices rise while PEP remains the same, the trader would sell KO shares and buy PEP shares and vice versa. The trader would make money if PEP prices rose, and either way, if KO shares fell, the trader would benefit by shorting the KO stock, and the trend would continue.
References
Coca-Cola Enterprises, Inc. (2012). 2012 Annual Report. Atlanta, Georgia: Author.
Holthausen, R.W. (2012). Valuation with market multiples: How to avoid pitfalls when identifying and using comparable companies. The Bank of America Journal of Applied Corporate Finance, 24(3), 26-38.
Lai, H., Chen, C., & Huang, C. (2010). Technical analysis, investment psychology, and liquidity provision: Evidence from the Taiwan stock market. Emerging Markets Finance and Trade, 46(5), 18-38.
PepsiCo, Inc. (2012). 2012 PepsiCo Annual Report. Purchase, NY: Author.