Introduction
The financial performance of a company defines and characterizes many of its operational factors, including its competitiveness, potential for growth and overall financial health. Some researchers use the financial performance of a company to understand the economic interests of a company and evaluate the reliability of its present and future contracts (Tracy 2012).
Therefore, evaluating a company’s financial performance is of value to shareholders and investors. In this paper, we analyse the financial performance of Qantas Airline, from 2010 to 2015, using a qualitative and quantitative review. The findings of this study would be important to the public (airline’s customers), the regulator (government), the economic sector (aviation industry), and the Australian national economy as a whole.
Company Background
Established in 1920, the Australian government established the Queensland and Northern Territory Air Services (QANTAS) as the frontier airline for Australia (Omics Group 2016). Since its inception, the company has grown from a regional air service organisation to a large global airline. It has done so by meeting the demand of the fast expanding passenger airline market (Omics Group 2016). Today, the company has a fleet size of more than 250 aircrafts and flies to more than 142 destinations in more than 40 countries.
Company Placement in the Industry
Qantas airline is among the oldest airlines in the world. Its competitiveness is mainly in the Australian regional market where it dominates more than 65% of the market share (Creedy 2015). However, today, the company’s market share of international flights in and out of Australia is below 15% (Creedy 2015). This is because the company faces stiff competition from its rivals, such as Virgin Air and Singapore Airlines.
However, this fact does not negate the high passenger numbers enjoyed by the company because the airline has the biggest market share of passenger numbers for the airlines that fly into Australia. Emirates, Singapore Airlines, Jet Star and Virgin Atlantic trail the Australian-based airline, in terms of market share, in that order (Fleisher & Bensoussan 2015). Although Qantas is still struggling with its corporate turnaround story, it still enjoys a strong national appeal as Australia’s flagship airline. Its biggest drawback is its heavy reliance on the Australian market to sustain its operations.
Stock Price Analysis
Financial analysts often say that Qantas’s share price is among the most valuable blue chip stocks in the industry (Addis 2015). The table below shows the company’s stock price for the last five years
Adapted from (Addis 2015).
The table above shows that the company’s stock price has been relatively low from 2011 to 2014. This slump is a product of a significant reduction in share price between 2010 and 2011. It has remained within the $1 bracket for the past four years, except in 2015, when it suddenly rose to $3.37 (Addis 2015). The main reasons for the stock price movements are management and global oil price changes (Raszkiewicz 2015).
What is the value of the Stock?
The Gordon growth model helps to calculate the present value of future dividends in a company. In some financial quarters, experts say its importance mostly emerges in the calculation of the intrinsic value of a stock (Brentani 2003). It analyses the future series of dividends that grow constantly and is useful to investors who want to know the current price of a company’s share, relative to its dividend payouts. Using the constant dividend growth model, we could calculate the value of Qantas’s stock as described below
We will use different financial indices for the past five years. For example, the company reported that it intends to pay $1 dividend per share in 2016 and expects this figure to increase by 5% annually thereafter (Raszkiewicz 2015). The required rate of return for the company’s stock is 10% and the current stock is trading at $10 per share. Using the constant dividend rate model, the intrinsic value of the company’s share is as follows
$1.00(.10-.05) = $20
According to the constant dividend growth model, Qantas’s stock is worth $20 per share. Since its current trading price is $10, the model suggests that the stock is undervalued. This finding emerges from the premise that the company’s dividends would grow at a steady rate. Although experts apply this assumption in many statistical computations, it does not reflect the true picture of companies that are declining, or growing. This inaccuracy is one weakness of the Gordon growth model.
Analysis of Items in the Profit and Loss Statement
According to the diagram below, Qantas has experienced steady profitability from 2010 to 2013.
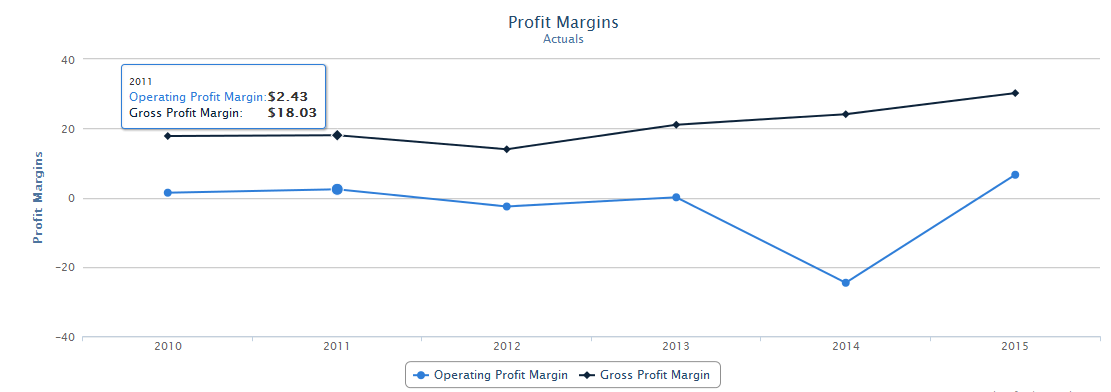
There was a significant slump in profitability for the 2013/2014 financial year, but it recovered in 2015 when the airline posted the highest profitability numbers for the five years under analysis (Morning Star 2016). However, this analysis only explains the trend in operating profit and not the gross profit margin. The steadiness of the gross profit margin shows that the company’s sales were relatively constant throughout the period under analysis.
Assets
The profit and loss statement of Qantas, for 2010 and 2011, shows that the non-current assets represent more than 70% of the company’s assets. This is because of its valuation of property, plant, and equipment. Under this analysis, we find that the assets cover 65% of the total assets because of the increased acquisition of aircrafts and its engines (Morning Star 2016). The company also transferred these assets for $1541 million.
The acquisition of the aircraft and its engines also amounted to $542 million (Morning Star 2016). The asset transfer process offsets a depreciation of $996 million. In 2015, the company’s current assets represented 27% of the total assets. Nonetheless, the company’s cash and cash equivalents accounted for almost 17% of total assets (Morning Star 2016). Here, it is also crucial to point out that there was a decline of cash and cash equivalents for the 2013/2014 financial year.
Liabilities
In 2014, Qantas airline relied on its debts to finance most of its operations. This debt reliance accounted for most of the company’s liabilities. Interest-bearing liabilities accounted for the highest current liabilities at 37%.
Equity
Throughout the period under analysis, Qantas equity represents 29%-30% of the owner’s equity (Morning Star 2016). There was no significant change in issued capital. However, there were significant changes in non-controlling interests of the company. It is also crucial top point out that because of a good financial performance in 2015; the company’s retained earnings increased from 20% to 23% (Morning Star 2016). Although shareholder equity also increased during the same period, there were no significant changes in proportion. Stated differently, the figure was still 99% to 100% in the period under analysis.
Ratio Analysis
Liquidity
Current Ratio Analysis
The current ratio analysis is determined by comparing the current assets and current liabilities. The purpose of doing so is to establish a company’s liquidity, and to determine whether it could pay its current liabilities, or not. The current ratio of Qantas airline for the past five years ranged from 0.47 to 0.93 (Guru Focus 2016). This value range shows that Qantas’s liquidity is poor and that the company may have trouble meeting its current obligations. A current ratio of “1” means that the current liabilities equal the company’s current assets. Investors and creditors normally prefer a current ratio of “2” and above because this would mean that the company’s current assets are twice the value of current liabilities.
However, the poor current ratio of Qantas airline does not necessarily paint a bleak future for the company’s future financial prospects because it could always borrow against this prospect and meet its current obligations. Some of the most impressive current ratios in the airline industry range from 1.5 to 2.5 (Guru Focus 2016). Such is the case of some European airlines such as Ryanair and Air France KLM. However, most airlines in the world have experienced a declining current ratio in the past ten years (Fleisher & Bensoussan 2015).
Profitability
Net Profit Margin Ratio
The net profit margin is also the return on sales ratio. Financial experts usually use it to explain the income a company earns from each dollar of sales (Fleisher & Bensoussan 2015). Expressed as a ratio, this financial index helps to explain how fast a company could convert its sales to net income. The net profit margin ratios for Qantas for the five years ending 2015 are 0.84, 1.74, -1.64, 0.03, -18.76, and 3.59. The net profit margin ratio for the industry is 4.0%. This figure shows that over the past five years, Qantas’s net profit margin ratio performance has been below the industry’s average. This finding shows that the company is relatively less competitive than its rivals are.
Return on Total Assets
The return on assets analysis is important in evaluating a company’s potential to generate profits for its shareholders, using its assets. Experts often express it as a percentage of the profits earned per dollar of assets (Fleisher & Bensoussan 2015). An analysis of Qantas’s return on assets reveals that the company’s ROA, for the period under analysis was 0.56%, 1.23%, -1.17%, 0.02%, -15.16 and 3.20% for the years 2010, 2011, 2012, 2013, 2014, and 2015 respectively. As of 2015, the average ROA in the airline industry was 8.25% (Guru Focus 2016). This means that Qantas’s ROA is below the industry’s average (a sign of low profitability). This analysis also reveals that the airline is using its assets less effectively than other airlines in the industry.
Capital Structure
Debt Ratio
The debt to equity ratio helps to measure a company’s financial advantage. Fleisher and Bensoussan (2015) say experts often determine this figure by dividing the total liabilities by stockholder’s equity. This financial index shows the extent that a company is using its debts to leverage its financial position in the market, relative to its stock value. If the company takes on few debts, investors perceive it to have low risk. The opposite is also true because if it takes on many debts, people perceive it to have a high risk.
Here, a company’s debt to equity ratio would be helpful in understanding the riskiness of a company’s financial structure. Qantas’s total debt to equity ratio for 2010, 2011, 2012, 2013, 2014 and 2015 are 0.86, 0.89, 0.92, 0.88, 1.84, and 1.39 respectively (Morning Star 2016). The average long-term debt to equity ratio in the airline industry is 0.91 (Morning Star 2016). A comparison of this figure with the debt ratio of Qantas airline reveals that its performance is within the industry’s average.
Interest Cover Ratio
A company’s interest cover ratio is important in determining whether it could meet its interest payments, or not. A high interest cover ratio means that a company could meet its interest payments, while a low interest cover ratio means that it is unable to meet its interest payments. The interest cover ratio for Qantas airline during the periods of 2010, 2011, 2012, 2013, 2014 and 2015 were 1.7, 2.06, 0.02, 1.06, -12.9, and 3.26 (Morning Star 2016). The interest cover ratio for the industry is 14.1 (Morning Star 2016). An assessment of these figures, compared with the interest cover ratio for Qantas during the period under investigation, shows that it is performing below par. The implication of this finding is the inability of the company to cover its interest payments. This finding has a negative implication on the company’s capital structure.
Market-Value Aspects
Price-Earnings Ratio
The price earnings ratio is a measure of a company’s stock price, relative to its earnings per share. As of December 2015, the airline’s price earnings ratio was 13.42. In 2015, analysts estimated that the average price-earnings ratio in the airline industry was 8.07 (Morning Star 2016). This figure, when compared to the recent price-earnings ratio for Qantas, reveals that the airline is performing better than other airlines in the sector. Broadly, this metric shows that its investors could get better returns for their stock in the company, at least better than other people who invest in other industries.
Conclusion
Based on an analysis of the key financial ratios of Qantas airline, this paper recommends that it is not advisable to invest in the company. This recommendation stems from the company’s average financial performance. For example, although the price-earnings ratio shows that its investors are likely to get good returns on their investments, an analysis of its capital structure, through an analysis of its debt ratios, reveals an average performance. The interest cover ratio demonstrates that the company could have trouble paying for its interest payments and an analysis of its ROA shows that the airline’s performance is below the industry’s average.
The net profit margin ratio also affirms the same position because it demonstrates the company’s low performance. These financial ratios are ironic for Qantas because it is an established company and it should have strong operating cash flows. In terms of managing its risks, the company should also have strong yearly cash flows to maintain a good investment quality rating. Comprehensively, most of the financial metrics analysed in this study reveal that the company’s future is bleak.
References
Addis, J. 2015. Why Qantas shares will always struggle for altitude. Web.
Brentani, C. 2003. Portfolio Management in Practice, Butterworth-Heinemann, London.
Creedy, S. 2015. Qantas International’s market share slips as capacity growth slows, Web.
Fleisher, C & Bensoussan, B. 2015. Business and Competitive Analysis: Effective Application of New and Classic Methods, FT Press, New York.
Guru Focus. 2016. Qantas Airways Ltd., Web.
Morning Star. 2016. Qantas Airways Ltd: Key Ratios. Web.
Omics Group. 2016. History of Qantas. Web.
Raszkiewicz, O. 2015. Should you buy Qantas Airways Limited at this share price?. Web.
Share Fundamentals. 2016. Qantas Airways Limited. Web.
Tracy, A. 2012. Ratio Analysis Fundamentals: How 17 Financial Ratios Can Allow You to Analyse Any Business on the Planet, RatioAnalysis. New York.