Introduction
Kellogg Company was founded in 1906 and later incorporated in 1922 in Delaware (Kellogg Company, 2016). The Company, alongside its subsidiaries, is in the business of manufacturing and marketing ready-to-eat cereal and convenience foods (Kellogg Company, 2016). By January 2, 2016, Kellogg Company had nearly 33,577 workers.
The principal products of the company include ready-to-eat cereals and other convenience foods. Kellogg Company is recognized for snacks, crackers, cookies, cereal bars, and veggie foods among others. The Company manufactures its products in 20 countries and distributes them across 180 countries (Kellogg Company, 2014). The brand name of Kellogg is used to market these products. It uses direct sales force to reach grocery stores for subsequent resale to consumers. Nevertheless, the Company relies on brokers and distributors to sale specific products. Such arrangements are also adopted for less developed markets and some markets located outside the core markets.
The major raw materials are agricultural commodities and plastic for product packaging.
While Kellogg Company can sell its products evenly throughout the year, seasonality associated with higher demands has been noted in the second half of the year because of multiple events and holidays. Kellogg Company also bakes certain cookies for specific customers such as the US Girls Scouts during the first quarter of the fiscal year.
The major customer of the Company is Wal-Mart, Inc. It derives more than 20% of annual revenues from Wal-Mart and its affiliates. These sales are done in the US market.
Kellogg Company faces direct intense competition from other advertised, branded products in the domestic and international markets. In addition, competition also emanates from unadvertised, private brands, which are generally sold at low prices. In fact, the Company has identified several elements related to competition such as pricing, quality, tastes, nutritional value, convenience, and promotion among others (Kellogg Company, 2015).
The purpose of this report is to present financial analysis of Kellogg Company for a three-year period (2013-2015), identify existing finance-related problems within the company and propose valid recommendations where applicable based on relevant findings.
Financial Analysis
Financial Ratios
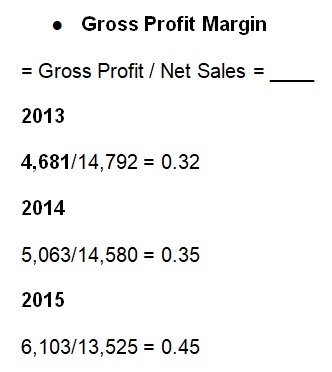
The Company’s gross profit margin has increased in the last three financial years from 0.32 to 0.45 (Kellogg Company, 2014, 2015, 2016). This increment could be attributed to growing net sales and almost stable costs of goods sold.
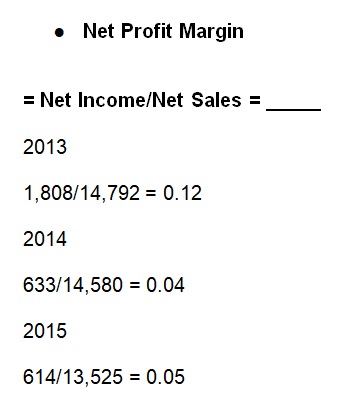
Kellogg’s net profit margin continues to decline because of increasing interest expenses and losses from unconsolidated entities (Kellogg Company, 2014, 2015, 2016). While the company makes profits from every dollar after expenses, the rates are generally low.
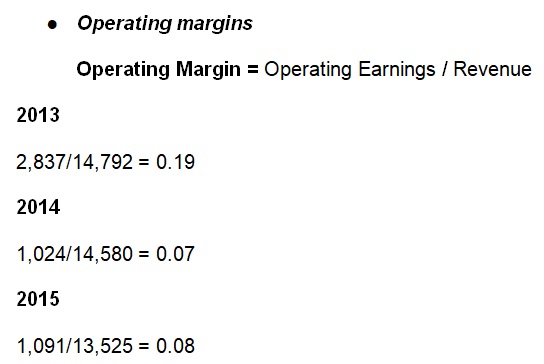
The Company’s operating margins continue to decline from 0.19 to 0.08 in the last three fiscal years (Kellogg Company, 2014, 2015, 2016). This decline could be attributed to fluctuations in net sales, costs of goods sold and expenses.
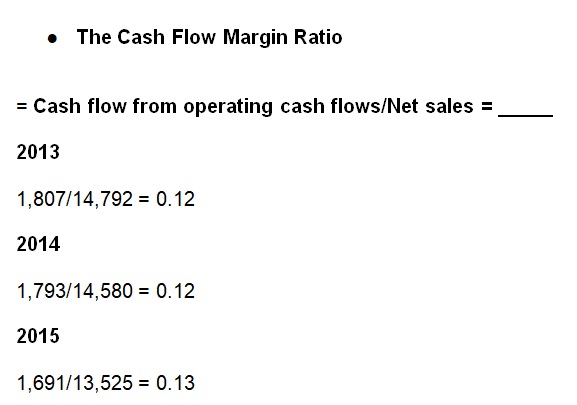
The Company is currently generating revenues from its product sales. However, the fiscal year 2013 and 2014 were generally the same with a negligible increment in the fiscal year 2015 (Kellogg Company, 2014, 2015, 2016). Kellogg Company therefore does not face any risks from suppliers and investors.
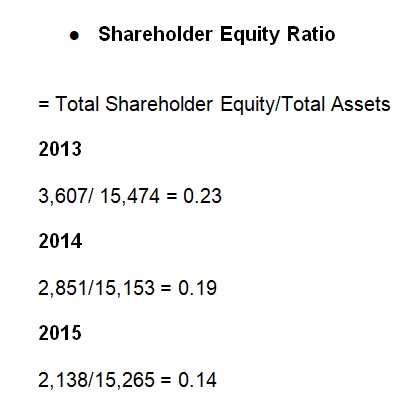
For the last three fiscal years, shareholders’ equity has continued to decline steadily from 0.23 to 0.14 (Kellogg Company, 2014, 2015, 2016). It shows that Kellogg is focused on reducing dependability on shareholders’ contributions to fund its business operations. As such, Kellogg Company has started to utilize its own internal sources of funds to support its investment activities.
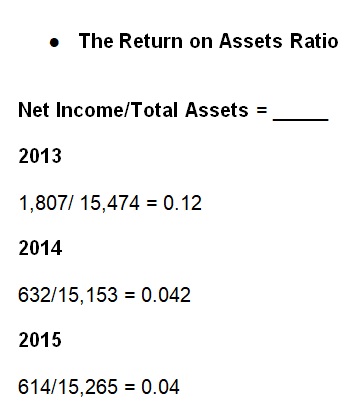
This ratio shows Kellogg Company profitability compared to its assets. The Company can currently use its assets for revenue and profit generation. However, RAO has declined to 0.04 from 0.12 because of declining net incomes or low accounts receivable activities (Kellogg Company, 2014, 2015, 2016).
The Company can leverage assets to control debts and increase returns for its shareholders. The declines in ROA year-over-year show lesser profitability and poor growth in assets for Kellogg. Kellogg Company should improve ROA by increasing net incomes without investing in expensive new assets. Otherwise, Kellogg Company can improve efficiency of its current assets.
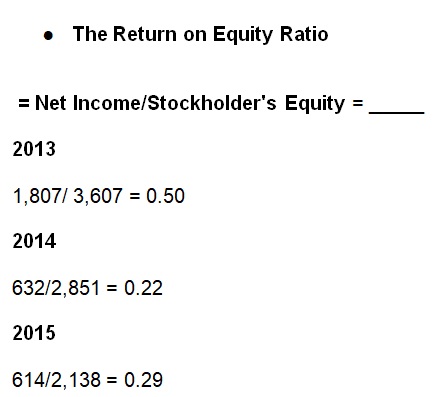
In the fiscal year 2013, the Company had a higher ROE of 0.50 (Kellogg Company, 2014). This ratio however declined to 0.22 and increased to 0.28 for fiscal years 2014 and 2015 respectively (Kellogg Company, 2015, 2016). This implies that shareholders’ returns continue to decline because of a decline in net incomes.
It is therefore advisable for investors to consider entities with stable ROE over time. While this ROE could be good for investment decision, any further declines should signal investors to be extremely cautious. Nevertheless, Kellogg Company is still profitable and continues to focus on internal resources rather than shareholders’ equity for expansion activities.
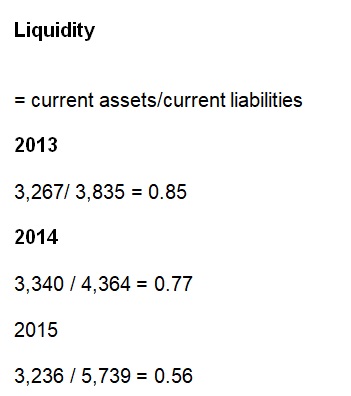
Kellogg Company may have a serious liquidity challenge because low liquidity ratios (less than one) demonstrate that the company may not easily fulfil its short-term obligations (Kellogg Company, 2014, 2015, 2016).
Kellogg Company has low liquidity ratios and, therefore, it can hardly satisfy its near-term obligations using current assets (current ratio) or available total cash. While Kellogg Company can change its short-term assets into cash in order to clear its debt easily, the amount generated will not be sufficient. Thus, the Company could face bankruptcy. Kellogg Company could present a case as a going concern for investors.
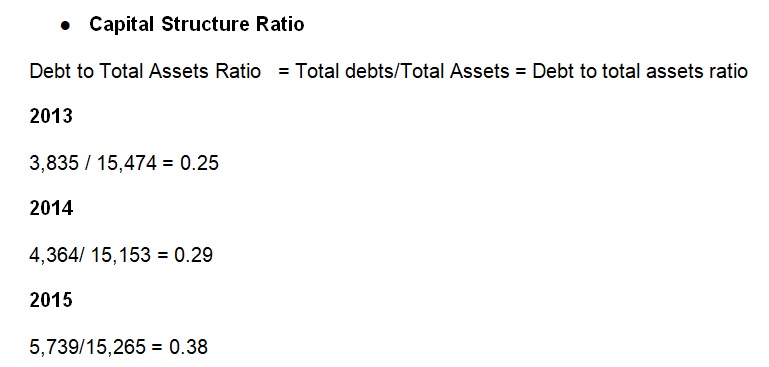
These ratios demonstrate that Kellogg Company does not heavily depend on debts to fund its business operations (Kellogg Company, 2014, 2015, 2016). A good company should generally not have more 50% of the capital structure in debts because it may surpass its borrowing limit (usually 65%).
Hence, any investor can apply these ratios to comprehend the financial health of Kellogg Company. Investors can make wise decisions during investments. Furthermore, loan officers also use these ratios to assess credit worthiness of a company while the Company executives will use these financial ratios to improve their productivity and profitability (Warren, 2014).
Horizontal Analysis / Trend Analysis
Horizontal analysis involves the comparison of account balances and ratios over different fiscal periods. In this case, similar accounts, for instance, are compared against each for the given fiscal years between 2013 and 2015
The horizontal analysis computes the percentage change as indicated in the Income Statement for the periods under study. It is imperative to assess change in Kellogg Company profits. The Company net income reduced by 64.99% and 3%. By focusing on expenses and sales, one can comprehend how net incomes declined.
- Sales have declined up to 7.23 percent
- Interest expense has increased by 8.6 percent
Besides, Kellogg Company has not been able to record stable items in its Income Statement. That is, it is characterized by steep declines and narrow increments. Overall, it is the decline in sales, which has a significant result on the net income of the company. The company continues to grapple with declining net sales and increasing expenses leading to low net incomes.
These unstable trends are not suitable for the company financial health and, therefore, they should be investigated against the management expectations.
Vertical Analysis
Vertical analysis focuses on every item in the Income Statement and presents them as sales percentage. The vertical analysis gives the management an opportunity to watch for outcomes if cost of goods sold or other expenses seem to be extremely higher relative to sales (Kellogg Company, 2014, 2015, 2016). By assessing and comparing these figures, the management and accounting department can evaluate causes and determine the best solution to the problem.
It is evident that net income percentage increased by 9.22 percent from 4.15% in 2013 to 13.37% in 2015. In terms of actual dollar, the increment is $1,194 ($614 to $1,808). It is imperative to assess both percentage variation and actual dollar amount variations.
Company’s Stock Price Evaluation
Stock Activity.
Given the above presented figures, Kellogg Company has interesting figures for further analysis. The Company is currently generating returns from stock marketing activities, which is a good sign for potential investors. In addition, the stock is also classified under slow growth category (Morningstar, Inc., 2015).
It is however pointed out that Kellogg Company share price seems to be overpriced now. In this case, Kellogg Company might not be a good option for investors searching for a bargain. Thus, they should probably consider the industry peers. Nevertheless, Kellogg Company has a great stock for investment.
The Company has a good market cap of 26,859.98. The market cap shows that Kellogg Company has a better hold on its market value of the outstanding shares. This current position depicts elements of asset allocation and risk return elements for the stocks (Morningstar, Inc., 2015).
Table 1: Stock (Morningstar, Inc., 2015).
Kellogg Company P/E is currently noted at 43.7. As such, investors can easily assess Kellogg’s stock valuation and its share prices against the income. A reasonable P/E value gives investors an opportunity to forecast possible earnings of the company (Costello, 2016). It is estimated that the P/E will be 19.21 in the next 12 months. In this case, investors are most likely to have positive returns when they compare current earnings against the estimated possible earnings in the future.
Kellogg’s price-to-sales ratio (P/S) is 2.0. Thus, Kellogg Company is clearly a better investment option because investors will pay less for every amount of unit sold. However, it is difficult to get complete information from P/S ratio because a low ratio could reflect unprofitable activities.
The P/B is currently 12.4. For this ratio, many investors believe that the Company will create more value from its existing assets. It is noted that Kellogg Company market value is relatively higher when compared to accounting value. Kellogg Company current P/B clearly demonstrates elements that investors can rely on to identify good stocks. At the same time, it also reveals what investors are most likely to pay if the company declares bankruptcy now.
Comparison with the Industry Average and selected Peers
Table 2: (Morningstar, Inc., 2015).
Based on the industry average, Kellogg Company has a high dividend yield. It is also generating incomes at a decent rate. Besides, Kellogg Company appears to be stable and presents stable growth patterns albeit slowly.
Discussion Section
Financial Health of Kellogg Company
Kellogg Company has posted mixed results over the three fiscal years analyzed as shown in various analyses, including horizontal analysis. For instance, in the fiscal year 2015, Kellogg Company net sales declined by 7.1 percent compared to an increment of 9.53% recorded in the fiscal year 2014. Kellogg Company attributed the decline to unfavorable effects of foreign currency exchange and shipping day variations.
The operating profit for the fiscal year 2014 was -63.9%. In the fiscal year 2015, however, the operating profit grew by 6.55%. The Company attributed this increment to favorable year-over-year variation in the pension market-to-market. It partially offset the negative effects of foreign currency exchange.
The Company’s annual interest expense increased by 8.6% in the fiscal year 2015. The increment was linked to a significantly higher average rate of long-term debt and some high interest rates. These higher rates were majorly related to lower rates of debt swap. In the fiscal year 2014, however, Kellogg Company noted a decline in interest expense because of refinancing of “maturing long-term debt at lower interest rates and lower interest rates on long-term debt which has effectively been converted to floating rate obligations through the use of interest rate swaps” (Kellogg Company, 2016, p. 38). The Company expects its interest expense for the fiscal year 2016 to range between $235 million and $245 million.
It also observed that income tax rates were cushioned by the mark-to-market loss noted in the pension plans. The Company has noted that changes in the foreign exchange markets generally affect its income tax rate because it depends on US dollar earnings from the foreign operations that distribute Kellogg’s products across different countries with diverse statutory tax rates and regulations. Further, the Company has pointed out that future income tax rates could be affected by pending unclear tax issues such as tax positions that would be adversely influenced by government planning policies. These issues are often resolved in less or more favorable manners than the Company expects.
Vertical analysis shows that Kellogg Company rates of cost of goods sold as a percentage of net sales have continued to rise steadily from 58.74% in 2013 to 65.4% in the fiscal year 2015. This situation generally affects the overall net income of the company. The Company should therefore focus on meaningful initiatives to reduce cost of goods sold.
Kellogg Company main source of liquidity is its operating cash flows, which are supported by borrowing for strategic investments, including major acquisitions and other important business deals. The Company understands that its cash-generating capabilities are vital as its critical strengths. These capabilities ensure that the Company has adequate financial flexibility to meet operating and investing requirements.
Kellogg Company has historically noted negative working capital. The Company has attributed this trend to its attempts to revamp the core working capital by lessening the rate of trade receivables and inventory. At the same time, the Company focuses on improving the timing of paying trade payables. Further, Kellogg Company has high amount of indebtedness that causes “current maturities of its long-term debts and notes payable which can have a significant impact on working capital as a result of the timing of these required payments” (Kellogg Company, 2016, p. 39). These factors, alongside the use of constant cash flows from operations to fund debt obligations, fund expansion and acquisition efforts, pay dividends, and repurchase common stock, have significantly reduced Kellogg Company working capital levels.
In fact, the liquidity ratios show that for the latest three fiscal years (2013-2015), Kellogg Company ratios have declined from 0.85 to 0.56. As such, Kellogg Company may have a serious liquidity challenge because low liquidity ratios (less than one) demonstrate that the company may not easily fulfil its short-term obligations.
In 2015, the Company had a negative working capital of $2.5 billion while in 2016, the negative working capital was $1 billion. Nevertheless, Kellogg Company shows that its operating cash flows, coupled with its line of credit facilities and other debt arrangements, will be enough to cater for operating, investing, and financing requirements of the Company in the probable future. In this case, the Company must watch market volatility or possible disruption in the credit and capital markets.
The capital structure of the Company is shown as 0.25, 0.29, and 0.38 for the fiscal year 2013, 2014, and 2015 respectively. Kellogg Company does not heavily depend on debts to fund its business operations. A good company should generally not have more 50% of the capital structure in debts because it may surpass its borrowing limit (usually 65%). The Company uses its cash and cash equivalents to fund capital and other cash operations in the global markets.
For operating activities, net earnings from cash receipts less cost of goods sold have been the major source of operating cash flows for the Company. However, the Company noted a decline in net cash by operating activities for the fiscal year 2015 to $1,691 million. This decrease was $102 million lesser than the previous year. Year-over-year impacts of accounts receivable have been responsible for the negative trend. Nevertheless, Kellogg Company often finds mitigating measures from supplier financing arrangements.
Conclusion and Recommendations
The report has covered financial analysis of Kellogg Company financial statements for the fiscal period 2013 to 2015. Financial ratio, vertical, and horizontal/trend analyses reveal different outcomes in some instances. Except for gross profit margins, other margins such as net profit, operating, and cash flow are mainly declining or marginally stable. Kellogg Company generally has a good capital structure ratio, return on equity, and return on assets. However, the Company faces serious liquidity problem, high cost of goods sold and some observers argue that its share are overpriced.
It is therefore recommended that Kellogg Company should improve its liquidity position, reduce cost of goods sold, general expenses, and improve stock market activities to stabilize share prices. At the same time, Kellogg Company must understand how impacts in the global capital and credit markets could affect its operations and investment initiatives. The Company has also identified foreign currency exchange as a major factor that affects its income tax and net income. Besides, the Company faces multiple competitors, including unknown private companies. These forces will continue to put pressure on the Company and perhaps negatively affect its revenue and profitability. Nevertheless, the Company is making profits and paying dividends and is a good investment option for potential investors.
References
Costello, A. (2016, February 19). Top Stocks of the day: Kellogg Company (NYSE:K). Web.
Kellogg Company. (2014). 2013 Annual Report. Web.
Kellogg Company. (2015). 2014 Annual Report. Web.
Kellogg Company. (2016). 2015 Annual Report. Web.
Morningstar, Inc. (2015). Kellogg Co. Web.
Warren, C. S. (2014). Survey of Accounting (7th ed.). Stamford, CT: South-Western College Publishers.