Multi-step and single-step income statement
The single step process of preparing an income statement involves the determination of the total revenues and the total expenses of the company and finally determining the net income of the business in only a single step through the process of subtracting the total expenses from the total revenues (Godwin & Alderman, 2012). Conversely, the multi-step method of determining a company’s net profit entails the grouping of various types of revenues and expenses together and then determining various types of income subtotals. Some of the income subtotals include the gross profit, operating profit, earnings before interest and net income (Godwin & Alderman, 2012).
Compare and contrast usefulness
The single step method is useful due to its simplicity to the accounting preparers as well as to the financial statement users. This implies that this method is easy to use and understood by parties interested with the financial statement of the company. This is because the total revenues and expenses are easily established (Godwin & Alderman, 2012). In contrast, the multi-step method is useful to the management in that it includes the subtotals of different profits, which offer detailed information about a company’s generation of net income. This helps the management in gaining more insight into the running of the business as well as its financial position (Godwin & Alderman, 2012).
The single step method is very useful for vertical analysis. This is because costs on various expenses are shown in different heads and this makes it easy to establish the cost for each item of expenses as per sales (Godwin & Alderman, 2012). In contrast, the multi-step analysis is useful in determining the company’s gross profit, which is equivalent to subtracting cost of goods from sales for the period. This is useful in establishing the extent to which the company is earning on sales before the incorporation of operating income (Godwin & Alderman, 2012). In addition, gross profit helps the management in determining gross margin, obtained by dividing the gross profit with sales. The management can use such profit margin by comparing it with past periods as well as industry standards in determining the way in which the company is generating profits on sales (Godwin & Alderman, 2012).
Additionally, the multi-step method separates operating incomes from non-operating incomes. This enables the management in establishing how much of the net income originates from the normal business activities of the company (Godwin & Alderman, 2012). This is because non-operating incomes involve events that may only arise once and may not necessary influence the long-term viability of the organization, while this is not the case in the single step analysis. Again, while the multi-step method can determine various financial ratios such as the profit margin, it may be difficult to determine such ratios using the single-step method (Godwin & Alderman, 2012).
In comparison, both the multi-step and single-step methods offer some forms of benefits to the management as well as to the investors. This occurs due to the usefulness of the various determined income in determining the level at which the business is operating as well as in making informed decisions pertaining to investment in such businesses (Godwin & Alderman, 2012).
Compare and contrast limitations
One of the main limitations of the single step method is that it fails to establish the amount of income that is attributable directly from the usual business activities, and how much comes from both the unusual and non-recurring sources of the business (Godwin & Alderman, 2012). In contrast, one of the limitations of the multi-step method is that it takes a longer duration in its preparation as compared to a single step method. This occurs due to the much time needed in analyzing each individual component of revenues and expenses in order to establish the different subtotals of profits (Godwin & Alderman, 2012).
Additionally, the single step method fails to meet the basic objective of financial statements, which involves the determination of basic information on the income generating capacity of the business; that is, both normal and usual business activities, since such activities are the primary sources of business income. Details related to earnings before tax cannot be easily determined using this method (Godwin & Alderman, 2012). In addition, operating profits used in paying interest to lenders cannot be easily determined using the single step method as compared to the multi-step method. Conversely, the multi-step method may also lead to increased confusion (Godwin & Alderman, 2012). This may arise due to its difficulties in interpretation because of the way in which some of the items are calculated. In addition, it is also difficult to comprehend most of the individual items in the operating and non-operating parts of the multi-step method (Godwin & Alderman, 2012).
Gross profit, operating profit and net income analysis in 2012
Currency in millions of US dollars
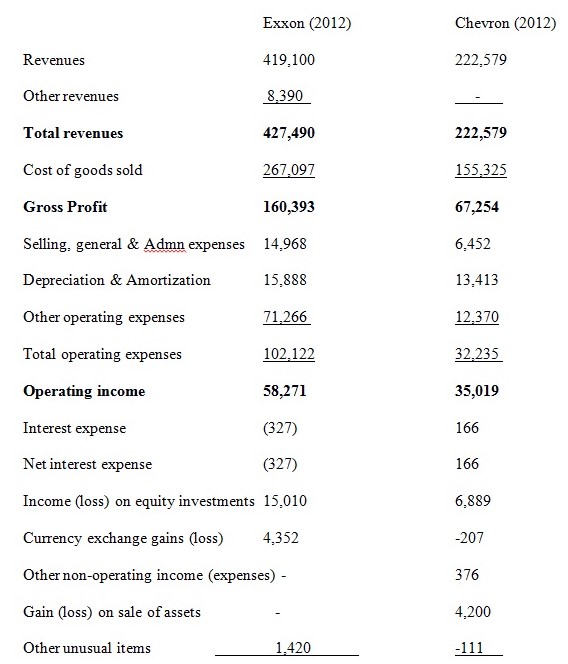
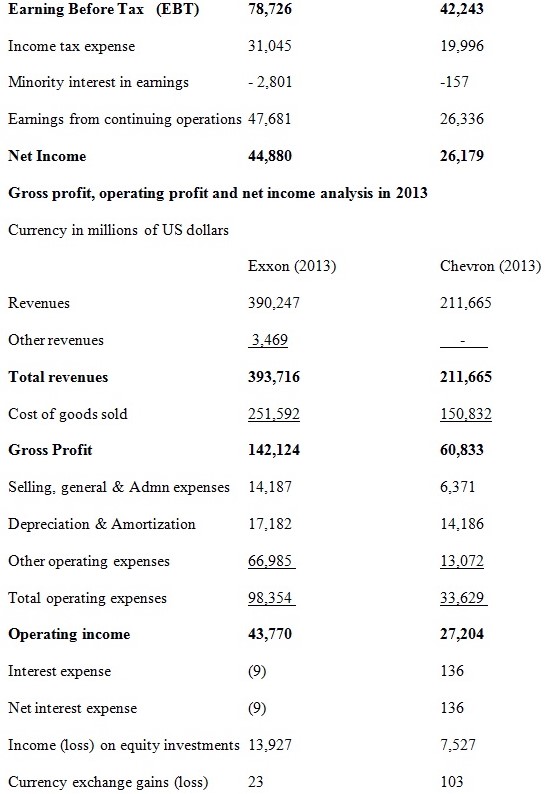
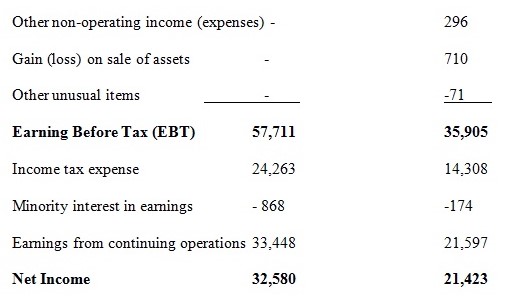
From the above analysis, Exxon’s gross profit decreased in 2013 to 142,124 from 160,393 in 2012. Chevron’s gross profit decreased in 2013 to 60,833 from 67,254 in 2012. The decline in gross profits is largely attributable to the decrease in total revenues for the year 2013 in both companies (ExxonMobil, 2013). The operating profit of Exxon decreased in 2013 to 43,770 from 58,271 in 2012. This change occurred due to the decline in gross profit since the operating expenses changed slightly as compared to the previous year (ExxonMobil, 2013). The operating profit of Chevron decreased in 2013 to 27,204 from 35,019 in 2012. This decline is associated with the increase in operating expenses in 2013 as well as in the decline in the gross profit for the company. The net profit of Exxon decreased in 2013 to 32,580 from 44,880 in 2012. The net profit of Chevron decreased in 2013 to 21,423 from 26,179 in 2012 (Chevron, 2012).
Why Exxon was more profitable than Chevron
“Efficiency in generating profits from sales”
Exxon had a better gross margin in 2012 and 2013 as compared to Chevron. Gross margin for Exxon in 2012 was 37.5%, while that of Chevron was 30.2%. This shows that Exxon generated higher profits from sales as compared to Chevron. This ultimately contributed to Exxon’s better profits (ExxonMobil, 2013).
Operating costs
Exxon’s operating costs were cheaper in relation to the generation of revenues as compared to that of Chevron. This contributed to Exxon’s higher operating income as compared to that of Chevron (ExxonMobil, 2013).
Non-operating and unusual costs
From the analysis, Exxon’s non-operating and unusual costs were cheaper in relation to the generation of revenues as compared to those of Chevron. This led to Exxon generating higher net income as compared to Chevron (Chevron, 2012).
Computations
Assumptions and estimates
- Use of sales estimates that make the company’s earnings and sales appear as though they are growing faster than they really are (ExxonMobil, 2013).
- Company’s prediction on bad debts
- Adjustment in costs of obsolete inventory before it is sold
- Forecast of unusual losses and gains (Chevron, 2012).
- Massaging of cash in the cash flow statements
Quality of company earnings
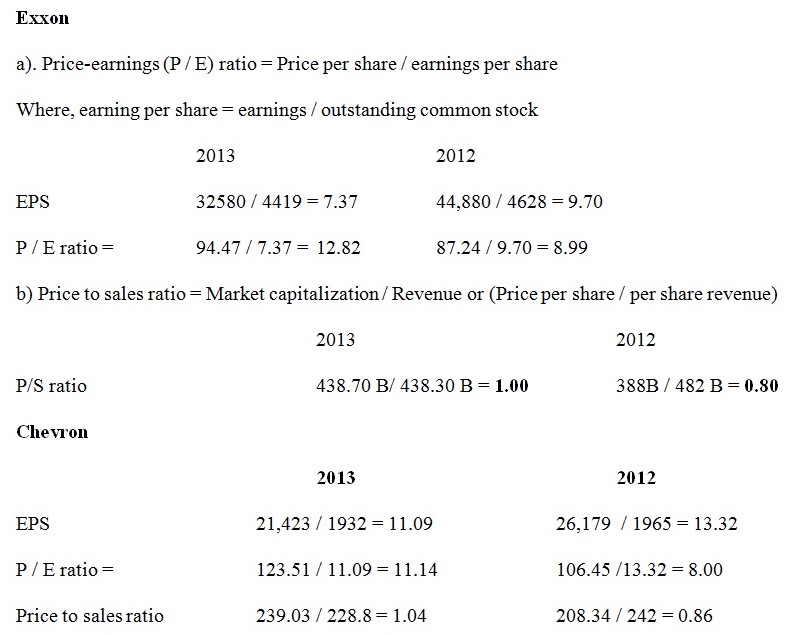
In 2013, Exxon and Chevron had a price to sales ratio of 1.00 and 1.04 respectively. These figures show that the two companies had a P/S ratio that was relatively the same. In 2013, Exxon and Chevron had a P / E ratio of 12.82 and 11.14 respectively. Both ratios were below the industry average, which means that the shares are underpriced and they may outperform the market. Hence, this is a good indicator to investors that both companies have quality in their earnings (Chevron, 2012).
Income statement notes
Non-controlling interest
This represents ownership interests in the company’s subsidiaries owned by other parties other than the parent. A higher non-controlling interest may imply that other parties control a substantial amount of the subsidiary (Chevron, 2012). I will invest in the company with a lower minority interest between the two. This is because a low minority interest implies that the parent company controls a good percentage of the subsidiaries (Chevron, 2012).
Tax
Income tax may influence the decision on whether to make investment in certain firms. It is advisable to make investments in a firm that has uncertainty in its tax. This is because it results in higher premiums. Hence, I would invest in the company with tax uncertainty because it will provide flexibility while reporting book income. In addition, I will invest in the company with a lower effective tax rate (ExxonMobil, 2013).
References
Chevron: 2012 Annual report. Web.
ExxonMobil: Financial statements and supplemental information. (2013). Web.
Godwin, N. H., & Alderman, C. W. (2012). Financial ACCT. Mason, Ohio: South-Western