Introduction
This report carries out a strategic evaluation of Aberdeen Asset Management PLC using the fundamental model, cash based and asset based evaluation models. Moreover, the report outlines the major weakness of this model in the valuation of a firm. The report also uses P/E ratio and ratio analysis to evaluate the financial position of the firm. The earning per share uses multiple valuation model to assess the financial performance of the company. The cash based model uses FCFF and FCFE. This report has established that Aberdeen Asset Management PLC is highly geared. Moreover, sales level has been deteriorating due to the share price volatility in China and high interest rate of the dollar.
Strategic analysis of Aberdeen Asset Management PLC
Snapshot of Aberdeen Asset Management PLC
Aberdeen Asset Management PLC is a listed company in the UK. The company has gained presence in other parts of the world. It is an independent asset management company, which was listed in the UK stock exchange in 1991. The company was formed in Aberdeen in 1983, but has expanded over the years to open branches in 38 countries. Aberdeen Asset Management company obtains most of its revenues from financial assets such as equities, property, fixed income, and third parties.
The company compiles and segregates that expertise on different pools of products globally. The company relies mostly on Central banks, financial institutions and corporate pensions to generate it income. The company has established branches in other parts of the global especially in Asia, America, and Oceania. The company has more than 2,500 workers across 38 countries. The company is headquartered in Aberdeen where major operations of the company are located. The company has its major investment desk in Singapore, Philadelphia, and London. Aberdeen Asset Management Company is the third largest publicly listed company in the UK.
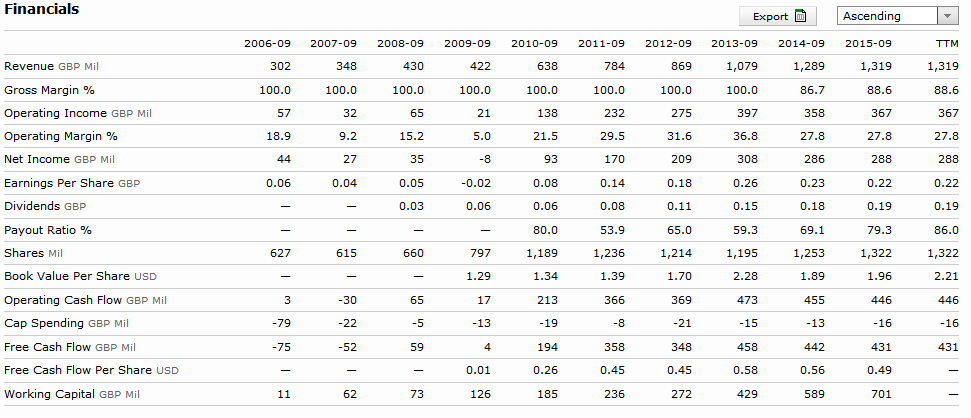
The company has been reporting high revenues in the last five years. However, in 2015, the market share of the company declined by an estimated 13 percent. The company has been facing financial challenges due to the risk exposures and poor management. Moreover, the low oil prices has compelled the company to reduce it staffs in order to minimize expenses. For instance, in 2015, the company is estimated to have lost 1 billion dollars in the emerging market (Aberdeen Asset Management PLC 2015). Due to the high interest rates expected this year, investors have begun to pull out of the emerging market. Aberdeen Asset Management has invested about one fourth of its market share on the emerging market.
Business overview
The primary market for Aberdeen is the management of financial assets such as equities and fixed property. The company offers financial asset management to major financial institutions and central banks across the globe.
In 2015, Aberdeen Asset Management offered a final dividend of 12.0 per share, which was an increase by 8.3 percent compared to the previous year making a total of 19.5 per share. The board is determined to offer consistent dividends as a progressive policy to ensure shareholders earn adequate return for their investment. Aberdeen Asset Management fund declined by an estimated £40bn in 2014 due the share price volatility in China and the its major investment markets in the emerging market. In 2015, the asset management was £283.7bn, which showed a decline from £324.4bn in 2014.
Moreover, the net withdraw from the equity fund increased to £16.4bn compared from the previous year. Investors are pulling out of this market due to the fears that global growth was declining especially in China. Moreover, the expectation that the US interest rates will increase has prompted investors to pull their money out. This has been reflected in 2015 final quarter, which represents the highest outflow in the last five years. (The guardian 2015)
Due to the high outflow, share prices have declined by 4 percent in April 2015. Revenues in the third quarter of 2015 increased by 5 percent, which helped the company to pay dividend up to 19.5 earnings per share.
Financial analysis of Aberdeen
In 2015, the auditor gave unqualified opinion on the financial statements of Aberdeen Asset Management PLC. The audit report noted that the company has prepared all the financial statements as per article 4 of IAS regulations. The audit opinion noted that the company statement represent a fair view of the state of the company as at 30 September 2015. Finally, the auditor noted that the parent company had prepared financial statement in accordance in rule and regulations of international financial accounting standards (Aberdeen Asset Management PLC 2015). This report shows that the company has prepared all the financial statements in accordance with international accounting standards and they represent the fair view of the company.
Financial analysis
Ratio analysis
Table 1 (Financial ratio analysis of Aberdeen).
Table one shows different ratios used to evaluate the financial position of the Aberdeen Asset Management PLC. These ratios include profitability, debt, efficiency solvency, and structural ratios.
In the profitability ratios, the net profit margin has been decreasing in the three-year period on this study. Specifically, the net profit margin has decreased significantly from 28.5 in 2013 to 21.85 in 2015. This is an indication the company is facing challenges in the market. The risk profile has increased due to fears that the company might collapse as a result of stock volatility in China and the emerging market.
As investors pull out their investment in the company, sales declined significantly, this has been reflected in the share prices. In 2015, share prices declined by 13 percent. Aberdeen has a stable asset turnover ratio which is an indication the company is utilizing its assets efficiently to generate revenues (Núñez & Vlachos 2015, p. 5). However, Aberdeen has reported a declining trend in return on asset and return on equity. This decrease can be attributed to the current share price volatility in China that is pulling investors out of the company.
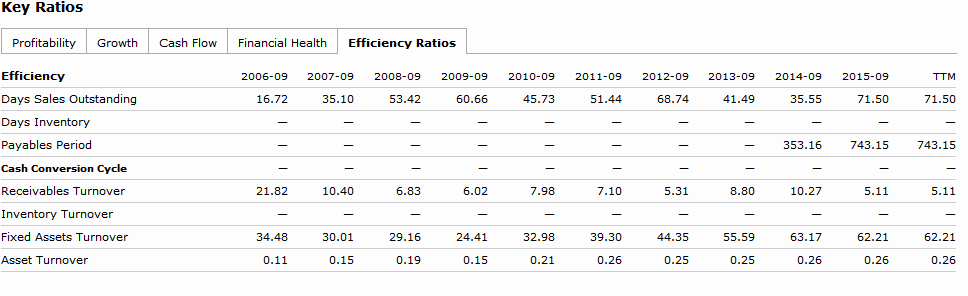
The efficiency ratio shows the ability of a company to utilize its assets in order to generate income. The receivable turnover ratios have improved significantly from 10.27 in 2014 to 5.1 which is an indication the company is collecting its debtors on time. When a company collect is debtors on time, it can be able to invest it in ventures that are more profitable. The fix asset turnover has increased from 55.6 in 2014 to 62.2 in 2015 which is an indication the company is using it asset efficiently to generate profits.
The dividend payout ratio shows management commitment to ensure shareholders earn return for investing in the company. Management has implemented a policy of progressive dividends in the next five year. Therefore, investors should expect dividends to increase every year, which is an indication the company is make enough profits to distribute to shareholders. Finally, the Aberdeen has a stable operating margin, which shows the company is making profits.
Liquidity ratios shows the ability of the company to meet it short-term financial obligation when they fall due. Liquidity ratio one of the most interesting ratios that investors must consider when evaluating the value of a firm in order to make sound decisions. Aberdeen’s current ratios have improved over the three-year period in this study. A higher current ratio is preferred since it shows the number of times current assets can cover current liability. Therefore, Aberdeen Asset Management PLC has a high current ratio, which is good news for investors. Quick ratios have improved slightly from 2013 to 2015, which shows that the company can be able to dispose it most liquid asset quickly to meet its current liabilities.
The gearing ratio shows the company is highly financed by external sources of finance. A ratio of 0.5 of preferred, however, a high ratio shows the company is very risky due to external financing. The solvency risk has increased significantly from 0.86 in 2013 to 1.23 in 2015. Investors should be very cautious when dealing with the firm due to the right that it might fail to meet it obligation, which can led to liquidation. A similar trend is observed in the financial leverage ratios indicating the company is highly relying on external sources of finances.
Although Aberdeen Asset Management is highly geared, the average score shows the company is secure. Therefore, investors should invest in the company
Peer group analysis
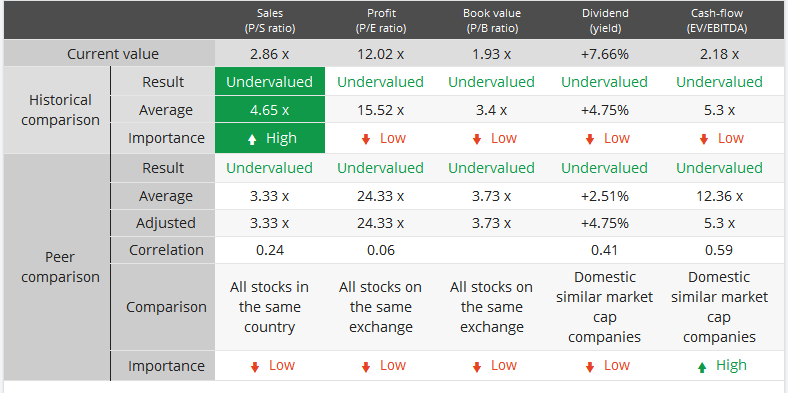
Table II Aberdeen peer ratio analysis.
In table II, the peer financial analysis is based on the industrial performance of the company. In this analysis, the financial ratios of Aberdeen are compared with those of the industry to establish how the company has performed compared to other companies in the same industry (Investing.com 2016).
From table II, the debt ratio shows the company has underperformed when compared with the industrial average. It is an indication the company is highly geared compared to peers in the same industry(Zha & Liang 2015, p. 1291). It also shows that Aberdeen is highly risky when compared with its peers in the industry. Moreover, the asset turnover and inventory turnover ratios were well above the industrial average, which is an indication Aberdeen, outperformed its peers.
The efficiency ratio shows Aberdeen has a high receivable turnover compared with the industrial average.
In the profitability ratios, the operating margin, pretax margin, and net profit margin are above the industrial average. This is an indication the company has outperformed it peers in the same industry. It is also an indication the company is utilizing its asset efficiently to generate income.
The management efficiency ratios: return on equity, return on asset and on investment is below the industrial average. This is an indication the company is performing below the industrial average and its peers. This can be traced back in the loss of investors trust on the company due to stock price volatility in China and in the emerging markets.
The dividend ratios are above the industrial average, which indicate the company is performing well above the industrial average and its peers. It converges with management decision to ensure progressive dividend each year.
Fundamental valuation models
Multiples valuation model
Multiples valuation model is a comparable statistics used to establish the value of a firm. It assumes that companies in the same industry have similar valuation multiples. There are two multiple models which can be used in the valuation of a firm. They include equity and enterprise multiples. Equity multiples are more concerned about investors acquiring share in a company while enterprise multiples are more concerned about mergers and acquisitions. In most cases, there are represented by the price earnings ratio and the value/earnings before interest, depreciation or amortization and tax.
According to the price earning valuation model, Aberdeen’s intrinsic values can be established by the following formula:
Value of Aberdeen= average price earnings* EPS (industrial earning per share)* share issued.
It can be calculated by EV/EBITA as follows:
=average EV/EBITA (industrial)*earnings before interest and tax (firm)
Pro and cons
The major benefit of multiples is the ability to provide investors with adequate information for decision-making. It is an easy method to use which relies on statistical analysis. It is effective in measuring the relative value of a firm compared with the industrial average. Moreover, the model is widely used because it allows investors to approach the value of a firm from different perspective, which is relevant in decision-making.
However, the model does not give a clear comparison of the relative value in order to achieve the primary objective of the model.
Cash based valuation model
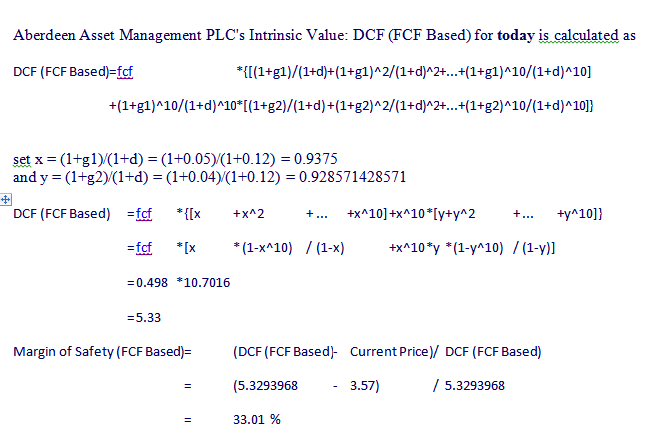
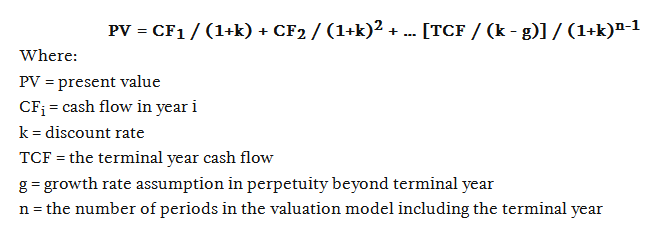
The cash based valuation model is used to estimate the intrinsic value of a company by discounting cash flow. The value of the firm is calculated by discounting future cash flow with a predetermined discounting rate (Young & Yachang 2015, p. 2582). The future cash flow used to calculate the value of the firm is calculated based on cash flow growth rate. The estimated future cash flow is discounted to its present value using a discounting rate. The intrinsic value is calculated by adding all the present value of future cash flow. It can be calculated as follows:
Pros and cons
Cash based valuation model is an effective method of establishing the intrinsic value of a company. However, this model uses the assumption of garbage in, garbage out. A small change in the value of input can affect the entire value of a company significantly. Moreover, the model is complex to uses and might to be applicable in the absence of cash flow
Asset based valuation model
Asset based valuation model is used to determine the value of a firm by focusing on the net asset value or fair value. The asset-based model strives to establish what it would take to recreate the company. The model offers a room for decision making regarding which company assets and liabilities should be included when establishing the intrinsic values of the company. This model offer a general way of valuing a business or security using different methods based on the value of assets and liabilities (Botosan & Huffman 2015, p. 763). The model uses financial statements of the company to establish the fair value of both tangible and intangible asset and liabilities to calculate the intrinsic value of a company. The asset-based approach uses the statement of financial position. However, this method is used when the company is not a going concern. Moreover, this method can be used effectively when the business is purely based on asset such as production companies, investment vehicle
Pros and cons
The major challenge of this model is that it requires the identification of assets and liabilities and a value allocated to each of them. Not everyone can be able to attribute value to all the assets and liabilities of the company. It is complex to compute the value of the firm since some items that are used do not show up in a statement of financial position. It is also complex to judge the value of intangible assets such as patent, trademarks, and contingent liabilities. However, the model is effective when valuing a business that is purely based on asset.
Conclusion and recommendation
Aberdeen Asset Management PLC has a progressive dividend policy, which allows investors to enjoy high earnings per share. However, in the last three years, the company has been facing financial challenges due to the stock market volatility in China and other emerging markets. The volatility in China coupled with high interest rates of the dollar have compelled investors to pull out to avoid losing the value of their investment. The consider Aberdeen a high-risk company where other investors should not invest. The operating margin trend over the last three years has increased. However, the liquidity ratios have increased significantly over the last three years. This is an indication the company is using external sources of finance to fund new assets.
It is recommended that the company should issue new share to raise capital required to finance assets of the company. this will reduce the huge debt levels in the company. moreover, the company should diversify its business operation in order to reduce the risk associated with asset management. Since the company is facing a downward trend in ROE, managers should consider the efficiency of operations especially the P/B ratio.
References
Aberdeen Asset Management PLC. 2015. Annual Report and Accounts 2015. Web.
Botosan, CA, & Huffman, AA. 2015. ‘Decision-Useful Asset Measurement from a Business Valuation Perspective’, Accounting Horizons, vol. 29, no. 4, pp. 757-776.
Investing. 2016. Aberdeen Asset Management PLC (ADN). Web.
Núñez, M, & Vlachos, DG. 2015. ‘Steady state likelihood ratio sensitivity analysis for stiff kinetic Monte Carlo simulations’, Journal of Chemical Physics, vol. 142, no. 4, pp. 1-7.
The guardian. 2015. Aberdeen Asset Management investors withdraw more than £40bn. Web.
Young, S, & Yachang, Z. 2015. ‘Accounting Comparability and the Accuracy of Peer-Based Valuation Models’, Accounting Review, vol. 90, no. 6, pp. 2571-2601.
Zha, Y, & Liang, L. 2015. ‘Aggregated Ratio Analysis in DEA’, International Journal Of Information Technology & Decision Making, 14, 6, pp. 1285-1297.
Appendix
Financial ratio
Valuation of Aberdeen using DCF