Executive summary
This paper provides a comprehensive analysis of key financial ratios of Myer and Harvey companies. They are renowned Australian chain stores that design and sell homewares and electronic merchandise respectively. The aim of the study is to identify their performance level and viability. This is to facilitate the development of accurate investment decisions by potential investors. The report also gives credible information about the evident limitations that the companies operate under and viable recommendations to facilitate the development of accurate investment decisions.
Introduction
Financial ratios are key performance indicators that give a clear picture of a company’s financial strength and performance capacity. Evidently, the financial analysis of Myer and Harvey corporations is done to facilitate the understanding of the institutions financial performance. This is crucial, as it will enable their stakeholders to make credible decisions on viable investment ventures that they hold. Particularly, Meyer Corporation designs and sells quality homecare valuables, men, women and children wears.
It has been able to expand its customer base and market share effectively since its inception. Variably, Hervey Norman Corporation stores and sells electronics, furniture and beddings The Company’s financial capacity has grown due to high sales units that is attributable to its efficiency in inventory turn over management. The companies’ financial ratios are discussed effectively with an aim of establishing their growth potential in future. This is vital since it seeks to give investors an accurate basis on which they can make a credible choice on the best company to invest in between the two.
Body
Profitability Ratios
Gross profit margin
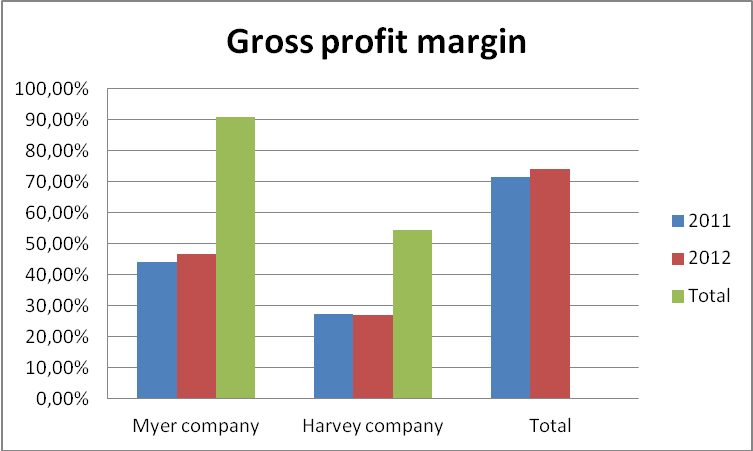
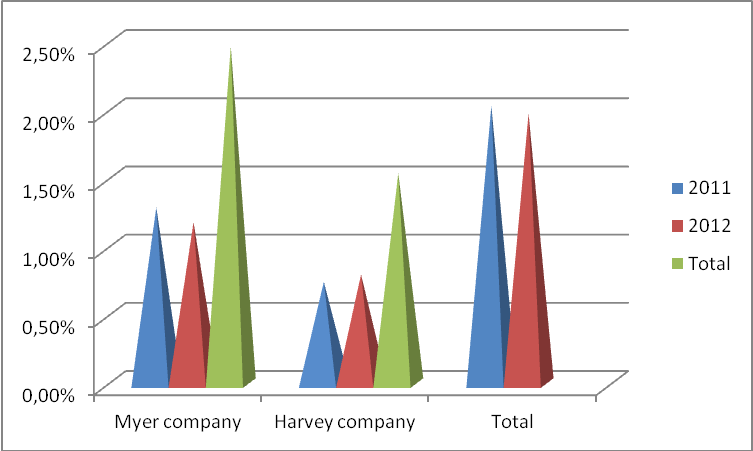
Gross profit margin shows the operating profit that a company has after deducting the cost of sales (Kennon, 2012, p, 1). It gives a clear indication on how a company manages its direct cost of sales that defines the gross performance levels. Although, there is no recommended figure for gross profit margin, the value should be high to enable a company to pay off its operating and financial expenses effectively.
The chart provides gross profit margin analysis of Meyer and Harvey corporations between the years 2011 and 2012. Particularly, Myer Company that has been reporting a strong profit margins over the years reported a profit margin of 46.80% in the year 2012. This represents an increase in its profit margin by 2.73%. Harvey Company also reported appositive performance as evident in its profit margin figures. However, its performance margin reported a decline from 27.43% to 27.14% in the year 2011 and 2012 respectively. The drop in performance level is because of poor management of its cost of sales (Amato, p, 14).
Myers’s exemplary performance is attributable to its proper optimization of resources and low-cost obligations than Harvey Company. It also indicates that the company’s cost of sales has been weighing below the sales value. This gives it more preference as an efficiently managed corporation.
Net profit margin

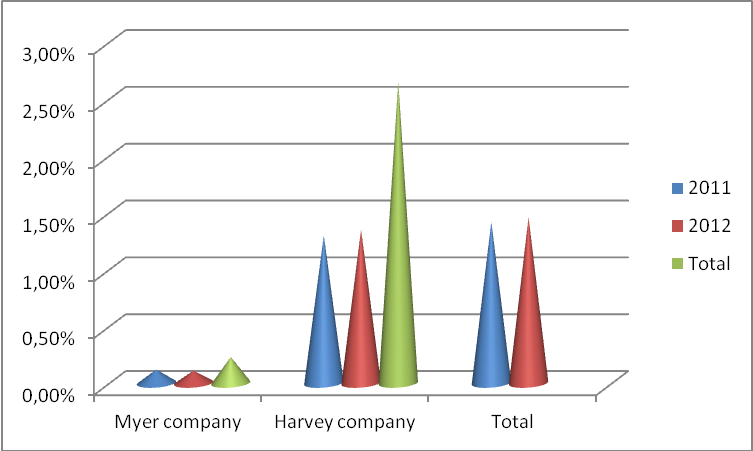
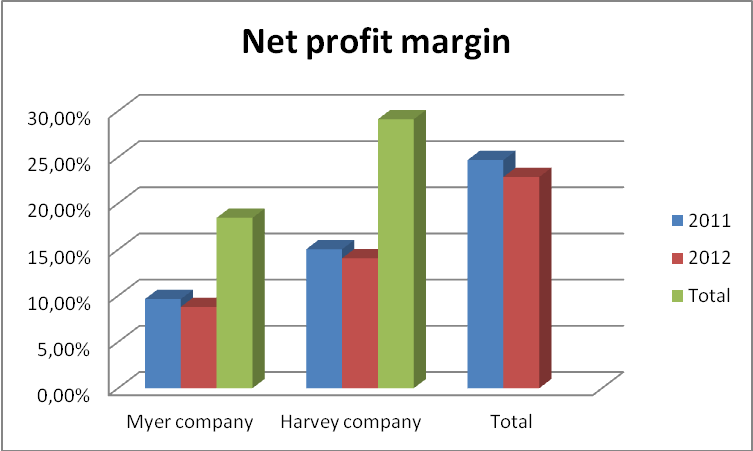
According to Robinson (2009, p, 1) net profit margin (NPM) is the actual percentage of income that is realizable after payment of expenses and tax obligation.
As indicated in the chart, the NPM of Myer and Harvey companies for the year 2012 is reported at 8.80% and 14.07% respectively. The figures show positive performance due to low expenditure. However, in 2012 both corporations recorded a drastic decline in NPM value in comparison to the year 2011. Myer’s net profit value reduced from 9.65% to 8.80% in the years 2011 and 2012 respectively. Consequently, Harvey Company reported a decrease of 0.98% between the two years. The drastic reduction in net profit was due to the increase in expenditure in 2012 in both corporations.
Despite the drop in profit margin, Harvey Company remains the best corporation in expenditure management than Myer. This is evident since its respective net income for the two years is relatively proportional to its gross margin figures that Myer holdings.
Return on equity
Return on equity is a financial ratio that measures a corporation’s ability and strength in meeting shareholders’ expectations. Its analysis is vital since it gives a clear indication of how to accompany is able to utilize its resources in ensuring high returns on investments (Loth, 2012, p, 1).
Both companies reported a drastic reduction in their return on equity as evident in the diagram. Particularly, Myer’s ROE reduced from 19.05% in 2011 to 16.04% in 2012. This shows a 3.01% reduction in comparison to harvest’s 1.03% decrease. The reduction in return on equity value is due to the low net profit margins that the companies reported in the year 2012. It is also due to poor management of expenditure and other operating costs. This has affected the companies, especially Myer corporation. Comparatively, Harvey remains the best company due to its relatively stronger ROE in comparison to Myer holdings.
Return on assets
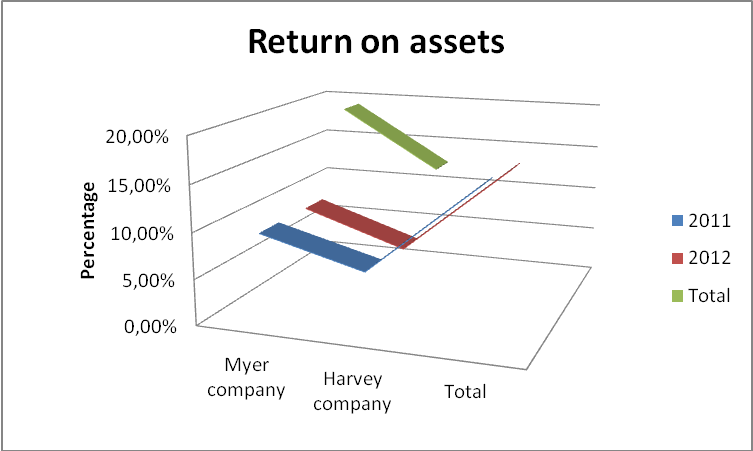
Return on assets (ROA) is a financial ratio that is used popularly by investors and financial analysts to establish the performance strength of a company (Riley, 2012, p, 1). It measures the income capacity that the available assets in the company generate. Indeed, higher ROA ratios signify better institutional management and utilization of resources.
In a review of the two companies, Myer Company reported a reduction in its ROA value in 2012. The value reduced from 9.59% to 8.55% in the year 2011 and in 2012 respectively. Harvey Company also reported a drastic drop that was from a significant 6.66% in 2011 to 5.93% in the year 2012. The drop is attributable to inferior management of the available resources especially liquid assets and expenditure. The fall is also due to a lack of proper coordination of activities and utilization of assets (Noonan, 2005, p25).
Comparatively, Harvey’s small drop depicts how well its resources are utilized in comparison to Myer Company.
Efficiency Ratios
Inventory turnover

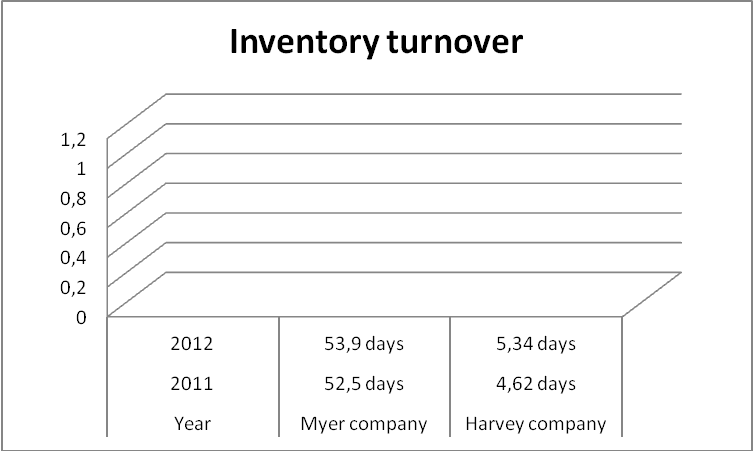
Inventory turnover is a ratio that is used in measuring the number of times a stock is sold in a particular period (Lee & Liu, 2010, p, 172).
From the graph, Myer Corporation reported an increase in its inventory turnover period with 1.40 days up from 52.5 days in 2011 to 53.9 days in 2012. Harvey Company also reported an increase from 4.62 days in 2011 to 5.34 days in 2012. This shows laxity in the sales department and application of poor marketing strategies especially in 2012 in both companies. Comparatively, Harvey Company has more effective inventory turnover strategies than Myer since its turnover days are few.
Debtor’s turnover days
Debtors’ turnover ratios measure the average debt collection in days or months (Peavle, 2012, p, 1). The lesser the days the better for institutions to eradicate write-off expenditure.
From the table, the debtor collection period has reduced in both companies because of the application of viable debt management strategies.
Although Harvey Company reported a remarkable drop of 13 days, its debt collection period remains high in comparison to Myer Company. This shows that Myer Company is very efficient in debt management.
Creditors turnover
The ratio measures how efficient a company is in paying its creditors (Fairfield, & Teri, 2001, p, 1).
From the table, it took Myer Company a period of 47.9 days to settle its creditors in 2012 compared to 50 days that it took in 2011. Harvey Company maintained its number of debt repayment periods that stood at 212 in 2011. This gives a clear indication that Myer Company services its payable obligations more promptly than Harvey.
Financial ratios
Current ratios
Current ratio is established by dividing current assets by current liability (Robinson, 2009, p, 20). Its purpose is to measure a company’s liquidity strength and short-term debt ability.
As shown, Meyer Company reported an increase of 0.7% in its current ratio figure in 2012. This shows that the company’s assets were enough to settle its debts especially in 2012 than in 2011. However, Harvey Company reported a slight drop in its current ratio figure. The drop that shows an acute imbalance between the companies asset value and debt obligation was from 1.64% in 2011 to 1.63% in 2012. This indicates that the company’s current assets could not match its debt obligation effectively.
Relatively the value of its current ratio remains remarkable compared to Myer’s figures since they were above 1%. This shows that the company has sufficient assets that hold the capacity to satisfy its debt obligation with limited complications than Myer Corporation.
Quick ratio

Quick ratio is a financial indicator that measures the amount or value of most liquid current assets (Amato, 2012, p, 6). It refines the current ratio by establishing how specific current assets can cover current liabilities.
Myer Company reported a quick ratio of 0.12 in 2011 and 0.11 in 2012. This represents a 0.01% decrease in its liquidity capacity that should remain above one percent. The company has been reporting a low quick ratio compared to Harvey Company whose figures are above 1%. This can affect its debt repayment capacity since a quick ratio of less than 1% signifies low liquidity. On the other hand, Harvey Company reported an increase of 0.05% in its liquidity standing. The increase that outshines Myers figures in both years is from 1.3% in 2011 to 1.35% in 2012.
Debt equity ratio
Debt equity ratio measures a company’s financial performance by giving a credible insight into the relationship between debt and shareholders’ equity (Kennon 2012, p, 1).
Myer Company reported a drop of 0.11% in its debt asset ratio due to effective management. The drop was from 1.29% in 2011 to 1.18% in 2012. Variably, Harvey Company had a low debt asset ratio that signifies its efficiency in debt management. The company’s debt asset ratio has been an all-time low in comparison to Myer Company. Its ratio stood at 0.743% in 2011 and 0.7957% in 2012.
Comparatively, its ratio remains below 1% is good for its progress than Myer Company.
Times interest earned
Times interest earned measures a corporation’s ability and capacity in meeting its debt obligations (Noonan, 2005, p, 23). As indicated, Myer Company had a stable ratio pertaining to interest-earning times (IET) than Harvey corporation which recorded a significant drop in 2012.
Other relevant information
It is imperative to highlight other crucial ratios that influence investment decisions that investors must take into consideration. The ratios include dividend yield ratio, price-earnings (PE) and earnings yield ratios or EPS. The ratios mostly touch on the return benefits that investors are to receive from institutions. The benefits are determined by the income levels of a company (Peavle, 2012, p, 1). That is if a company records a dismal performance, the earnings will go down while high-income results in high returns. Evidently, the two corporations registered low earnings in 2012 due to their dismal performance. They both recorded a decrease in their income value that determines the earning level per share. This calls for effective management of the companies’ expenditure levels to enable them to record high-income levels to increase EPS value.
Limitations
Indeed, both companies are deficient of effective leaders and proper financial management guidelines. This has been the cause of the companies decrease in performance especially in 2012. This poses an immense challenge for the companies’ potential for future growth and expansion. In particular, the companies lack professional financial advisors with unquestionable credentials. The companies also operate with limited resources that hinder their expansion capacity in terms of asset acquisition. They also lack qualified and proper expenditure managers who can help them to create an effective balance between income and expenditure.
Recommendations
- As evaluated, Harvey Company is the best company with a promising future that investors can consider in comparison to Myer Company. This is because it recorded positive and attractive values in its key ratios than Myer Company despite its limited scope.
- The companies should adopt effective financial management guidelines and leadership ideals to facilitate their growth.
- They should also ensure effective management of their expenditure by striking a balance between income and expenditure. This is vital in ensuring that the profit margin levels and return on equity are kept high.
- Consequently, the companies should adopt viable debt management (payable and collection) strategies. This is critical in ensuring that debt asset and equity ratios are minimal and sustainable.
References
Amato, E 2012. The Top 15 Financial Ratios. Web.
Fairfield, P & Teri, L 2001. Using Asset Turnover and Profit Margin to Forecast Changes in Profitability. Review of Accounting Studies, 6(4), pp. 371-371. Web.
Kennon, J. 2012, Debt to Equity Ratio. Web.
Kennon, K. 2012. Calculating Gross Profit Margin. Web.
Loth, R. 2012. Financial Ratio Tutorial. Web.
Lee, H & Liu, Z. 2010. Statistical Inventory Management in Two-Echelon, Multiple-Retailer Supply Chain Systems. Journal of International Management Studies, 5(1), pp. 172-177. Web.
Noonan, R. 2005. Coles Myer to Sell Megamart Unit; Myer Store Business May Be Shed. Wall Street Journal, 8(2), pp. 23-42. Web.
Peavle, R 2012, What is the Total Asset Turnover Ratio and How is it Calculated. Web.
Riley, J 2012, main financial ratios. Web.
Robinson, R. 2009. International Financial Statement analysis. John Wiley & Sons, Hoboken, N.J.
Appendices


Debtor’s turnover days
Creditors turn over