The Financial Statement of Apple Inc

Introduction: An overview of Apple Inc

Apple Inc is a multinational company that is based in the United States of America and has operations in different parts of the world. The company has its headquarter situated in California in a place called Cupertino. It was founded by Steve Jobs and two other colleagues in 1976 and has grown into a multinational company over the 36 years that it has been in operation. The company designs develop and sell products such as computer software, electronics and computers among others. Its product line has extended over the years to incorporate products such as iPod, iPhone, iPad among other hardware products.

The current company CEO is Tim Cook who took over from Steve Jobs on August 24, 2011, when he resigned and became the Chairman. The company has created many jobs in all the countries where it operates (White, 2010). It had 72800 full-time employees by September 2012 who are on a permanent basis, and about 3300 that are on a temporary basis but full-time. According to Reuters (2012), “The Company operates in five segments including America, Europe, Japan, Asia-Pacific, and retail.” (p. 1). The company distributes its products throughout the world using its retail shops, online stores, and direct sales force among other means.

The latest financial statements

The most recent financial statements of the company were prepared in 2012. Since we are analyzing the financial statements of the company for the past 5 years, we present the financial statement for the years 2008 to 2012.

Income statement: obtained from Market Watch (2012). Web.

Fiscal year is October-September. All values USD millions. 2008 2009 2010 2011 2012
Sales/Revenue 32.48B 42.6B 65.07B 108.6B 155.97B
Cost of Goods Sold (COGS) incl. D&A 21.33B 25.75B 39.5B 64.08B 87.78B
COGS excluding D&A 20.86B 25.02B 38.47B 62.26B 84.5B
Depreciation & Amortization Expense 473M 734M 1.03B 1.81B 3.28B
Depreciation 363M 606M 815M 1.6B 2.6B
Amortization of Intangibles 110M 128M 212M 214M 677M
Gross Income 11.15B 16.85B 25.57B 44.52B 68.2B
SG&A Expense 4.87B 5.48B 7.3B 10.03B 13.42B
Research & Development 1.11B 1.33B 1.78B 2.43B 3.38B
Other SG&A 3.76B 4.15B 5.52B 7.6B 10.04B
Other Operating Expense 0 0 0 0 0
Unusual Expense 0 (333M) (295M) 1.57B (467M)
EBIT after Unusual Expense 0 333M 295M (1.57B) 467M
Non Operating Income/Expense (33M) (44M) (336M) 758M (566M)
Non-Operating Interest Income 653M 407M 311M 519M 1.09B
Equity in Affiliates (Pretax) 0 0 0 0 0
Interest Expense 0 0 0 0 0
Gross Interest Expense 0 0 0 0 0
Interest Capitalized 0 0 0 0 0
Pretax Income 6.9B 12.07B 18.54B 34.21B 55.76B
Income Tax 2.06B 3.83B 4.53B 8.28B 14.03B
Income Tax – Current Domestic 2.15B 2.45B 2.81B 4.65B 8.42B
Income Tax – Current Foreign 277M 345M 282M 769M 1.2B
Income Tax – Deferred Domestic (237M) 1.08B 1.56B 3.04B 4.9B
Income Tax – Deferred Foreign (131M) (35M) (121M) (167M) (490M)
Income Tax Credits 0 0 0 0 0
Equity in Affiliates 0 0 0 0 0
Other After Tax Income (Expense) 0 0 0 0 0
Consolidated Net Income 4.83B 8.24B 14.01B 25.92B 41.73B
Minority Interest Expense 0 0 0 0 0
Net Income 4.83B 8.24B 14.01B 25.92B 41.73B
Extraordinaries & Discontinued Operations 0 0 0 0 0
0 0 0 0 0
Extra Items & Gain/Loss Sale Of Assets 0 0 0 0 0
Cumulative Effect – Accounting Chg 0 0 0 0 0
Discontinued Operations 4.83B 8.24B 14.01B 25.92B 41.73B
Net Income After Extraordinaries 0 0 0 0 0
Preferred Dividends 4.83B 8.24B 14.01B 25.92B 41.73B
Net Income Available to Common 5.48 9.22 15.41 28.05 44.64
EPS (Basic) 881.59M 893.02M 909.46M 924.26M 934.82M
Basic Shares Outstanding 5.36 9.08 15.15 27.68 44.15
EPS (Diluted) 902.14M 907.01M 924.71M 936.65M 945.36M
Diluted Shares Outstanding 6.75B 12.1B 19.3B 36.31B 58.05B
EBITDA 6.75B 12.1B 19.3B 36.31B 58.05B

Balance Sheet: obtained from Market Watch (2012). Web.

Assets
Fiscal year is October-September. All values USD millions. 2008 2009 2010 2011 2012
Cash & Short Term Investments 24.49B 23.46B 25.62B 25.95B 29.13B
Cash Only 368M 1.14B 1.69B 2.9B 3.11B
Short-Term Investments 24.12B 22.33B 23.93B 23.05B 26.02B
Total Accounts Receivable 4.7B 5.06B 9.92B 11.72B 18.69B
Accounts Receivables, Net 2.42B 3.36B 5.51B 5.37B 10.93B
Accounts Receivables, Gross 2.47B 3.41B 5.57B 5.42B 11.03B
Bad Debt/Doubtful Accounts (47M) (52M) (55M) (53M) (98M)
Other Receivables 2.28B 1.7B 4.41B 6.35B 7.76B
Inventories 509M 455M 1.05B 776M 1.99B
Finished Goods 509M 455M 1.05B 776M 791M
Work in Progress 0 0 0 0 0
Raw Materials 0 0 0 0 0
Progress Payments & Other 0 0 0 0 1.2B
Other Current Assets 4.99B 2.58B 5.08B 6.54B 7.84B
Miscellaneous Current Assets 2.58B 2.27B 4.93B 5.82B 7.84B
Total Current Assets 34.69B 31.56B 41.68B 44.99B 57.65B
Net Property, Plant & Equipment 2.46B 2.95B 4.77B 7.78B 15.45B
Property, Plant & Equipment – Gross 3.75B 4.67B 7.23B 11.77B 21.89B
Buildings 810M 955M 1.47B 2.06B 2.44B
Land & Improvements
Computer Software and Equipment 15.74B
Other Property, Plant & Equipment 1.45B 1.78B 2.17B 2.78B 3.71B
Accumulated Depreciation 1.29B 1.71B 2.47B 3.99B 6.44B
Total Investments and Advances 0 10.53B 25.39B 55.62B 92.12B
Other Long-Term Investments 0 0 25.39B 55.62B 92.12B
Long-Term Note Receivable 0 0 0 0 0
Intangible Assets 559M 559M 1.08B 4.43B 5.36B
Net Goodwill 207M 206M 741M 896M 1.14B
Net Other Intangibles 352M 353M 342M 3.54B 4.22B
Other Assets 1.73B 1.74B 2.26B 3.56B 5.48B
Tangible Other Assets 433M 898M 1.46B 1.96B 2.48B
Total Assets 39.57B 47.5B 75.18B 116.37B 176.06B
Liabilities & Shareholders’ Equity
2008 2009 2010 2011 2012
ST Debt & Current Portion LT Debt 0 0 0 0 0
Short Term Debt 0 0 0 0 0
Current Portion of Long Term Debt 0 0 0 0 0
Accounts Payable 5.52B 5.6B 12.02B 14.63B 21.18B
Income Tax Payable 100M 430M 210M 1.14B 1.54B
Other Current Liabilities 8.47B 5.48B 8.5B 12.2B 15.83B
Dividends Payable 0 0 0 0
Accrued Payroll 320M 357M 436M 590M 735M
Miscellaneous Current Liabilities 8.15B 5.12B 8.06B 11.61B 15.1B
Total Current Liabilities 14.09B 11.51B 20.72B 27.97B 38.54B
Long-Term Debt 0 0 0 0 0
Long-Term Debt excl. Capitalized Leases 0 0 0 0 0
Non-Convertible Debt 0 0 0 0 0
Convertible Debt 0 0 0 0 0
Capitalized Lease Obligations 0 0 0 0
Provision for Risks & Charges 0 0 0
Deferred Taxes 537M 2.05B 4.3B 8.16B 13.85B
Deferred Taxes – Credit 675M 2.22B 4.3B 8.16B 13.85B
Deferred Taxes – Debit 138M 163M 0 0
Other Liabilities 3.78B 2.14B 2.37B 3.63B 5.47B
Other Liabilities (excl. Deferred Income) 746M 1.29B 1.23B 1.94B 2.82B
Deferred Income 3.03B 853M 1.14B 1.69B 2.65B
Total Liabilities 18.54B 15.86B 27.39B 39.76B 57.85B
Non-Equity Reserves 0 0 0 0 0
Preferred Stock (Carrying Value) 0 0 0 0 0
Redeemable Preferred Stock 0 0 0 0 0
Non-Redeemable Preferred Stock 0 0 0 0 0
Common Equity (Total) 21.03B 31.64B 47.79B 76.62B 118.21B
Common Stock Par/Carry Value 7.18B 8.21B 10.67B 13.33B 16.42B
Retained Earnings 13.85B 23.35B 37.17B 62.84B 101.29B
ESOP Debt Guarantee 0 0 0 0 0
Cumulative Translation Adjustment/Unrealized For. Exch. Gain 59M 28M (217M) 313M (232M)
Unrealized Gain/Loss Marketable Securities (51M) 49M 171M 130M 731M
Revaluation Reserves 0 0 0 0 0
Treasury Stock 0 0 0 0 0
Total Shareholders’ Equity 21.03B 31.64B 47.79B 76.62B 118.21B
Accumulated Minority Interest 0 0 0 0 0
Total Equity 21.03B 31.64B 47.79B 76.62B 118.21B
Liabilities & Shareholders’ Equity 39.57B 47.5B 75.18B 116.37B 176.06B

Cash flow statements. Obtained from Market Watch (2012). Web.

Operating Activities
Fiscal year is October-September. All values USD millions. 2008 2009 2010 2011 2012 5-year trend
Net Income before Extraordinaries 4.83B 8.24B 14.01B 25.92B 41.73B
Depreciation, Depletion & Amortization 473M 734M 1.03B 1.81B 3.28B
Depreciation and Depletion 363M 606M 815M 1.6B 2.6B
Amortization of Intangible Assets 110M 128M 212M 214M 677M
Deferred Taxes & Investment Tax Credit (368M) 1.04B 1.44B 2.87B 4.41B
Deferred Taxes (368M) 1.04B 1.44B 2.87B 4.41B
Investment Tax Credit 0 0 0 0
Other Funds 538M 736M 903M 1.17B 1.74B
Funds from Operations 5.48B 10.75B 17.38B 31.77B 51.16B
Extraordinaries 0 0 0 0 0
Changes in Working Capital 4.12B (586M) 1.21B 5.76B (299M)
Receivables (785M) (939M) (4.86B) (1.79B) (6.97B)
Accounts Payable 596M 92M 6.31B 2.52B 4.47B
Other Assets/Liabilities 4.47B 207M 361M 4.76B 2.21B
Net Operating Cash Flow 9.6B 10.16B 18.6B 37.53B 50.86B
Investing Activities
2008 2009 2010 2011 2012 5-year trend
Capital Expenditures (1.2B) (1.21B) (2.12B) (7.45B) (9.4B)
Capital Expenditures (Fixed Assets) (1.09B) (1.14B) (2.01B) (4.26B) (8.3B)
Capital Expenditures (Other Assets) (108M) (69M) (116M) (3.19B) (1.11B)
Net Assets from Acquisitions (220M) 0 (638M) (244M) (350M)
Sale of Fixed Assets & Businesses 0 0 0 0
Purchase/Sale of Investments (6.76B) (16.15B) (11.09B) (32.46B) (38.43B)
Purchase of Investments (23B) (46.83B) (57.81B) (102.32B) (151.23B)
Sale/Maturity of Investments 16.24B 30.68B 46.72B 69.85B 112.81B
Other Uses (10M) (74M) (2M) (259M) (48M)
Other Sources 0 0 0 0
Net Investing Cash Flow (8.19B) (17.43B) (13.85B) (40.42B) (48.23B)
Financing Activities
2008 2009 2010 2011 2012 5-year trend
Cash Dividends Paid – Total 0 0 0 0 (2.49B)
Common Dividends 0 0 0 0 (2.49B)
Preferred Dividends 0 0 0 0 0
Change in Capital Stock 359M 393M 912M 831M 665M
Repurchase of Common & Preferred Stk. (124M) (82M) 0 0 0
Sale of Common & Preferred Stock 483M 475M 912M 831M 665M
Proceeds from Stock Options 0 0 0 831M 665M
Other Proceeds from Sale of Stock 483M 475M 912M 0 0
Issuance/Reduction of Debt, Net 0 0 0 0 0
Change in Current Debt 0 0 0 0 0
Change in Long-Term Debt 0 0 0 0 0
Issuance of Long-Term Debt 0 0 0 0 0
Reduction in Long-Term Debt 0 0 0 0 0
Other Funds 757M 270M 345M 613M 125M
Other Uses 0 0 (406M) (520M) (1.23B)
Other Sources 757M 270M 751M 1.13B 1.35B
Net Financing Cash Flow 1.12B 663M 1.26B 1.44B (1.7B)
Exchange Rate Effect 0
Miscellaneous Funds 0 0 0 0 0
Net Change in Cash 2.52B (6.61B) 6B (1.45B) 931M
Free Cash Flow 8.51B 9.02B 16.59B 33.27B 40.07B

Description of the financial statements

Income statement

The company’s revenue from sales for 2012 was 155.97B. The cost of goods sold was 87.78B. The gross income, therefore, was 68.2B. The pretax income was 55.76B. The income tax amounted to 14.03B. This led to a consolidated net income of 41.73B and because there was no Minority Interest Expense, the net income was represented by the same figure.

Balance Sheet

The company’s total assets for the year 2012 amounted to 176.06B. 5.36B of this figure represented the total amount of intangible assets, 57.65B represented total current assets and the rest were the non-current assets. The value for the total liabilities of 57.85B included 38.54B of current liabilities, 13.85B deferred taxes, and 5.47B were other liabilities.

Cash Flow Statements

The cash flow included cash flow from Operating Activities, investing and financing activities (Faas, 2011). In 2012, the net cash flow from operating activities amounted to 50.86B. The investing and financing activities had negative cash flows of (48.23B) and (1.7B) respectively. The net change in cash that remained was 931M.

Ratio Analysis

The Ratios for APPLE and Google Are Represented In the Tables Below

Apple Ratios

The Ratios for APPLE and Google

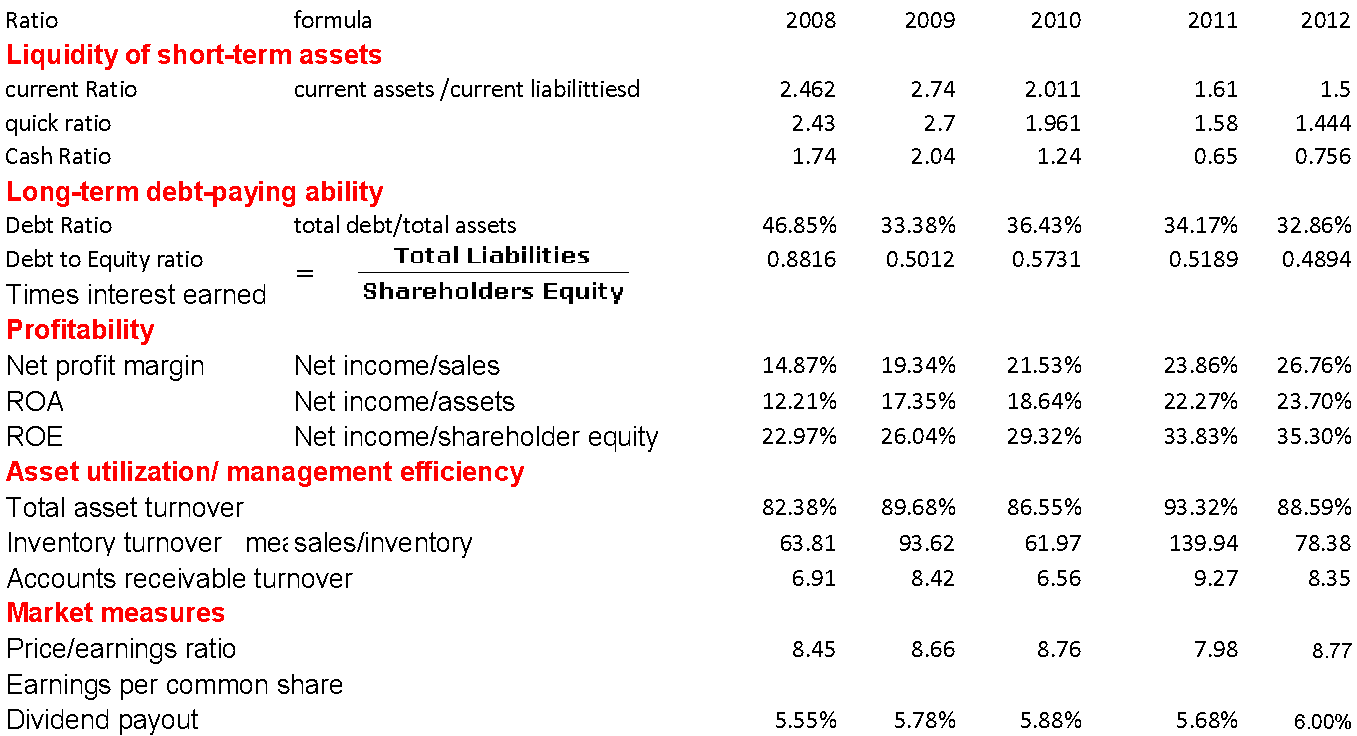
The liquidity ratios show that Google has strong liquidity than Apple. For instance, Google has a current ratio of 8.27 while that of Apple is 2.462 in 2008 and 1.5 in 2012. Other liquid ratios like quick ratio and cash ratio have the same information the two companies. Return on equity for Google is 15% while that of Apple is 22.97 in 2008. It increased between 2008 and 2012. This means that Apple is better to invest in than Google because it has a higher return on equity (Fox News, 2012). The Debt ratio of the company also reveals the amounts of assets that are financed by borrowed funds are at a reasonable level (Gallagher, 2007).

The Debt Equity ratio is below 50 % which is healthy for a company. The time interest ratio was not computed because there was no interest expense for Apple. According to Gibson (2012), the ratio is supposed to indicate the number of times a company can pay interest from its earnings before paying taxes. The company’s net profit margin for the period from 2008 to 2010 was less than that of its competitors. A company with high profitability ratios will be worthy to invest in because it will have a higher return on equity (Morrell, 2007). The dividend payout ratio for Apple increased slightly between 2008 and 2012. This means that more profits were paid out as dividends (Megginson, W. L and Smart, 2008).

Key Statistics

There are other statistics for the companies that can help an investor determine the best company to invest in. for instance, the current market value for APLE is 475 billion according to Forbes.com (2012). The company has a beta of 0.93. According to Forbes.com (2012), the company has a market value of 186 billion and a beta of 1.23.

Recommendations

Firstly, based on key statistics, Apple is found to be better than Google invest. The beta for Apple is less than that of Google, meaning that Apple is less risky to invest in compared to Google (Taylor, 2010). According to Gustin (2012), a higher beta means a higher risk. Apple also has a higher market value than Google. A rational investor will consider investing in Apple instead of Google because he will be faced with minimal risks (Burrows, 2010).

References

Burrows, P. (2010). Apple vs. Google. Web.

Faas, R. (2011). How the Apple iCloud compares to Google’s cloud. Web.

Forbes. (2012). Apple Inc (NASDAQ: AAPL). Web.

Fox News. (2012). Apple vs. Google: Who Will Own the Tech World? Web.

Gallagher, A. (2007). Financial Management; Principles and Practice. Uk: Freeload Press, Inc.

Gibson, C. (2012). Financial Reporting & Analysis: Using Financial Accounting Information. London: Cengage Learning.

Gustin, S. (2012). Apple vs. Google Is the Most Important Battle in Tech. US: Time Inc.

Market Watch. (2012). Annual Financials for Apple Inc.: Balance Sheet. Web.

Market Watch. (2012). Annual Financials for Apple Inc.: Cash flow Statement. Web.

Market Watch. (2012). Annual Financials for Apple Inc.: Income Statement. Web.

Megginson, W. L and Smart, S. B. (2008). Introduction to Corporate Finance. Cambridge: Cengage Learning.

Morrell, P. S. (2007). Airline Finance. US: Ashgate Publishing, Ltd.

Reuters. (2012). Profile: Apple Inc (AAPL.O). Web.

Taylor, D. (2010) The Ask Dave Taylor Apple iPad Answer Guide. London: BookBrewer.

White, M. (2010). Apple, Google, Microsoft Intranet Focus Ltd Winners and losers. London: Intranet Focus Ltd.

Appendix: Google Ratios

2008 2009 2010 2011
current ratio 20178.2/2,302.1=8.76 29167/2,747.0= 10.617 41562/9,996=4.157 52758/8,913=5.92
quick ratio 20178-()/2302= 29167-()/2747 41562-()/9996= 52758-()/8913=
Cash ratio 8656.7/2302.1=3.76 10198/2747=3.71 12019/9996=1.20 8683/8913=0.97
return on equity 4,227/28238.9= 0.15 6,520/36004=0.18 8,505/46241=0.183 9,737/58145=0.167
Gross profit margin 13174/21,796=0.604 14807/23,651=0.626 18904/29,321=0.645 24717/37,905=0.652
return on shareholders 4227/28238.9=0.513 6520/36004=0.181 8505/46421=0.183 9737/58145=0.167
gross profit percentage 13174*100/21796=60.4% 14807*100/23,651=62.2% 18,904*100/29,321=64.47% 24717*100/37,905=65.20%
operating cost percentage 6,542*100/21796=30.01% 6495*100/2365127.46% 8523*100/29321=29.06% 12475*100/37905=32.92%
effective tax rate 1626/5,853=0.277 1,861.0/8381=0.222 2291/10,796=0.212 2589/12,326=0.210
net profit margin 4227*100/21,796=19.39% 6520*100/23,651=27.56% 8505*100/29,321=29% 9737*100/37,905=25.68%
return on investment 4227/ 6,520.00 8,505.00 9,737.00
return on capital employed
return on equity 4227/28238.9=0.149 6520/36004=0.181 8505/46241=0.184 9737/58145=0.167
stockholding period 365*
fixed assets turnover 21796/11588.8=1.88 23651/11330=2.07 29321/16289=1.37 37905/19816=1.91
Total asset turn over 21796/31,767.6=0.068 23651/40,497=0.584 29321/57,851=0.506 37905/72,574=0.522
Dividend payout
return on shareholders fund 4227/28238.9=0.149 6520/36004=0.181 8505/46241=0.184 9737/58145=0.167
earning per share

Cite this paper

Select style

Reference

BusinessEssay. (2022, December 25). The Financial Statement of Apple Inc. https://business-essay.com/the-financial-statement-of-apple-inc/

Work Cited

"The Financial Statement of Apple Inc." BusinessEssay, 25 Dec. 2022, business-essay.com/the-financial-statement-of-apple-inc/.

References

BusinessEssay. (2022) 'The Financial Statement of Apple Inc'. 25 December.

References

BusinessEssay. 2022. "The Financial Statement of Apple Inc." December 25, 2022. https://business-essay.com/the-financial-statement-of-apple-inc/.

1. BusinessEssay. "The Financial Statement of Apple Inc." December 25, 2022. https://business-essay.com/the-financial-statement-of-apple-inc/.


Bibliography


BusinessEssay. "The Financial Statement of Apple Inc." December 25, 2022. https://business-essay.com/the-financial-statement-of-apple-inc/.