Introduction
The table below summarizes the profitability ratios of the company for three years.
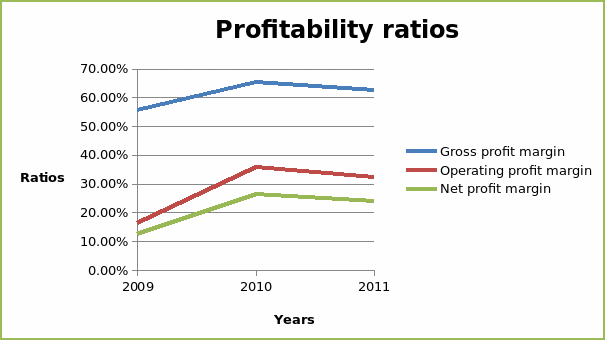
From the table above, the gross profit margin increases from 55.69% in 2009 to 65.31% in 2010. Thereafter, it declined to 62.51%. The gross profit margin shows the ability of an organization to margin costs of sales so as to generate profit. The gross profit margin ratios also give information on the pricing policy of the organization. Decline in the ratio could indicate increased cost of input or poor pricing. The operating profit margin increased from 16.26% in 2009 to 32.37% in 2011. It shows that the company is able to margin the cost of operation so as to generate profits. The net profit margin shows the ability of the organization to manage the total costs of operating the business. The profitability ratios of the company are relatively high. They all showed the same trend (an increase from 2009 to 2010 followed by a decline in 2011) as depicted in the graph below.

Growth of sales and operating expense
The table below summarizes the values of sales and operating expense for the three year period.
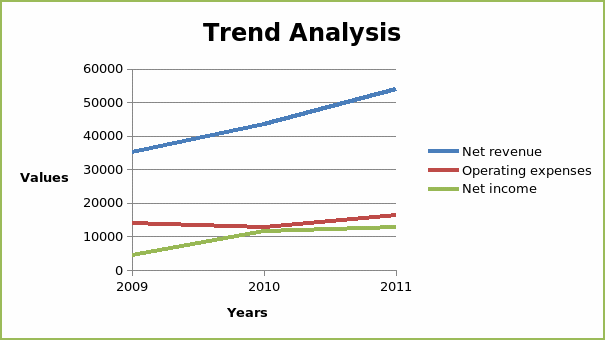
From the calculations above, sales grew by 24.19% in 2010 and 23.79% in 2011. Operating expenses decline by 6.84% in 2010 and increased by 26.17% in 2011. Finally, net income grew by 162.39% in 2010 and 12.89% in 2011. The graph below shows the trend of growth of the values.

Changes in stakeholder equity
From the statement of stakeholder equity, common stock increased $16,178 to 17,036. The change was as a result of the sale of shares through employee equity incentive amounting to $2,019, assumption of equity award amounting to $48, share based compensation amounting to $1,053 and repurchase of common stock amounting to $2,262. The accumulated other comprehensive income (losses) declined from $333 to $781. This declined was caused by a comprehensive loss earned in 2011 amounting to $1,114. Further, retained earnings declined from $32,919 to $29,656. The changes were caused by a net income amounting to $12,942 that was earned in 2011, repurchase of common stock amounting to $12,078 and payment of cash dividends amounting to $4,127. These changes lead to a decline in the value of the shareholders’ equity from $49,430 to 45,911.
Cash flow statement
The table below summarizes the cash flow of Intel Corporation for the three years.
Operating activities of the company generated positive cash flow during the three years. However, cash flow was used in financing and investing activities. This yielded a negative cash flow changes in 2009 and positive net cash flow in 2010 and 2011.
Yarrick Company
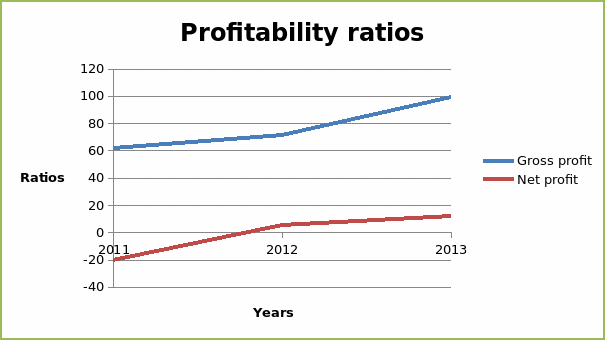
Net sales of the company increased by 15.67% in 2012 and by 52.90% in 2013. Similarly, the net profit increased by 125% in 2012 and further by 140% in 2013. The gross profit margin declined from 46.27% to 45.81% and further to 41.77%. However, the net profit margin increase from (14.93%) to 3.23% and further to 5.06% in 2013. Decline in gross profit of the organization shows declined the ability to efficiently manage costs of production and pricing. The graph below shows the trend of profitability of the organization.

Effect of changes of various financial items on cash flow
Company A and B
The table below summarizes computation of dividend paid for the two companies.
Statement of cash flow
From the cash flow statement above, the net cash flow from operations from company B is greater than cash flow from A. Cash flow from from investing and financing activities for company A is greater than B. The net cash changes for company B is greater than than company A.
