Introduction
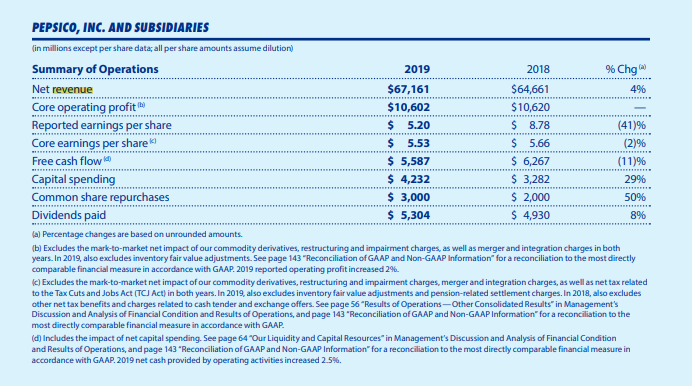
PepsiCo, Inc. is an American multinational beverage and snack corporation that was formed in 1965. The company’s operational and strategic management during the period of its existent were successful enough to make it recognizable all over the world. PepsiCo has its own vivid and memorable image, which is translated through marketing campaigns proving that the quality of the product is more important than its status. PepsiCo is one of the main competitors of The Coca Cola Company, and these two gigantic corporations are the main suppliers of non-alcoholic beverages in the world. Consumers enjoy the products of PepsiCo in more than 200 countries worldwide (PepsiCo, 2021). The company possesses more than 23 different brands and is known for such products as Pepsi-Cola, Frito-Lay, and Gatorade. The company specializes in drinks and snacks, unlike The Coca Cola Company, which produces drinks only (PepsiCo, 2021). The firm’s net revenue reached a whopping $70 billion in 2020 (PepsiCo, 2021). Financial analysis of the company will be further conducted to determine its current financial position and will be based, in particular, on the information from Figure 1 – 2018/2019 PepsiCo Financial Statement from Appendix.
PepsiCo Financial Analysis
To determine any company’s financial position, one should examine its financial statements (such as income statement, balance sheet, and cash flow statement) and calculate specific ratios. The latter include liquidity, solvency, profitability, and growth ratio analysis (Aryasri, 2020). These types of analysis are aimed at indicating the weaknesses and strengths of a company in relation to its financial policy and effectivity and revealing of the ways of improving its general activity. The main purpose of the changes based on the results of these types of analysis is ensuring the probability of the company’s future development and success. PepsiCo’s balance sheet for the past two years can be used to assess, analyze and interpret its liabilities, assets, and equity.
To begin with, the total assets and liabilities increased last year in comparison with the 2019 fiscal year. On average, such changes are difficult to characterize and interpret positively or negatively, they only emphasize an increase in the company’s activity intensification. The difference between total assets and liabilities is positive, meaning that the former currently exceeds the latter. This is generally a beneficial sign since the company is not in debt at the scale that would not allow to continue to operate.
This fact already indicates the good financial standing and performance of the company. Total equity slightly dropped from 14,868,000 to 13,552,000 last year (Yahoo Finance, 2021). It can be explained by redirecting equity into business operations due to the outburst of Covid-19, the unusual and crisis event. PepsiCo is a large-cap company that experienced a significant increase in total debt caused by the pandemic, a reason that has brought negative changes to the dynamic of numerous companies around the world, last year. The current debt ratio, which tells about the firm’s leverage, is 0.48 or 48%. Since it is less than 1, the ratio translates to the fact that PepsiCo is mostly funded by equity. This fact adheres to the company’s policy regarding the financial aspect of the business activity. In other words, PepsiCo has the capacity to be funded by the independent means, which prevents it from huge debts and lack of financial stability. What is more, this result is close to the beverage industry average. Thus, although total debt is rising, investors still face low risk.
The ability of a firm to convert its assets to cash is called liquidity. The liquidity analysis is of utmost importance for somebody who wants to assess the company’s ability to repay its current debt obligations (Aryasri, 2020). Standard liquidity metrics are the current ratio, operating cash flow ratio, and quick ratio (Hayes, 2021). The main difference between the current and quick ratios is that the latter ignores inventories as the company’s current assets to meet its short-term obligation. To calculate the current ratio, one should divide current assets by current liabilities (Hayes, 2021). As of December 2019, PepsiCo’s current ratio was 0.9 and slightly improved in 2020 (Yahoo Finance, 2021). If the firm’s current ratio is less than 1, it usually does not have enough money to remain solvent in the short term. The increase in quick ratio spotted last year is a good sign; however, 0.83 means that the company cannot deal with its short-term liability instantly. Average industry liquidity ratios are higher than those of PepsiCo (“Beverages,” 2021). It means that the company has a minor issue with liquidity that could be caused by uncertain cash flows and cash management policies.
The most common solvency ratios are debt ratio, debt-to-equity ratio, and equity ratio. One can calculate debt-to-equity (D/E) ratio by dividing total liabilities by shareholder equity of a company (Fernando, 2021). The D/E ratio of PepsiCo deteriorated significantly from 2019 to 2020. In other words, the multinational enterprise is not aggressive in financing its growth with debt. Net profit, operating profit, and gross profit margins all deteriorated from 2019 to 2020. The main reason for this is the coronavirus-related crisis and the pandemic conditions that placed limitations on the performance of business all over the world and on people’s economic and general activity. According to PepsiCo’s income statement, total revenue and operating expenses increased during the two years. This fact characterizes the normal busied performance during stressful, turbulent, and uncertain conditions. The shrunk net profit margin may signify that operating costs are growing at a higher rate than revenue. The reason for such change can be found in the alterations of the prices triggered by the logistics collapse caused by the COVID-19 pandemic.
Nevertheless, return-on-equity (ROE), which measures profitability, slightly increased from 2019 to 2020. PepsiCo’s ROE is considerably higher than the industry average (50% against 30%). It is suitable for investors who may conclude that company’s management knows how to use its assets to generate profits. On the contrary, return-on-assets (ROA) dropped from 16% to 8% in two years and is now close to the industry average (Yahoo Finance, 2021). It indicates that the company started to invest more or convert less income from the invested money. Fluctuations of the gross profit margin ratio that also deteriorated from 2019 to 2020 can be explained by the change in management practices. Looking at the profitability ratios, one can see that the company’s profitability has declined over two years mainly because of high competition and supply chain issues caused by the pandemic. Representatives of food and beverage industries had to adjust their operations to online trading and specific delivery. Therefore, the mentioned decline cannot be referred to as an objective tendency in the company’s performance, it is more likely to be the side effect of the adaptation to new conditions of living and marketing.
In terms of growth, PepsiCo’s revenue growth rate increased by 10.5% YoY in 2020. Annual revenue for 2020 grew by 4.8% compared to 2019 (Yahoo Finance, 2021). EBITDA margin, which measures operating performance, remain almost the same in 2020. It means that there was no significant improvement to the company’s efficiency, and PepsiCo showed the performance that did not differ from the level of the previous year much. In addition, such value of the EBITDA margin characterizes the company as resistant to unexpected changes as it showed no significant decreases in 2020, implying that even the global economic crisis could not doubt the success of PepsiCo. Investors should consider its stock as a buy because PepsiCo seems to improve its growth rate in the near future.
Conclusion
To conclude, the financial position of the PepsiCo for the past two years has been measured with the use of a range of ratios. Despite the worldwide crisis which occurred in 2020 and affected an inconceivable number of companies, the beverage giant managed to increase its revenue and kept its operating performance on a high level of efficiency. Solvency ratios indicated that the company does not rely on debt to fund its further growth. Therefore, PepsiCo is self-sufficient and its performance cab be referred to as a successful one, because the company can ensure its further development without the participance of third parties.
Although total debt and operating costs continue to grow, the risk that the company poses for the investors is low. Thus, the company ensures its strategic development and increases the probability of its success via creating a reliable and attractive image for both investors and customers. PepsiCo’s ROE increased and is higher than the industry average, while ROA slightly decreased. The only issue spotted is the liquidity deterioration compared to previous periods. In general, the financial position of PepsiCo is excellent, taking into consideration recent global challenges. Almost every negative change in the company’s performance indicators can be explained by the influence of the pandemic on the world’s networking system, logistics, price control, and other economic phenomena.
References
Aryasri, A. R. (2020). Business economics and financial analysis. McGraw-Hill Education.
Beverages: Average industry financial ratios for U.S. listed companies. (2021). Ready Ratios. Web.
Fernando, J. (2021). Debt-to-equity ratio (D/E). Investopedia. Web.
PepsiCo. (2021). About the company. Web.
Yahoo Finance. (2021). PepsiCo, Inc. (PEP). Web.
Appendix