Executive Summary
Starbucks offers a great opportunity to shareholders to increase the value of their investment. The firm has high returns on equity and assets, which is a good indication for investors. The firm experienced a disruption of its healthy trend in 2013 after it was ordered to settle a dispute by paying $2.7 billion. The firm settled the entire cost in 2014 and charged it on its 2013 expenses. The litigation charge made the firm incur operating losses in 2013. The firm wanted to take control of packaged coffee distribution by terminating an agreement it had with Kraft Food, as part of its forward integration strategy. It is expected that the firm will regain its upward trend, considering the high growth in sales and profitability in 2015. Starbucks has been compared with Keurig Green Mountain because they both sell specialty coffee as their core business. Starbucks has kept an adequate level of quick assets in the five years. It has maintained low levels of debt compared with the competitor. Starbucks has more efficiently managed inventories and accounts receivable. Holding Starbucks stock will prove profitable to an investor, considering the high growth in sales and profits in the five years and in 2015.
Company description
Starbucks specializes in processing, marketing, and retailing coffee in the global market. The firm also processes and sells other beverages and a variety of fresh food products. The firm uses several brand names to reach the customers, such as Teavana, Tazo, and Seattle’s Best Coffee. Starbucks came into existence in 1985. Its ticker symbol is “SBUX” in the NASDAQ stock market. Starbucks targets to strengthen the firm’s brands as an expansion strategy. The firm intends to expand by opening more retail outlets in the global market. The firm uses company-operated stores as well as licensed stores to generate revenue. Company-operated stores generated 79% of total sales in 2014 (Starbucks Fiscal 2014 Annual Report 3). The firm’s operations are divided into four segments, which include the Americas, Europe, Middle East & Africa, China/ Asia Pacific, and other segments. The Americas contributes about 73% of revenues and Europe, the Middle East and Africa generate about 8% (Starbucks Fiscal 2014 Annual Report 2). The Americas is the most important segment to its profitability. The firm targets emerging markets for expansion.
Strength
The firm has a wide range of differentiated products, which may allow it to charge premium prices and generate high-profit margins. In 2015, Burritt (par. 4) attributes the high growth in sales to its differentiated products. Strom (par. 2) reports that the firm’s profits rose by 15.9% in the second quarter of the current fiscal year. The firm has positioned its products in the mature markets of the Americas. Mature markets will ensure that the firm generates a stable stream of income in the future, as it tries to penetrate emerging markets. The firm operates using different brands and its success is partly due to the reputation of its brands. The firm generates most of its revenue from its company-operated stores. It enables the firm to manage customer service and customer information that may enable it to better differentiate and target customers with new products.
Risk factors
The firm relies on its brand, as a premium brand. A single bad incidence may destroy the firm’s reputation (Starbucks Fiscal 2014 Annual Report 10). Bad incidences may include food contamination and misplacement of labels among others. The firm uses cards and online payment platforms that create the risk for theft or destruction of customers’ personal information. It may lead to a bad reputation or lawsuits. There is intense competition in the specialty coffee business that creates the risk of losing market share. The price of coffee beans may rise, pressurizing the firm to increase the price of its products. Litigation has proved to be a bigger risk for the firm in the past few years. In November 2013, Starbucks was ordered to pay Kraft Foods $2.79 to settle a dispute (Burritt par. 2). The firm completed the payment in 2014 and the charge was regarded as an expense in its 2013 fiscal year. The litigation charge made the firm incur operating losses in 2013. However, the stock price did not decline after the announcement (Burritt par. 8). The litigation was a result of contract enforcement. Starbucks wanted to terminate Kraft Foods’ distribution agreement in order to take control of the high growth in the sale of packaged coffee. The sale of packaged coffee and tea grew by about 50% in 2012 (Burritt par. 4). The litigation charge may have made Starbucks appear riskier, but the outcome of the dispute may result in higher profit growth in the next few years.
Recent news
There is stable production of coffee from major coffee producers in the world, which shows that there will be stable prices in 2016. I & M Smith (par. 5) reports that there are stable production levels in Brazil and Vietnam. They contribute about 57% of total coffee production in the world (I & M Smith par. 2). The firm entered into an agreement with Tingyi Holding Corporation in China to expand the manufacture of ready-to-drink beverages in China (Restaurant News Resource par. 20). It will assist in increasing sales in mainland China. The firm opened 210 new stores in the second quarter of 2015 (Restaurant News Resource par. 2). An increased number of stores will help the firm to strengthen its presence in emerging markets, enabling higher growth in sales. The firm acquired licensed outlets in Japan, targeting to strengthen its control in the Asian segment. The new CEO, Kevin Johnson, may strengthen the firm’s strategic direction. There was a 1.3 million increase in Starbucks active members to 10.3 million in 2015 (Restaurant News Resource par. 2). Uploads of cash into Starbucks debit cards amounted to $1.1 billion in the second quarter of 2015. It provides confidence for stable income streams in 2015. The firm’s net sales increased by 18% and operating profit rose by 21% in the second quarter of 2015 (Restaurant News Resource par. 2). Recent news shows that there will be higher growth for the firm in the next few years.
Starbucks’ ratio analysis
Starbucks’ ratio figures are compared with Green Mountain Coffee in the ratio analysis. Dechow et al. (45) explain that financial ratios are used to determine the creditworthiness of firms, which makes them an important tool for analyzing the financial health of firms. Ratio analysis may also be used to predict insolvency.
Profitability Tests (Starbucks)
Profit Margin
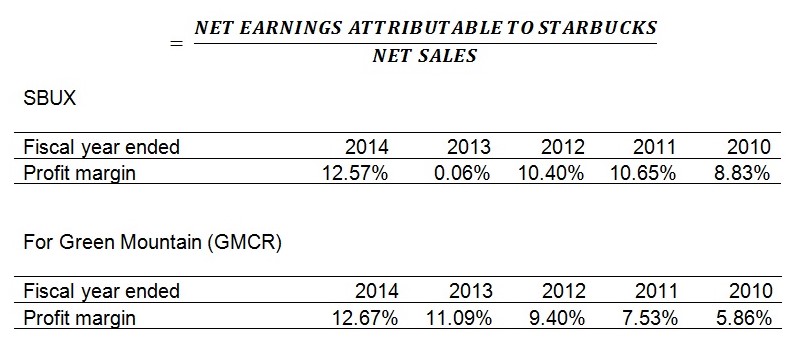
Profit margin indicates the percentage of revenues that is available to the firm for its use, after all, costs, expenses, and taxes have been deducted. In the five-year period, Starbucks (SBUX) appears to perform poorly because of the financial year that ended September 29, 2013. The firm reported a net operating loss. The firm’s positive net income is based on deferred tax. In the past three years to 2013, Starbucks performed better than Green Mountain. The operating loss was derived from litigation charges.
Earnings per Share
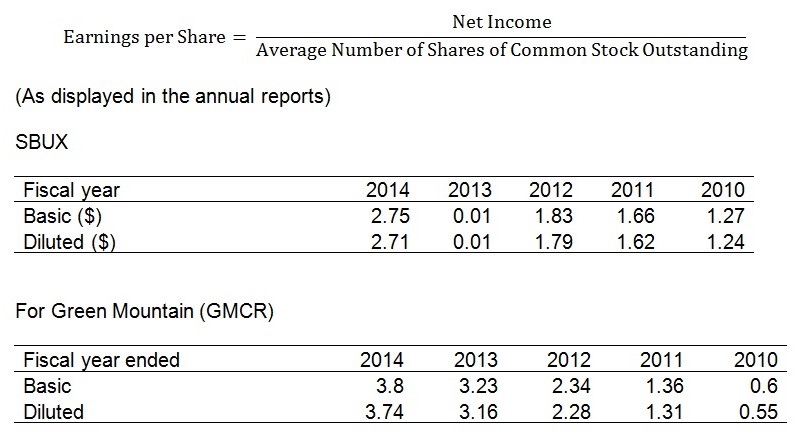
EPS indicates the distribution of earnings on common shares. A higher EPS shows that the firm has been effective in generating higher returns for the owners. Basic EPS shows the earnings per share when securities convertible to common shares are not included. Diluted EPS takes into account the existence of securities that can be converted into common stock (Edwards and Hermanson 743). Starbucks’ EPS is unstable when Green Mountain shows a steady improvement in EPS. Green Mountain started the period with lower EPS than Starbucks. It has exceeded Starbucks’ level since 2012.
Earnings yield on common stock
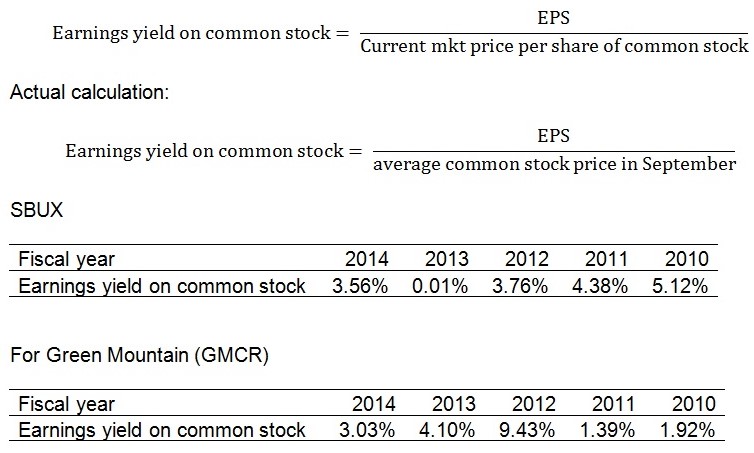
The earnings yield on common stock takes into account the market prices of common stock. It is necessary to consider the earnings yield because shares have different prices (Edwards and Hermanson 744). The earnings yield on common stock shows that Green Mountain offered a higher yield than Starbucks on average. Starbucks’ yield has declined over the five-year period. However, the difference in average yield is smaller than annual yields.
Return on Equity (ROE)
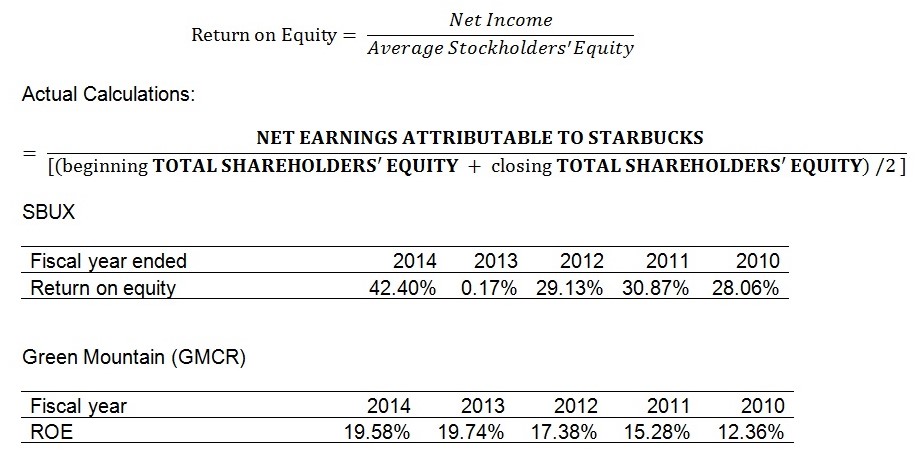
Return on equity measures a firm’s ability to generate earnings for shareholders using all sources of finance (Edward and Hermanson 537). The firm with a higher ROE has been more efficient in using finances to generate profits. Starbucks has had a higher ROE in most of the years. It shows that Starbucks has been more efficient in generating net income than Green Mountain, with the exception of 2013. The ratio has been increasing for both firms. In 2014, Starbuck reported a higher ROE, which may indicate that the firm has regained the initial upward trend.
Return on Assets (ROA)
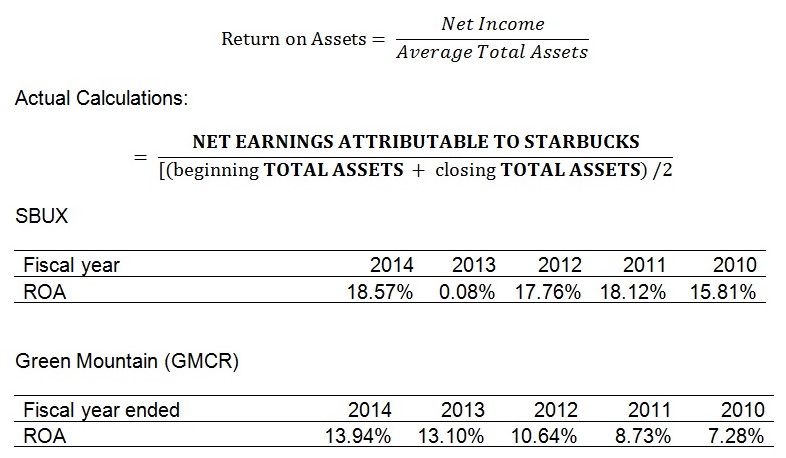
Return on assets shows the firm’s efficiency in utilizing assets to make profits. A higher percentage shows that the firm is more efficient. In four years out of five, Starbucks has recorded a higher ROA. It indicates that assets are better utilized in Starbucks’ operations than in Green Mountain. Both firms are showing a higher level of efficiency than they were five years ago. Starbucks has more efficient asset utilization.
Quality of income
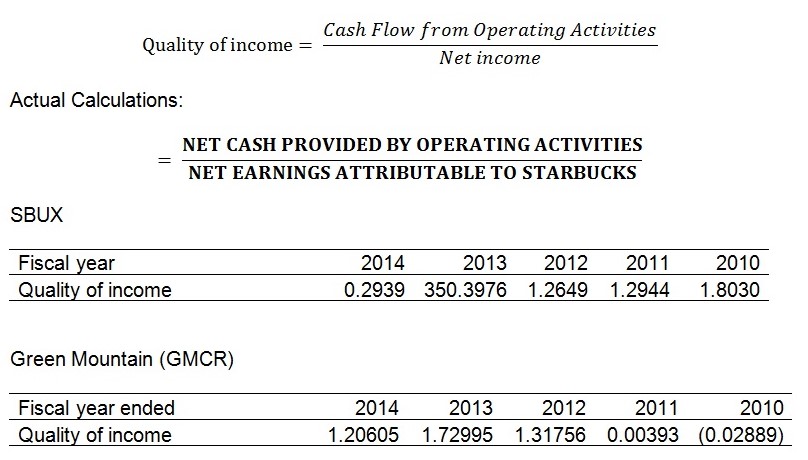
Quality of income ratio indicates the portion of net income that was collected as cash (Fiolleau, Hoang, and Jamal 41). A higher ratio shows that a higher fraction of net income was generated from cash sales. In 2013, Starbucks experienced a great reduction in net income, though cash sales remained at the same level. It is the reason for the rise in the quality of income ratio. It should not be interpreted as an improvement in the size of income collected as cash. In the last three years, Green Mountain appears to have a higher quality income than Starbucks. In the first two years of the period, Starbucks had a higher quality income compared with Green Mountain. Both firms show an irregular pattern in the quality of income.
Fixed Asset Turnover Ratio
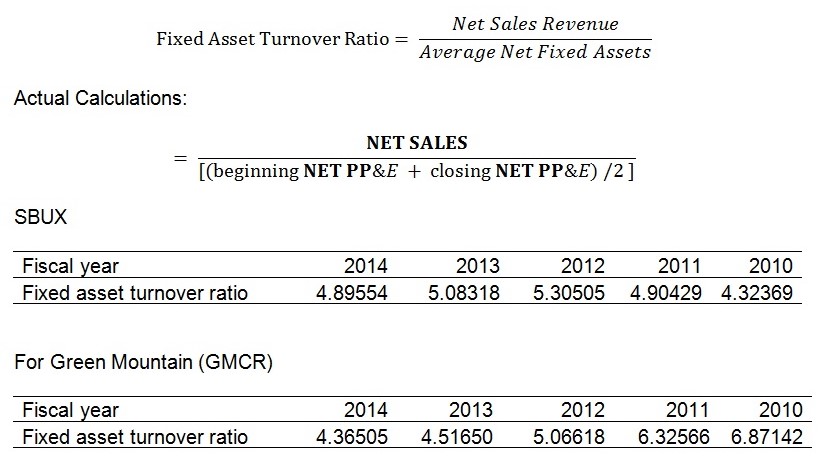
Fixed asset turnover ratio is the number of times that revenue covers investment in plant, property, and equipment. A higher ratio shows that the firm uses fixed assets more efficiently to generate sales. Starbucks has generated more sales from its assets in the last three years than Green Mountain. Starbucks’ ability to generate sales from fixed assets has been increasing steadily in the last five years, except for 2014. On the other hand, Green Mountain’s ability to generate sales has been declining.
Liquidity Tests (Starbucks)
Current Ratio
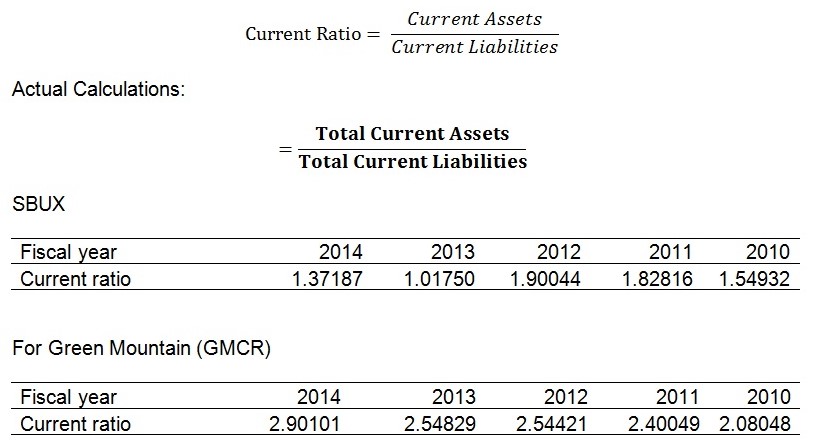
The current ratio shows the number of times that current assets cover short-term liabilities. A ratio higher than 1.0 shows that currently exceeds the amount that may be demanded by creditors in the short term. Edwards and Hermanson (186) explain that a current ratio higher than 1.0 may not be the final consideration. One has to consider the quality of current assets, such as fewer inventories and fewer accounts receivable. In both firms, inventory and accounts receivables take a large portion of current assets. However, Starbucks holds a smaller proportion of accounts receivables and current assets compared with Green Mountain. According to the nature of the industry, there is little threat of holding large inventories. Overall, Starbucks current ratio has declined when Green Mountain’s current ratio has increased. Both firms have the ability to meet their short-term debt obligations when required. Green Mountain has a higher ability. However, a higher current ratio may show inefficiency in managing cash. Cash should be invested in higher-yielding investments.
Quick Ratio (Acid Test)
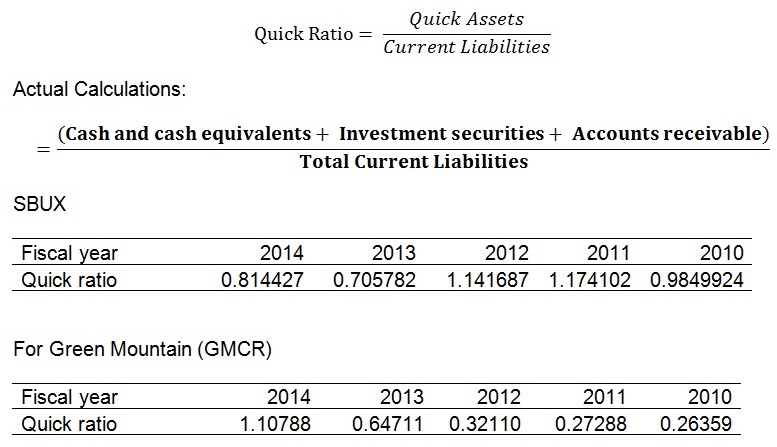
The quick ratio is an improvement from the current ratio because it eliminates the effect of low-quality short-term assets. In 2014, Green Mountain’s quick ratio indicates that the firm had adequate short-term assets to cover its current liabilities. However, in the previous years, it has been holding very low levels of high-quality current assets. Overall, Starbucks appears to have a better trend than Green Mountain. However, it has experienced a decline in quick assets in the last two years.
Receivable Turnover Ratio
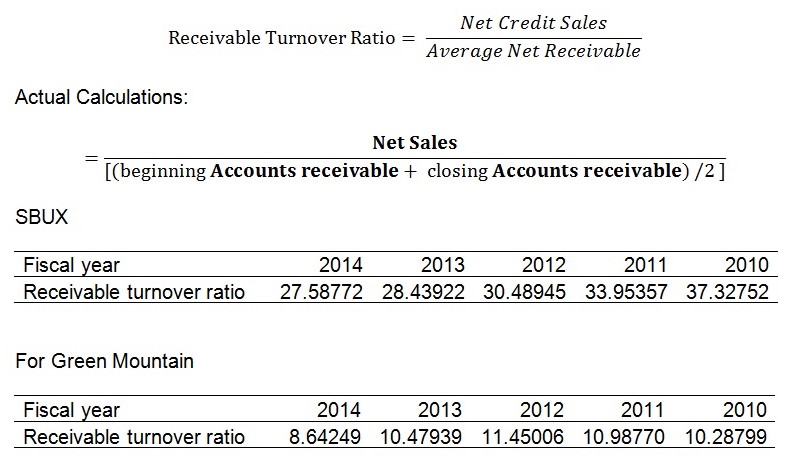
The receivable turnover ratio shows the average number of times accounts receivable is cleared by customers in a year. Net sales are used instead of credit sales because credit sales are usually not disclosed to outsiders (Edwards and Hermanson421). A higher receivable turnover shows that the firm collects cash from debtors within a short period. Starbucks has a higher number of times that it clears accounts receivables than Green Mountain. The difference is very large. It is surprising because both firms have accounts receivable amounts that are almost equal in size. However, Starbucks has higher sales than Green Mountain. Considering sales, Starbucks ($16.4 billion) is about four times the size of Green Mountain ($4.7). Relative to sales, Green Mountain holds a larger share of accounts receivable. The ratio shows that Starbucks has better performance in collecting debts.
Inventory Turnover Ratio
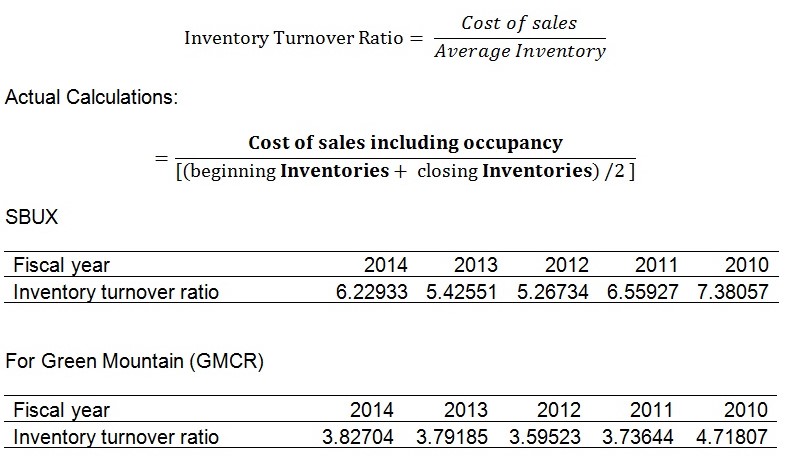
Inventory turnover ratio is an indicator that measures efficiency in managing inventory (Edwards and Hermanson 326). A higher inventory indicates that the firm is able to sell its average inventory many times in a year. Faster sales are indicated by a higher inventory turnover. Starbucks has a higher inventory turnover ratio, which shows the firm replenishes its outlets more times than Green Mountain. Starbucks manages inventory more efficiently than Green Mountain.
Solvency Tests (Starbucks)
Debt-to-Equity Ratio
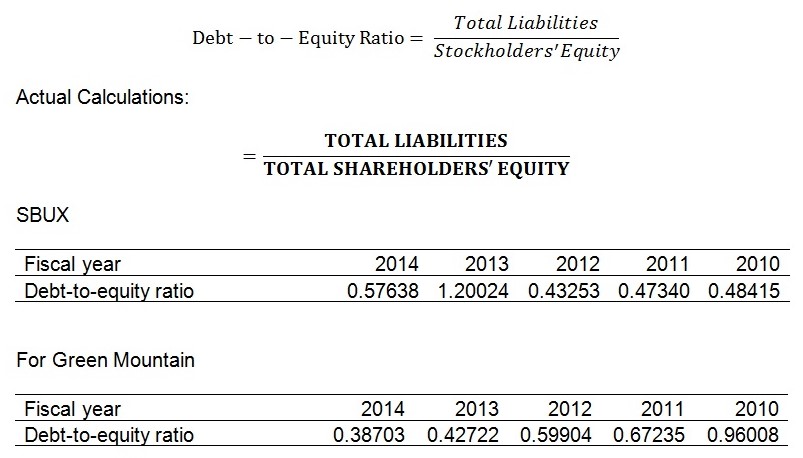
The debt-to-equity ratio indicates the extent to which financing has included debts. A higher level of debts will make the ratio larger and a smaller use of debts will make it smaller. In the first three years in the period under analysis, Starbucks had a lower debt-to-equity ratio. In the last two years, Starbucks has become more indebted than its competitor. Green Mountain’s debt ratio has improved when Starbucks’ debt ratio has become larger. Starbucks has increased risk by incurring more debt. However, the firm shows intent to reduce its reliance on debts. The situation is better for both firms because the size of debt is smaller than equity.
Times Interest Earned Ratio
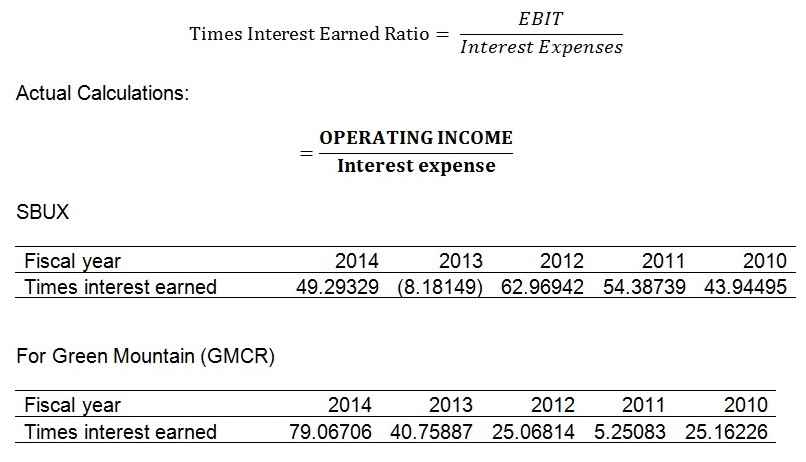
Times interest earned measures ability to meet interest expense obligations. Edwards and Hermanson (653) discuss that a higher times interest earned ratio gives creditors confidence that the firm will pay its debts. Times interest earned ratio indicates the number of times that interest expense can be paid from annual operating income. A higher ratio shows greater ability to cover amortization. Starbucks has had a higher ability to pay interest expenses for four years, except for 2013. Green Mountain has had the lower ability with the exception of the last two years. Overall, Starbucks shows greater ability to afford the interest expense. However, both firms have a higher ability to repay debts. (For the values used in calculations see Appendix I)
Sources of data: Keurig Green Mountain (Fiscal 2014 Annual Report), Keurig Green Mountain (Fiscal 2013 Annual Report), Keurig Green Mountain (Fiscal 2011 Annual Report), Keurig Green Mountain (Fiscal 2010 Annual Report), Starbucks (Fiscal 2014 Annual Report), Starbucks (Fiscal 2013 Annual Report), Starbucks (Fiscal 2011 Annual Report), Starbucks (Fiscal 2010 Annual Report).
Common size income statement
The absolute percentage changes indicate that net sales have increased steadily over the five-year period for Starbucks. In the last three years, the growth in sales has been impressive, increasing at a double-digit rate. Considering absolute changes, the cost of sales has increased steadily in the last four years. The increase in the cost of sales may be a result of a proportionate increase in sales. There seems to be increased efficiency because sales increased by a higher percentage than cost of sales in most of the years. Selling, general and administrative expenses have increased disproportionately to the increase in sales. In 2013, 2012, and 2010, there were a large increase in selling, general and administrative expenses. In the last two years, the absolute change in operating income has been negative because of the negative operating profit recorded in 2013. In the previous years, operating income had been growing at a higher rate. Starbucks would have been considered to have a great trend without the operating losses reported in 2013.
The relative percentage changes show the level of change as a percentage of sales from the previous year. Cost of sales became a smaller percentage of net sales in 2014, 2013, and 2012. It became a bigger portion of net sales in 2012 and 2011. A smaller portion of net sales being taken by the cost of sales creates a better opportunity to increase the profitability of the firm. Selling, general and administrative expenses took a larger part of net sales in 2010, 2011, and 2013. Its relative size reduced in 2014 and 2012. An increase in selling, general and administrative expenses shows reduced efficiency in managing overhead costs. The negative value in 2013 affected the relative size of operating income in the last two years. However, in the other three years, the firm’s operating income increased by a larger proportion compared to the size of sales.
Common size balance sheets
There is a disruption of the smooth trend line that the firm had in the first three years in 2013 when the firm had high litigation charges, amounting to an accrual of $2.784 billion in the balance sheet (Starbucks Fiscal 2014 Annual Report 47).
Assets
The largest asset by size is property, plant, and equipment, holding 32.7% of total assets. It is followed by cash and cash equivalents at 15.9% of total assets. Property, plant, and equipment declined from 37% of total assets to 32% in the five-year period. Cash and cash equivalents have also declined in 2014 compared with 2013. Short-term investments have declined in three consecutive years, from a high of 12.26% in 2011 to a low of 1.26% of total assets in 2014. Accounts receivable can be considered to have been maintained at the same level. Inventories have become a larger part than they were five years ago. Prepaid expenses and other current assets have not changed in proportion. Total current assets have declined in size in the last four years. It was 51.56% of total assets in 2011 compared with 38.77% in 2014. The common size analysis shows that the firm held most of its assets in a liquid state in 2012 and 2011. Long-term investment in securities has reached the same level it was in 2010, after declining in 2011, 2012, and 2013. Deferred income taxes have increased from 0% to 8.4%, as a result of the operating loss incurred in 2013. Goodwill has increased in five consecutive years. It may be an indication that the brand is getting stronger.
Liabilities
Accounts payable has remained at about 4.5%, with the exception of 2013. Accrued litigation charges were recorded only in 2013, at 24.17% of total assets. In the last three years, the firm has faced accruals in compensation and related charges, taxes, and occupancy costs. It means fewer current liabilities for the firm. Litigation charges have made them larger, but it is only incurred once. Insurance reserves have not changed by a large proportion. Other accrued liabilities have increased in proportion. Total current liabilities have remained near 28%, with the exception of 2013, where they reached 46.69%. Long-term debt has increased. Total liabilities have increased in size in the last three years to cover more than half of total assets.
Equity
Common stock has remained unchanged. Additional paid-in-capital has declined, though it has an irregular trend. Retained earnings remain a large part that finances the firm, at 48.42% in 2014. It declined only in 2013. Total shareholders’ equity has declined in 2014 compared with 2012, 2011, and 2010. The decline in the proportionate size of stockholders’ equity elaborates the impact of legal risks that the firm was exposed to in 2013.
DuPont Analysis (Starbucks)
Sales efficiency (Values in millions of dollars)
Sales efficiency= Sales/asset
For 2010, =1.79013
For 2011, =1.70233
For 2012, =1.70730
For 2013, =0.75457
For 2014, =0.73858
Sales efficiency declined in the last two years. Initially, revenues exceeded the value of average total assets. The decline in sales efficiency can be attributed to the increase in assets. Average assets increased by 14.9% in 2011, 13.3% in 2012, 26.7% in 2013, and 12.84% in 2014. It exceeds the absolute change in net sales as examined in the common size income statement analysis. However, the sales efficiency ratio is still sufficient to support a high return on assets.
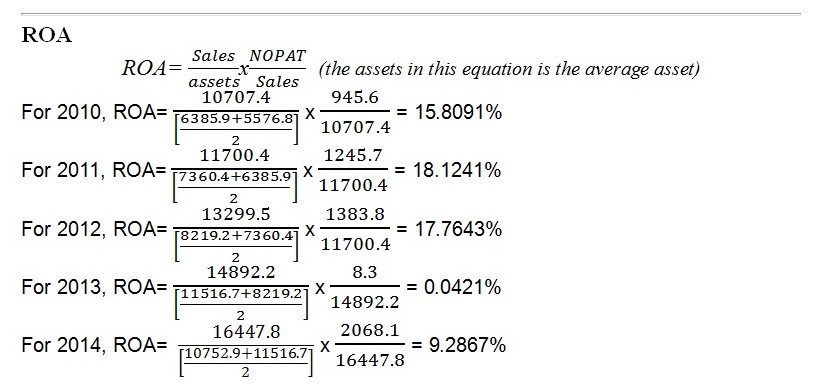
Return on assets declined in 2013 and increased in the remaining four years. In the first three years, the firm maintained a high level of ROA. The decline in ROA is associated with the decline in net income in 2013, with spill-over effects in 2014. The firm can regain its initial growth path.
Leverage
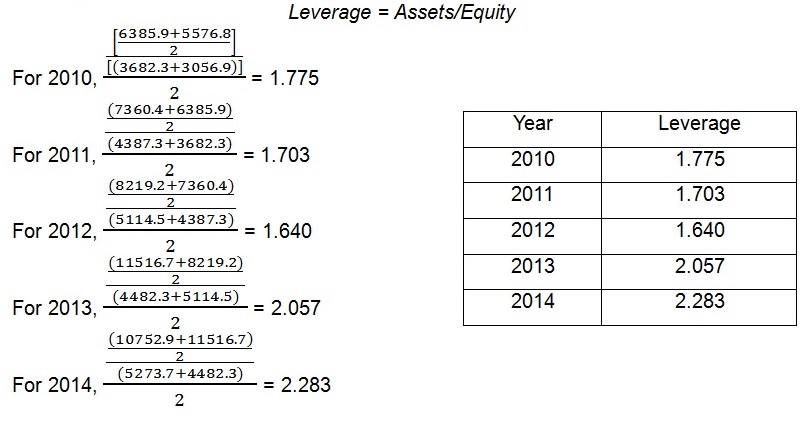
Leverage compares the size of assets relative to the size of equity. When average assets exceed average stockholders’ equity, leverage becomes larger than 1.0. A ratio that is more than 1.0 indicates that part of the assets is financed by debts. Starbucks’ leverage declined between 2010 and 2012. It increased in 2013 and 2014. It shows that the firm is increasingly using debts to finance its assets. The firm’s size of assets has increased. Increased leverage shows that there is increased risk for shareholders. In the current situation, shareholders would recover nothing in case of insolvency because debts exceed shareholders’ equity. Increased debt also results in increased interest expense, which reduces profits.
Interest efficiency
Interest efficiency= NI/NOPAT
For 2010, ![]() = 1.520
= 1.520
For 2011, ![]() = 1.454
= 1.454
For 2012, ![]() = 1.488
= 1.488
For 2013, ![]() = -27.699
= -27.699
For 2014, ![]() = 1.528
= 1.528
Interest efficiency has declined in 2011 and 2013. In 2014, the firm’s interest efficiency has returned to the same level it was in 2010.
ROE
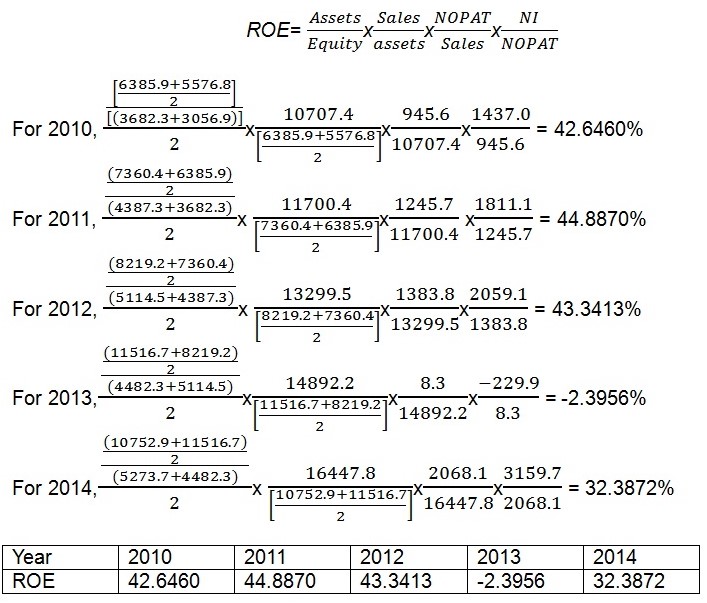
In the DuPont analysis, ROE is the product of leverage, ROA, and interest efficiency respectively. ROE increased in 2011 and 2014. The increase in ROE in 2011 can be attributed to the increase in ROA in 2011. It is the only component that increased in 2011. Leverage and interest efficiency declined in 2011. The increase in ROE in 2014 can be explained by the increase in leverage, ROA, and interest efficiency. Leverage has a positive impact on ROE because it increases the size of assets that generate income for shareholders.
There were declines in ROE in 2012 and 2013. In 2012, the reduction in ROE was a result of the decline in ROA and leverage. Interest efficiency is ruled out because it increased in 2012. In 2013, the reduction in ROE can be explained by the decrease in interest efficiency and ROA. The two components are affected by the net operating loss incurred in 2013.
Summary of results
In four years out of five, Starbucks has recorded high growth in sales and profitability. The firm has high ROE and ROA ratios that make it profitable to hold its shares. The firm has maintained adequate quick assets and kept the level of debt low. The firm is expected to have high growth in sales and profitability in 2015, as discussed in the recent news.
Recommendations
Our group recommends that it will be a good decision to invest in SBUX stock. Comparing Starbucks and Green Mountain, it is visible that Starbucks has a better financial performance in the five-year period. When 2013 is singled out, Starbucks has great potential for growth and increased profitability.
In 2013, the litigation charges affected Starbucks’ level of debt and profitability. It also affected cash flow in the following year. The firm performed well in the remaining years. Litigation charges can be isolated when they have rare occurrence. The firm’s ROE and ROA are very high. Earnings yield show that EPS may be different, but the rate of return to shareholders is almost the same between the two firms. The debt-to-equity ratio has been low compared with the competitor, except in 2013 and 2014. The firm has always kept adequate quick assets to cover current liabilities. The firm had reported high rate of returns before 2013. Sales have been increasing steadily and the firm may regain its financial position. It may regain the same level of profitability as the one it had before 2013 because all key factors of profitability have remained unchanged. The firm has reported higher growth in profitability in the second quarter of the current fiscal year (Strom par. 2). Based on these highlights, we recommend that investing in SBUX will yield high returns and likely growth in stock price.
Works Cited
Burritt, Christopher. Starbucks to Pay $2.79 Billion to Settle Coffee Dispute. 2013. Web.
Dechow, Patricia, Korcan Ak, Estelle Sun, Annika Wang. Do Financial Ratio Models Help Investors Better Predict and Interpret Significant Corporate Events? PDF file. 2015. Web.
Edwards, James, and Roger Hermanson 2010, Accounting Principles: A Business Perspective Volume 1 Financial Accounting. PDF file. 2015. Web.
Fiolleau, Kristen, Kris Hoang, Karim Jamal. A Director’s Guide to Corporate Financial Reporting. New York: Business Expert Press, 2010. Print.
I & M Smith. Tea and Coffee. n.d. 2015. Web.
Keurig Green Mountain, 2014, Fiscal 2014 Annual Report. PDF file. Web.
Keurig Green Mountain, Fiscal 2013 Annual Report. PDF file. Web.
Keurig Green Mountain, 2011, Fiscal 2011 Annual Report. PDF file. Web.
Keurig Green Mountain, 2010, Fiscal 2010 Annual Report. PDF file. Web.
Restaurant News Resource. Starbucks delivers Record Revenue and EPS. 2015. Web.
Starbucks, Fiscal 2014 Annual Report. PDF file. Web.
Starbucks, Fiscal 2013 Annual Report. PDF file. Web.
Starbucks, 2011, Fiscal 2011 Annual Report. PDF file. Web.
Starbucks, Fiscal 2010 Annual Report. PDF file. Web.
Strom, Stephanie. Sales and Profit Rise for Starbucks and Dunkin’ Brands. 2015. Web.
Appendices
Appendix I