Introduction
UK supermarket Industry
The supermarket industry in the United Kingdom is dominated by four key players. These four players are Asda, Morrison, Sainsbury, and Tesco. Since the industry is dominated by the four firms, it shows that it is an oligopoly industry. An oligopoly industry is characterized by a small number of independent firms. Besides, there is a barrier to entry into the industry. This can be attributed to economies of scale and capital requirements. The supermarket industry in the United Kingdom is profitable. It is for the reason that most people get all their needs in the supermarket. The four big brands take about 75% of the market share of the supermarkets. The rest of the market share is taken by the small supermarkets. Among the four big brands, Tesco has the largest market share. The table below summarizes market share of the supermarkets.
Market share of supermarkets in the United Kingdom
Source of data – BBC News 2005.
Wm Morrison Supermarkets plc
William Morrison formed Wm Morrison Supermarkets in 1899. The Company is the fourth largest supermarket chain in the United Kingdom. The company has 470 stores in the country. It has engaged about 132,000 employees (Thomson Reuters 2012; WM Morrisons Supermarkets plc 2012c). As at 2011, the company’s revenue amounted to £16.479 billion and net income amounted to £ 632 million. It aims to supply unique, high quality and fresh food at great prices to its customers (WM Morrisons Supermarkets plc 2012b, p. 69).
J Sainsbury Plc
The Sainsbury Company is one of the oldest retailers in London. It was founded in 1869. It is currently the third largest supermarket in the country. It is a Public Limited Company trading on the London Stock Exchange. The company has 1,000 stores in the country where there are 660 supermarkets and 440 convenience stores (J Sainsbury Plc 2012a). As of 2011 the company had 150,000 employees. In 2011, the company had revenue amounting to £ 21.102 billion and the net income amounted to £ 640 million (J Sainsbury Plc 2012b).
Strategies of the supermarkets
The Wm Morrison Supermarket’s strategy is to build long term sustainable growth based on its strengths of providing high quality fresh food. It takes note of the customer needs and wants and the changes that take place in the market in order to provide great value and service to the customers. The company has focused on space expansion where the stores have increased from 8,000 to 40,000 square feet in size. There is also focus on two new channels of delivery which are convenience stores and online shopping (WM Morrisons Supermarkets plc, 2012b pp. 12 – 14; The Telegraph 2011).
Business strategies of the company are based on its five pillars, these are, complementary channels and services, compelling general merchandise and clothing, developing new business, great food, and growing space and creating property value. It owns the Sainsbury Bank together with Lloyd Banking Group. It is also in business with Land Securities Group PLC and British Land Company where they own two land ventures. The company focuses on providing healthy, tasty and fresh food at fair prices. It also offers complimentary non-food products and services in the stores. Additionally, the company also has a home delivery shopping service (J Sainsbury Plc 2012c; The Telegraph 2012).
The paper carries out strategic financial analysis of Wm Morrison Supermarkets Plc and J Sainsbury Plc. The paper compares the financial statements of the two supermarkets. It also carries out ratio analysis of the two companies.
Financial Analysis
Income statement analysis
Common Size Income Statement
The cost of sales of Morrisons was consistent at 93% sales for the three years. On the other hand, the Sainsbury cost of sales was higher at 95% of the revenue in 2011. This can be attributed to Morrisons’ ability to control its costs by obtaining raw materials and other goods at low prices enabling it to get a higher gross profit at 7% of revenue compared to 6% of Sainsbury Company.
The Sainsbury administrative expenses were higher at 2.3% of the revenue compared to Morrisons which stood at 2%. Sainsbury’s operating income rose from 3.5% to 4% in 2011. The increase in operating profit can be attributed to the company’s solid sales performance over the period and savings accrued in the company’s cost efficiency practices. The cost efficiency strategies were able to offset the effects of cost inflation. The Morrisons operating profit rose from 4.6% to 5.84%. In 2010, the company had lesser administrative expenses compared to 2009. It had opened new stores which increased the store wages and distribution costs.
The finance costs of the Sainsbury Company are higher at 0.5% compared to the Morrisons’ finance costs at 0.3%. At Sainsbury, there was no change in the finance costs of the company in 2010 and 2009. However, in 2011, the finance costs decreased due to the exclusion of the non-cash pension financing element of £24 from its finance costs. There was no change in the finance costs at the Morrisons Company in 2010 and 2009. However in 2011, the finance costs reduced from £60m to £43m. There was a reduction in the interest payable on bonds, increase in capitalized interest and a reduction in the fair value of financial derivative instruments.
The profit before taxation increased for both companies during over the three years. However the Morrison Company’s profit was higher in 2010 compared to 2011 due to high administrative expenses in 2011.
Comparative Income Statement Analysis
The comparative analysis of the income statements of the two companies shows both companies reported increased sales despite the increase in operating cost (BBC News 2011a: BBC News 2011b). The increase in sales was attributed to the expansion program undertaken by the both companies. Profit for Morrisons Company increased by 4.4% from 2009 to 2010. This further increased by 7.2% in 2011.
This can be attributed to the cost efficiency strategies of the company which enabled it to offset the effects of cost inflation. For Sainsbury, the operating profit increased by at least three times compared to the increment in 2010. It increased by 19.9% in 2011 compared to the 5.5% in 2010. This can be attributed to the aggressive sales strategy of the company and its ability to control its administrative expenses.
Cost of sales at Morrisons Company increased from 5.4% in 2010 to 6.9% in 2011. Though the profits for Morrisons Company were than those of Sainsbury, the profits had reduced by 0.3% in 2011 compared to 35.2% profit increment experienced in 2010. In 2010, the Morrison Company had great strategies in controlling its storage and distribution expenses. They were aware that the increase in the number of stores would increase the costs. The innovative strategies helped the company to control its costs. However, in 2011, the administrative costs rose again.
Balance sheet analysis
Common Size Balance Sheet Analysis
The vertical analysis shows the various items in the balance sheet as a percentage of the total assets. On the asset side of the Sainsbury Company, the non-current assets decreased to 77.09% in 2011 from 77.95% in 2009. The Sainsbury Company in 2010 had invested £886m in capital for new store development and refurbishments. The company received £131m for store disposals. In 2011, the company generated from property yields. The Morrisons Company increased its investment in the property, plant and equipment investment from 83.13% to 84.92% of total assets. The Company bought 34 stores from the Co-operative group and opened new stores. In 2010, the property investment dropped to 82.6%.
Inventories for Sainsbury Company increased from 6.87% to 7.12% during the three years. Trade and other receivables also increased from 1.98% to 3%. Cash and cash equivalents declined from 6.25% to 4.4%. Stocks for Morrisons Company increased from 6.01% to 6.97% while cash and cash equivalents declined. In both companies, the increment in the stocks is attributed to the new stores opened. The decrease in cash and cash equivalents occurred due to the increased capital expenditures in the period.
At Sainsbury Company, the trade receivables decreased from 24.8% to 22.78%. Similarly, borrowings declined from 1.53% to 0.65%. At Morrisons Company, creditors declined from 23.28% to 20.98%. At Sainsbury Company, the borrowings in the non-current liabilities decreased by £18 million in 2011. In 2010, there was an increase in the borrowings of £180m which was caused by the company taking up the unsecured facility repayable between 2012 and 2015.
At Morrisons Company, there was a decrease in the long-term financial liabilities in 2010 caused by the payment of a £250 Euro bond. The deferred tax liabilities increased from 0.95% of total assets to 1.52% and 19% in 2010 and 2011 respectively in Sainsbury Company. At Morrisons Company, the balance increased from 5.74% to 5.45% 43% in 2011. The deferred tax liabilities arise due to changes in the temporary differences between the tax base and accounting bases of the assets and liabilities.
In 2010, the shareholders’ equity in Sainsbury increased by £590 million due to capital raise in 2009. On 22nd June, 2009, the Sainsbury Company raised £242 million by issuing new shares. Apart from the shares, the company also issued bonds amounting to £190 million.
At Morrisons Company, the shareholder’s funds increased by £458 million in 2010. Management of the company also issued new shares in 2011. This contributed to an increase of £1m in share capital and £15m in share premium from the public and £2m in share capital and £32m in share premium for shares issued to employees. The company had a decline from 1.36% to 1.01% of revenue in the provisions in 2011 and 2010 due to the reversal of unused amounts during the period.
Comparative balance sheet analysis
The Sainsbury Company had an increase in its investment in property, plant and equipment from 4.9% to 7.1%. In 2011, there was an increase of £581 million mainly due to the revaluation of some of the assets upwards and additional new stores. Similarly, Morrisons Company had an increase in property, plant, and equipment and investment property of 8.8% in 2010 compared to 1.6% in 2011. In 2010, the Company opened 45 stores and acquires more stores from co-operative. It also had an increase in intangible asset. Licenses and software development costs were also reclassified.
The working capital of the Sainsbury Company increased in 2011 by £78m. It is attributed to the increase in inventory amounting to £110 million. In 2010, working capital increased by 2% equivalent to £92 million. The working capital for Morrisons Company increased in 2011 by £47m which can be attributed to the increase in inventories and debtors. In 2010, the increase in working capital had been lower at £27 million. The company reduced its debtor balances by £45m and the cash holdings were utilized showing a reduction of £82m.
Morrisons Company had constant liabilities while the amount of liabilities for Sainsbury Company increased over the three year period. For non-current liabilities, both companies had an increase in long term liabilities.
Financial Ratio Analysis
Financial statements provide the users with a narrow insight into the financial strengths and weaknesses of a business because reported values do not give an in depth depiction of performance of an entity. Financial analysis breaks down the financial data into various components for better understanding. It helps in giving trends in performance over time (Vance 2003; University of Missouri 2011).
Liquidity ratios
Analysis of liquidity is necessary as it establishes the ability of an organization to maintain positive cash flow while satisfying immediate obligations, that is, the availability of cash to pay current debt. The common ratios used to analyze liquidity are current and quick ratio (Haber 2004; Brigham & Joel 2009). The table below summarizes the liquidity ratios for the two companies.
Liquidity ratios
Continuation
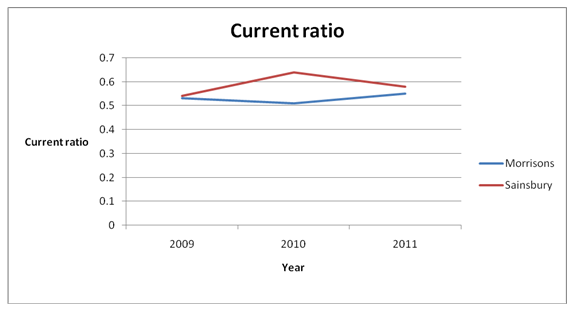
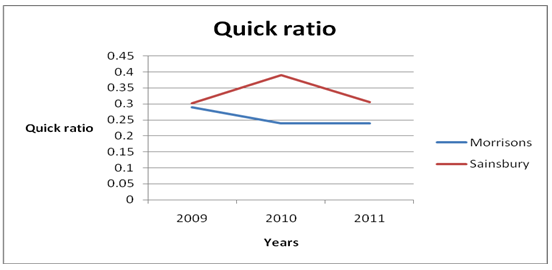
From the table above, the liquidity ratios for Morrisons Company was stable over the three year period. The current ratio for the company ranged between 0.51 and 0.55 while the quick ratio ranged between 0.29 and 0.24. On the other hand, liquidity ratios for Sainsbury Company fluctuated over the three years. The current ratio for the company ranged between 0.54 and 0.64 while the quick ratio ranged between 0.302 and 0.39. From the comparisons it is noticeable that the liquidity ratios of Sainsbury Company were higher than that of Morrisons. This can be attributed to the fact that Sainsbury Company had more current assets than Morrisons. The liquidity ratios for the two retail stores are less than one. This implies that the current assets of the two companies cannot cover the current liabilities. Both companies should work on improving their liquidity ratios. The graph below shows trend of current ratio.
The graph below shows trend of quick ratio.
Profitability ratios
Profitability is the ability of an entity to earn income after excluding cost of running a business. Various ratios are used to analyze profitability such as, gross profit margin, operating profit margin, net profit margin, the return on assets (ROA) ratio, and the return on equity (ROE) ratio (Siddidui 2005). The table below summarizes return on equity for the two companies.
Return on equity
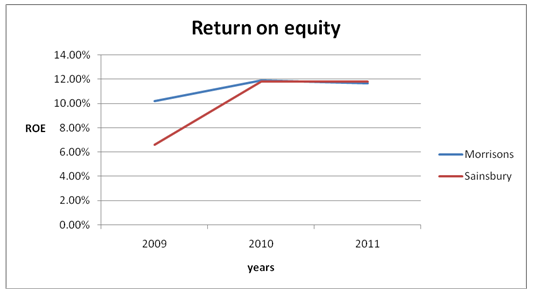
From the table above, return on equity of the two companies has been increasing over time. Return on equity for Morrisons have been fairly stable, ranging between 10.18 and 11.90. On the other hand, return on equity of Sainsbury Company ranged between 6.6 and 11.80. This reflects on the profitability of the companies. It is observable that Morrisons had fairly stable performance over the three year period. It can also be observed that Sainsbury had low performance in 2009. This can be attributed to the low profitability that the company reported. To 2009, the net profit of Sainsbury amounted £289 million. This rose to £585 million in 2010. The low profits reported were a result of the economic meltdown. In addition, Sainsbury had a lot of expansion program in 2009. The graph below shows the trend of return on equity for the two companies.
Return on capital employed (operating profit/average capital employed)
Source of data – WM Morrisons Supermarkets plc 2012b, p.11; J Sainsbury Plc 2012d, p. 2
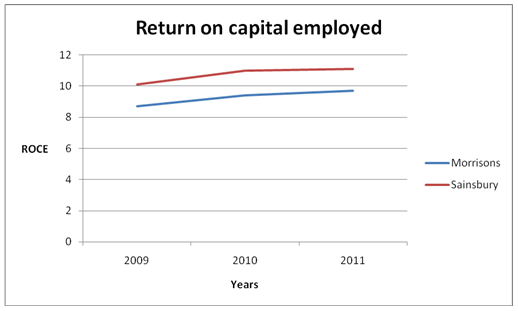
From the table, Sainsbury reported higher return on capital employed than Morrisons. Return on capital employed for Sainsbury ranged between 10.1 and 11.1 while that for Morrisons ranged between 8.7 and 9.7. The graph below shows trend of return on equity for Morrisons and Sainsbury.
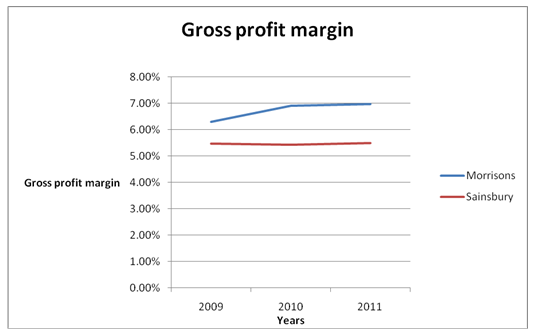
Gross profit margin (gross profit/sales)
Source of data – (WM Morrisons Supermarkets plc 2012b, p.6; J Sainsbury Plc 2012d, p. 43 – 46
From the table above, the gross profit margin of Morrisons Company ranged between 6.3% and 6.97% while the gross profit margin for Sainsbury Company ranged between 5.42% and 5.46%. It is observable that the gross profit margins for Morrisons are higher than those of Sainsbury. Both companies had low gross profit margins due to high costs of sales. The graph below depicts the trend of gross profit margin of the two companies over the three year period.
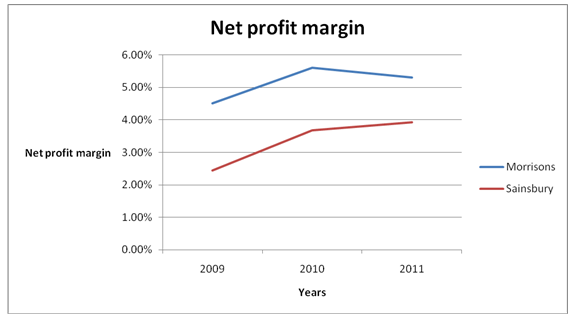
Net profit margin (Net profit before tax profit/sales)
Source of data – WM Morrisons Supermarkets plc 2012b, pp.61 – 64; J Sainsbury Plc 2012d, p. 43 – 46
From the table above, net profit for Morrisons ranged between 4.51% and 5.6% while net profit margin for Sainsbury ranged between 2.45% and 3.92%. Morrisons Company had a higher net profit margin than Sainsbury. Further, it is evident that the net profit margin for both companies rose over the three years. Thereafter, the net profit margin has been on an upward trend for both companies as shown in the graph below.
Summary of explanation on profitability of the company
Morrisons Company incurred heavy capital expenditure. These were attributed to investment in infrastructure. It comprised of replacement of IT system, strengthening the supply chain and building new stores. The company spent £796m on expansions. Besides, the company opened an additional 37 stores within the same year. In addition, the company spent £31million in acquiring a minority stake in Fresh Direct. The company made a further acquisition amounting to £74 million. These massive capital investments reduced the profitability of the company (WM Morrisons Supermarkets plc 2012d). Similarly, Sainsbury incurred £252 million on capital expenditure. The amount was spent on expanding (J Sainsbury PLC 2012d, p. 22). The expansion programs undertaken by the company and the economic downswing contributed to the profitability reported above.
Gearing ratios
Financial gearing shows a company’s vulnerability to risk that is, the degree of protection provided for the business’ debt. Several ratios can be used to measure the safety of a business entity such as debt to equity. It is preferable for companies to maintain low gearing ratios (Eugene & Michael 2009; Atrill 2009).
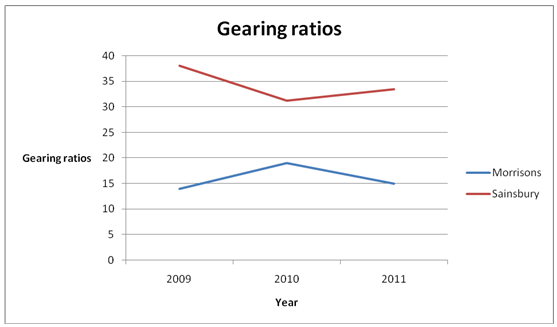
Gearing (Net debt/ total equity)
Source of data – WM Morrisons Supermarkets plc 2012b
From the table, Sainsbury had high gearing ratios ranging between 31.2% and 33.4% while Morrisons had slightly lower gearing ratios ranging between 14 and 19 than Sainsbury. The increase in gearing ratios of Sainsbury Company increased from 31.2% to 33.4% is attributed to an increase in the net debt amounting to £265m. In 2010, the gearing ratio was lower than in 2009 due to the decrease in net debt and the increase in the net assets. In the Morrisons Company, the gearing ratio in 2011 reduced to 15% due to a decrease in the net debt of £107m. In 2010, the gearing ratio shot up to 19% due to a significant increase in the net debt of £642m. The Sainsbury Company is more geared than the Morrisons Company due to a higher proportion of debt compared to total equity. Trend of gearing ratios for the two companies is shown in the graph below.
Debt to capital ratio (Total debt/total capital)
Source of data – WM Morrisons Supermarkets plc 2012b, pp.61 – 64; J Sainsbury Plc 2012d, p. 43 – 46
The debt financing compared to the total financing of the company showed that both companies reduced their debt financing over the three years. In the Sainsbury Company, despite the increase in debt, the increase in equity caused a reduction in the debt capital ratio. In 2011, Morrisons Company reduced its debt while equity financing increased. Therefore, the debt capital ratio reduced over the period. The graph below shows the trend of debt to equity ratio over the three year period.
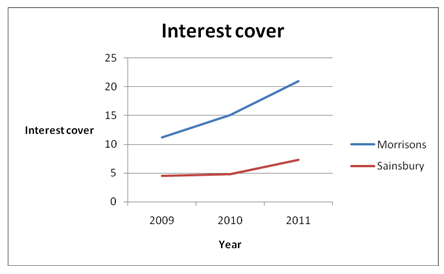
The interest cover ratio shows the investors the number of times the company can pay the interest expense using the operating profit.
Interest cover (Operating profit/interest payable)
Source of data – WM Morrisons Supermarkets plc 2012b, pp.61 – 64; J Sainsbury Plc 2012d, p. 43 – 46
A high interest cover is favorable. From the table, Morrisons recorded a better performance than Sainsbury. This can be attributed to reduced debt, increased equity financing and increased profitability. Both companies reduced their finance costs while at the same time their operating profits increased. This increased the ability of the companies to cover their interest payments over the period. The graph below shows the trend of interest cover over the three year period.
Investment ratios
These ratios show the performance of shares in the stock market. The tables below summarize investment ratios for the two companies.
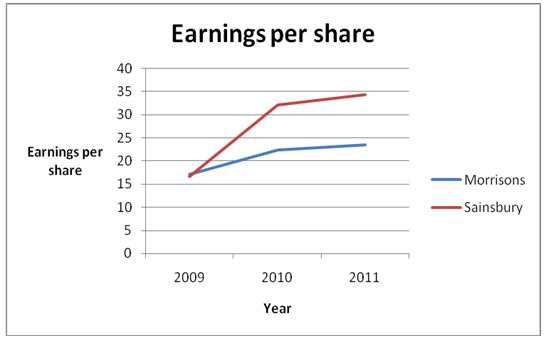
Earnings per Share = Earnings / Total Number of Shares
Source of data – WM Morrisons Supermarkets plc 2012b, pp.61; J Sainsbury Plc 2012d, p. 18.
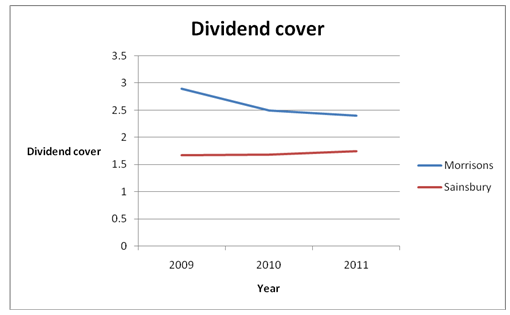
Dividend Cover = profit after tax attributable to equity shareholders / total dividends declared
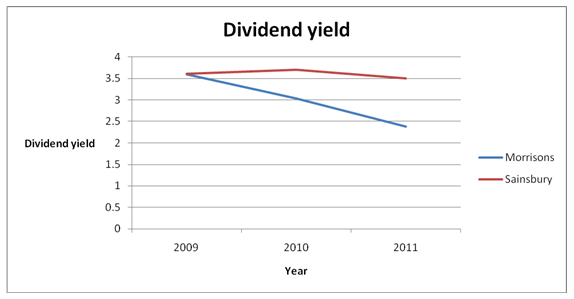
The graph below shows the trend of dividend yield for the three years.
Dividend Yield = Dividend per Share / Market Value per Share
Source of data – WM Morrisons Supermarkets plc 2012a, p.28; J Sainsbury Plc 2012d, pp. 16.
The graph below shows the trend of dividend yield for the three years.
The dividends issued by the company increased as a result of the increase in earnings per share. In analyzing the data for the Morrisons Company, there was also an increase in the earnings per share, dividend per share and the dividend cover over the three years. The earnings per share and dividends per share for the company are lower than Sainsbury since Morrisons had lower profits.
The Morrisons Company has been able to maintain a ratio of 2.4 which the company claims that it is in agreement with the European food retail sector average. The Sainsbury Company on the other hand passed a policy in 2007 to maintain its dividend cover between 1.5 to 1.75 times.
Summary of Financial Performance & Suggestions for Improvement
Both the Sainsbury and Morrisons Companies need to improve their liquidity. There are several ways of increasing the current assets. The companies may reduce the average collection period. This is the time it takes for the company to receive payment from its debtors (McLaney & Atrill 2008; McAleese 2006). Lesser collection periods are always preferred. This reduces the amount of time of changing debtors to cash. The companies may also increase its levels of cash and cash equivalents (Head & Watson, D 2009).
The focus should not be on increasing the stocks since there are associated costs that accrue when holding inventory. It seems that both companies focus on aggressive working capital management styles. They are focusing on profitability and investment at the cost of liquidity. This often proves to be disastrous for a company if the practice is done over a long period of time (Holmes & Sugden 2008). However, a company should always prudently manage its working capital to take care of its liquidity and investment needs. The aim of both companies should be to raise the current ratio and quick ratio to 1 or more but not more than 2 (Arnold 2008).
The Sainsbury Company needs to monitor its gearing ratios. They are higher than the Morrison ratios. It is more advisable to lean towards equity financing since payment of dividends is adjusted depending on the earnings of the financial period. It is also not mandatory to pay dividends to the ordinary shareholders. A lot of debt also comes with restrictive covenants. The creditors will come up with terms of agreement on how they want the company to utilize their assets in order to protect their interests. This can limit the strategic objectives of the company (Collier 2009).
Both companies should enhance their gross profit and net profit margins. The best strategy would be to reduce their costs since increasing their prices would reduce their sales. The Sainsbury Company has a higher cost of sales and administrative expenses than the Morrisons Company. A reduction of the costs would raise the profits of the company (Fraser 1990). The company will have to work at being efficient in its processes.
References
Arnold, G. 2008. Corporate financial management, Prentice Hall, Harlow.
Atrill, P. 2009. Financial management for decision makers, Financial Times Prentice Hall, Harlow.
BBC News. 2005. Is Tesco too big?. Web.
BBC News. 2011a. Sainsbury’s submits plans for store at Malmesbury garden centre site. Web.
BBC News. 2011b. Sainsbury’s annual profits rise by 12.8% to £827m. Web.
Brigham, F & Joel, F. 2009. Fundamentals of financial management, South-Western Cengage Learning, USA.
Collier, P. 2009. Accounting for managers, John Wiley & Sons Ltd, London.
Eugene, F & Michael, C. 2009. Financial management theory and practice, South-Western Cengage Learning, USA.
Fraser, G. 1990. Decision accounting, Basil Blackwell Ltd, Oxford.
Haber, R. 2004. Accounting dimistified, American Management association, New York.
Holmes, G & Sugden, A. 2008. Interpreting company reports, Financial Times/Prentice Hall, Harlow.
Head, A & Watson, D. 2009. Corporate finance: principles & practice, Prentice Hall, Harlow.
J Sainsbury plc. 2012a. About us. Web.
J Sainsbury Plc. 2012b. Financial performance. Web.
J Sainsbury Plc. 2012c. Business strategy and objectives. Web.
J Sainsbury Plc. 2012d. Annual report and financial statement. Web.
McAleese, D. 2006. Economics for business: competition, macro-stability and globalization, Financial Times-Prentice Hall, Harlow.
McLaney, E & Atrill, P. 2008. Financial accounting for decision makers, Prentice Hall Europe, Harlow.
Siddidui, A. 2005. Managerial economics and financial analysis, New age international (P) limited, New Delhi.
The Telegraph. 2011. WM Morrison ends Solid year with £1bn buyback. Web.
The Telegraph. 2012. Sainsburys beats expectations with 1.9pc sales growth. Web.
Thomson Reuters. 2012. WM Morrison supermarkets plc (MRW.L). Web.
University of Missouri. 2011. Financial ratios. Web.
Vance, D. 2003. Financial analysis and decision making: Tools and techniques to solve, McGraw-Hill books, United States.
WM Morrisons Supermarkets plc. 2012a. Annual report and financial statements 2012. Web.
WM Morrisons Supermarkets plc. 2012b. Annual report and financial statements 20112012. Web.
WM Morrisons Supermarkets plc. 2012c. Business and strategy review. Web.
WM Morrisons Supermarkets plc. 2012d. Financial review. Web.