Al Futtaim Group and Galadari Group are not only among the financial giants in Australia but in the Asian region, as well. The key focus in this paper will be the analysis of the adopted business model or strategy of each of the company. In preparing financial statements, it is necessary to make judgments and as such, some of them will be covered in the discussion. Degree of Operating Leverage as well as the Degree of Financial Leverage plays a significant role in any financial analysis as they help come up with the degree of sustainability of a particular company. Further, they assist considerably in establishing the financial forecast for the coming year. Financial ratios are also important as they help in, not only analyzing, but measuring the performance, as well. Investors regard financial analysis and forecast highly since it plays a key role in determining what kind of investment decisions the investor will make.
Introduction
According to financial analysts, financial analysis is a term referring to assessment of an organization to determine its viability in dealing with such aspects as budgeting, planning, forecasting, in addition to, improve the details related to finance within a business. The contemporary financial reporting requirements have been found to be characterized with the stringency and as such, it is decidedly essential that one understands his organization. In order to avoid financial risk, the person in charge of the organization must ensure that he identifies ascertain financial ratios, in addition to, trends crossings the liabilities as well as assets of the organization (Mills & Jeanne 53). Further, the person should ensure that he not only analyses but adjusts those amounts that have been planned and forecasted, as well. Still, he must ensure that he acts in a way that will enable him provide the regulatory statements, as it is required.
Micro strategy platform
Micro Strategy platform is a tool used in financial analysis thus making activities easier, in addition to, being efficient (Mills & Jeanne 55).
Financial analysis, when done using Micro Strategy, is not only easy but also efficiently done, as well. This is because; the Micro Strategy platform exhibit strengths that, according to Mills & Jeanne, are well suited for the performance of any financial analysis application irrespective of how taxing or demanding they are (60). The financial users attain the benefits of financial analysis done using the Micro Strategy platform a through being availed with detailed financial reports.
Usually, users as well as sophisticated readers of financial statements have a tendency of making general assumptions that the data contained in those statements have been presented on a purely objective basis. In reality, this is indeed not the case. Most of the details presented through financial reports are judgmental in nature (Mills & Jeanne 60).
Company Profiles
Al Futtaim Group
Al Futtaim Group is considered to be among the biggest organizations in the whole of the Middle East. The Group is constituted of several divisions among them construction, automobile as well as real estates among other divisions. It is one of the main financially stable and as such, it reports high returns after tax. It has a massive number of investors.
Galadari Group
This Group was established in the early 1960s. It has several divisions ranging from newspapers to automobiles, travel and tourism to ice-cream manufacturing and many more dealings. Just like Al Futtaim Group, Galadari Group is largely attributed to financial stability as well as large capital base exhibited by the number of shareholders of the company (Mills & Jeanne 61).
Thesis Statement
With reference to Al Futtaim Group and Galadari Group, this paper aims at explaining their adopted business models or strategies. Further, the paper will identify the most vital areas of accounting judgments contained in the financial statements of each of the two companies. In addition to this, DOL as well as the DFL for each company over the four years will be calculated through the help of tables and, therefore, making a financial forecast for the year 2012. The paper will also establish appropriate ratios in order to measure and analyze the financial performances of the two companies. The last part of this paper will involve drawing comparisons of the performance of the two Companies and thereby providing an analysis for stakeholders advising them whether they ought to maintain, reduce or even increase their shares in the businesses.
Discussion
The adopted business models
Foremost, before embarking on the establishment of the adopted business models, it is rational to understand first what the term business model means. As such, a business model refers to a working description that tends to include the generalized details pertaining to the operations of a particular business. The identifiable components constituted by a business model are essential as they address all the business functions (Ayres 27).
Al Futtaim Group
The Al Futtaim group has adopted the Recurring Revenue Model. The Group aims at securing the clients on a long-term contract. The reason why it does this is to ensure that the customers consume the company’s product or even the services it offers in an efficient manner going into the future. According to a recent statement given by the group’s managing director, the company acknowledges the fact that the cost of acquiring a customer can be extremely high at times. Therefore, he asserted that the company aims at retaining the customers (Shapiro 245).
Galadari Group
Contrary to Al Futtain group, Galadari group has adopted the fermium business model. In this kind of business model, the organizations sacrifices something it places a high value on to the customer in exchange with the customer details and from this point, the business can market itself to that customer with a vision of establishing and building a relationship. This ensures that the client will buy the services or product that the organization offers, going into the future. Since Galadari group is largely associated with service business, the business model is ideal. This is because; the model is best suited for service business rather than product business. According to the group director in a recent internet article, he indicated that the group recognizes the fact that the lifetime value of a client, who is average in status, is usually high (Ayres 28). He added that the lifetime value of such a customer is escalating with the advent in technology, especially the establishment of social sites especially Facebook and Twitter. This group operates in such a way that the marginal cost associated with the attendance of an additional customer is equal to zero or nears zero. This is a clear implication that the core free offering is taken as a gateway to the paid up service.
Noteworthy areas of accounting judgments contained in the financial statements of each of the two companies.
In general, with reference to the two companies’ it is evident that there are various critical areas of accounting judgments.
The underlying performance of the business
In the financial statements of these companies, the underlying performance of the business has been presented in an effort towards providing a more useful, in addition to, essential comparison with regard to both business trend as well as performances (Barber, Reuven, Maureen & Brett 531).
Provisions involving landfills and environmental restorations
In the financial reports of both companies, the after care as well as restoration provisions judgments have been adequately recognized. As such, they have been taken in on the net present value of the estimated expenditure, which is being perceived as will be incurred in the future and which is required to settle the after care as well as restoration obligations associated with the groups. In the financial reports, this judgment has also been seen by the application of discount in an effort towards recognizing the time value of money. Further, this discount is unwound over the stipulated period of the provisions (Matt 107).
Borrowing cost capitalization
It is also evident that both groups make capitalizations of material borrowing costs, which can be said to be directly associated with constructions of assets, which are used for qualifying purposes. In both company’s balance sheets, only those assets, which are in the course of construction in the ventures, which are owned jointly, for construction of waste plants energy meet the capitalization criteria with regard to related borrowing costs (Barber, Reuven, Maureen & Brett 543).
Obligations associated with retirement benefits
Both groups are identified as operating defined benefit pension schemes. In these schemes, there are actuarial valuations, which are carried out and as such, the Group’s trustees determine them at three-year interval (Ayres 29).
Calculating DOL and DFL of the two Groups
The degree of Leverage presents in an organization and as such, it is usually calculated with several indexes acting as bases. Some of the Common Indexes used include Degree of Operating Leverage (DOL), Degree of financial Leverage (DFL), in addition to, the Degree of Total Leverage.
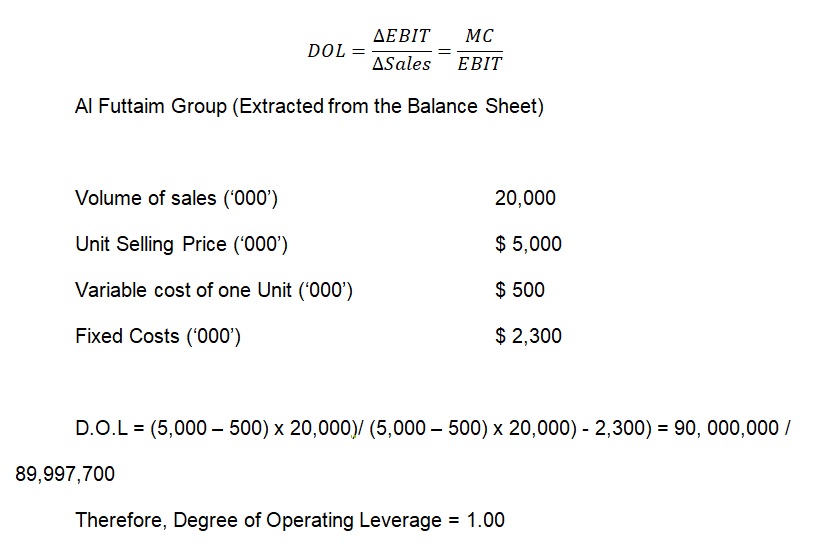
The percentage change in EBIT divided by the percentage change in sales is what financial analysts commonly refer to as Degree of operating Leverage (DOL). Literally, it is a sensitive measure to EBIT to changes in sales arising out of changes occurring about operating expenses.
The formula used to calculate Degree of Operating Leverage is represented as.
Implication
This is a relatively low Degree of Operating Leverage. The implication of this is that this company has a relatively low proportion of fixed costs as compared to the total costs that the firm incurs. This, in turn, means that a considerable increase in the company’s sales revenue will result to a decreasing net income (Barber, Reuven, Maureen & Brett 545).
Degree of Financial Leverage
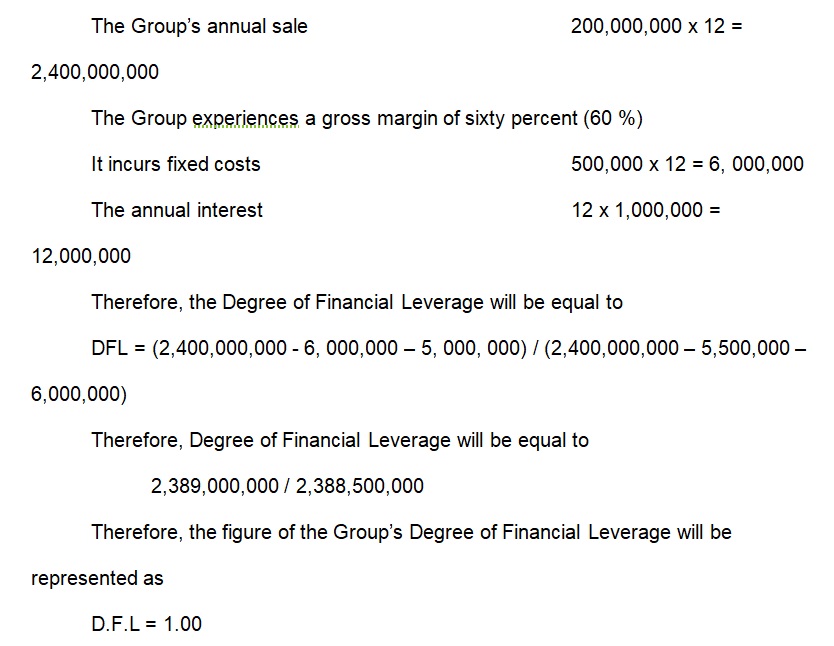
This is a term used by financial analysts to refer to the leverage ratio used to summarize the effect that a certain amount, which is largely attributable to financial leverage, has on an organization’s Earning Per Share. Usually, financial leverage utilizes the fixed costs to finance the organization. Further, it includes higher expenses and as such, these usually come before interest as well as tax, that is, EBIT. According to a majority of financial researches, it is indicated that a higher degree of financial leverage indicates that the Earnings Per Share is more volatile, all other earnings held constant (Hirt, Block & Danielsen 45).
Degree of financial Leverage is calculated using the following formula.
![]()
Degree of Financial Leverage of Al Futtaim Group
Implication
This is a relatively low degree of financial leverage and as such, it means that the company does not indulge itself much into loans or credit. It means that the Group has a larger base of resources through which it can sustain its operations (Brigham & Houston 75).
Galadari Group
Degree of Operating Leverage
Volume of sales (‘000’) 5,000
Unit Selling Price (‘00’) $ 10
Variable cost of one Unit (‘00’) $ 6
Fixed Costs (‘00’) $ 12,000
Therefore, from the above information, the degree of Operating Leverage of Al Futaim Group is
DOL = (10,000- 6,000) X 5, 000) / (((10,000– 6,000) X 5, 000) – 12,000 = 2.5
Implication
This is a relatively high Degree of Operating Leverage. The implication of this is that this company has a relatively high proportion of fixed costs as compared to the total costs that the firm incurs. This, in turn, means that a considerable increase in the company’s sales revenue will result to an increasing net income (Barber, Reuven, Maureen & Brett 563).
Degree of Financial Leverage
The Group’s annual sale 5,000,000 x 12 = 60,000,000
The Group experiences a gross margin of Thirty percent (300 %)
It incurs fixed costs 12,000 x 12 = 144, 000
The annual interest 12 x 100,000 = 1, 2000,000
Therefore, the Degree of Financial Leverage will be equal to
DFL = (60,000,000- 144, 000 – 5, 000, 000) / (2,400,000,000 – 5,500,000 – 6,000,000)
Therefore, Degree of Financial Leverage will be equal to 2,389,000,000 / 2,388,500,000
Therefore, the figure of the Group’s Degree of Financial Leverage will be represented as
D.F.L = 1.00
Implication
Just like the Al Futtaim Group, Galadari group has a relatively low Degree of Leverage and, therefore, it means that the company does not indulge itself much into loans or credit. It means that it has a larger base of resources through which it can sustain its operations (Krishna, Victor & Paul 9).
Measuring and analyzing operating financial performance of the two businesses
Profitability
In order to measure profitability of an organization, Net Profit Ratio is used. As such, the net profit ratio is described as the ratio of an organization’s profit, usually after tax, to net sales. The net profit ratio is constituted of two basic components, which includes; net profits, in addition to, sales. According to financ9ial analysts, non-operating expenses as well as incomes does not any significant role in measuring profitability and, therefore, they are overlooked in this operation. To be precise, the non-operating incomes and expenses occur due to such aspects as engaging in investments outside the business, profits or losses realized after selling assets that are fixed, among others (Krishna, Victor & Paul 10).
The formula used to measure profitability is Net Profit Ratio = (Net profit / Net sales) × 100
Al Futtaim group
Sales in thousands $ 20,000
Sales returns $ 2,000
Net profit $8,000
Net sales = (20,000 – 2,000) = 18,000
Net Profit Ratio = [(8,000 / 18,000) × 100] = 44 %
Implication
This ratio is a clear indication that the company’s overall profitability is viable and as such, it is worthwhile and rational to invest in the company. The ratio also signifies that Al Futtaim Group has the capacity to face any prevailing economic conditions, which include low demand, in addition to, price competition, among others in an effective manner. Another important implication of this ratio is that the company has the ability to attain healthy returns on investments.
Liquidity Ratio
Liquidity of an organization is usually measured using the liquidity ratio. Some financial analysts refer to is as the acid test or quick ratio. Whichever is used, it refers to the same thing (Shapiro 106).
Liquidity ratio is constituted of two principal elements, which include liquid assets and liquid liabilities. Examples of liquid assets include sundry debtors, cash, bank and market securities among others. To be precise, the two components are represented as current assets minus stock, in addition to, expenses, which have been prepaid such as rent. Inventories are not liquid assets owing to the fact that they are not readily convertible to cash without undergoing a loss of value. This implies that prepaid expenses are not part of liquid assets since there is no expectation that they will be converted into cash (Krishna, Victor & Paul 15).
Just like liquid assets, liquid liabilities refer to those liabilities that are current. They include such things as short-term advances and outstanding expenses, among other current liabilities.
The formula for calculating liquidity ratio or acid test is represented as
[Liquid Ratio = Liquid Assets / Current Liabilities]
From the balance sheet of Al Futtaim Group, the following has been extracted to calculate the liquidity ratio.
Cash in ‘000’ 180,000
Debtors 1,420,000
Inventory 1,800,000
Bills Payable 270,000
Creditors 500,000
Accrued Expenses 150,000
Tax Payable 750,000
Therefore, Liquid Assets = 180,000 + 1,420,000 = 1,600,000
Current Liabilities = 270,000 + 500,000 + 150.000 + 750,000 = 1,670,000
Liquid Ratio = 1,600,000 / 1,670,000 = 0.958: 1
Implication
Taking into consideration that the viable liquidity ratio that can be identified as satisfactory is 1:1, the above ratio of Al Futtaim Group can be said to be exhibiting a firm that is in a severe liquidity position. To elaborate this further, it means that the inventories of the company are not liquid enough.
Galadari’s Net Profit Ratio
Net Profit Ratio = (Net profit / Net sales) × 100
Sales in thousands $ 5,000
Sales returns $ 500
Net profit $2,000
Net sales = (5,000 – 500) = 4,500
Net Profit Ratio = [(2,000 / 4,500) × 100] = 25 %
Implication
This implies the company’s overall profitability is viable. Therefore, it is worth investing in the company. The ratio also signifies that Galadari Group has the capacity to face any prevailing economic conditions, which includes low demand, in addition to, price competition effectively. Another important implication of this ratio is that the company has the ability to attain healthy returns on investments, just like the Al Futtaim Group (Krishna, Victor & Paul 16).
Galadari Group’s Liquidity
Cash in ‘000’ 40,000
Debtors 820,000
Inventory 1,200,000
Bills Payable 60,000
Creditors 100,000
Accrued Expenses 20,000
Tax Payable 47,000
Therefore, Liquid Assets = 40,000+ 820,000 = 860,000
Current Liabilities = 60,000 + 100,000 + 20.000 + 47,000 = 227,000
Liquid Ratio = 860,000 / 227,000 = 7: 3
Implication
Considering the above ratio, it is evidently clear that Galadari Group is satisfactory. This implies that the group is in a desirable liquidity position. However, this may not be the case if it follows that the debtors are not readily realizable. Since the company has to inject in some cash to cater for these illiquid debtors.
Comparing the performance of the two companies
Regarding the performance of both Al Futtaim and Galadari groups, it is clear that there is a similarity. As such, both companies have shown that they are viable companies to invest due to the healthy nature of the pro-fit margin exhibited. However, basing on the liquidity ratio, a major difference is depicted. While Al Futtaim exhibits a less liquidity ratio, Gadalari group has a high one meaning that it is more liquid as compared to the two (Altman 597).
Conclusion
From this analysis, it is evidently clear that business models differ significantly. For instance, the Al Futtaim group adopts Recurring Revenue Model where it aims at securing the clients on a long-term contract. The reason why it does this is to ensure that the customers consume the company’s product or even the services it offers in an efficient manner going into the future. On the other hand, the Galadari Group adopts freemium business model. In this model, the organizations sacrifices something it places a high value on to the customer in exchange with the customer details, and from this point, the business can market itself to that customer with a vision of establishing, and building a relationship. This ensures that the client will buy the services or product that the organization offers, going into the future. According to the analysis above, it is evident that the adopted business model has the capability of delivering the desired results. In addition to this, financial analysis of the different business models results to similar inferences. However, there are slight differences that do arise.
The analysis also identified that financial analysis is subject to judgments. Some of the judgments made include; borrowing cost capitalization, provisions involving landfills and environmental restorations, the underlying performance of the business, in addition to, obligations associated with retirement benefits.
Further, the analysis found out that a company’s performance could be determined by establishing such elements as Degree of Operating Leverages, Degree of Financial Leverages, Liquidity ration as well as profitability ratios. Investors are supposed to base their investment decisions on these aspects in order to establish whether they should reduce, maintain or even increase their investments in a particular company (Altman 609).
Works Cited
Altman, Edwards. “Financial Ratios, Discriminate Analysis and the Prediction of Corporate Bankruptcy.” Journal of Finance 2.3 (2008): 589–609: Print.
Ayres, Frances. “Perceptions of Earnings Quality: What Managers Need to Know.” Management Accounting 3.2 (1994): 27–29. Print.
Barber, Brown, Reuven Lehavy, Maureen McNichols & Brett Trueman, “Can Investors Profit from the Prophets? Security Analyst Recommendations and Stock Returns.” Journal of Finance 66:2 (2001): 531–563. Print.
Brigham, Edwards & Houston James. Fundamentals of Financial Management, Belmont, CA: Cengage Learning, 2004. Print.
Hirt, Geoffrey, Block, Stanley & Danielsen, Bartley. Corporate Financial Foundations. Global Edition, London, UK: McGraw-Hill Irwin, 2011&. Print.
Matt, Davis. Computations in Accounting, London, UK: Prentice-Hal, 2002. Print.
Krishna Paul, Victor, Lambert & Paul, Healy. “Introduction to Business Analysis and Valuation.” Journal of Finance 6.2 (2001): 9-16. Print.
Mills, John & Jeanne, Yamamura. “The Power of Cash Flow Ratios.” Journal of Accountancy 6.8 (1998): 53–61. Print.
Shapiro, Andrew. Multinational Financial Management, London, UK: John Wiley and Sons, 2003. Print.
Shapiro, Andrew. Foundations of Multinational Financial Management, London, UK: Wiley and Sons, 2002. Print.