Introduction
The main aim of the study is to try to understand the performance of Saudi British bank and to understand the process of evaluating a company. The evaluation of this company will assist investors and other students to make informed decisions about the company. This company has built themselves their fine services and the quality of service they offer to the public. After the analysis I will be able to have the working of financial analysis model that is employed by financial consultants in advising companies on growth.
It will also assist me to have proper information on how financial statements are prepared and they are presented to the stakeholders. This report mainly focused on breakeven analysis, ratio analysis, performance in the market and other historical data which gives the history of company and therefore it will assist any person comes up with strategies of analyzing the company.
Methodology and sources of data
In the analysis of this company, various information and data were obtained from the company website and ratio analysis was carried out and all figures were approximated to two decimal points. Break even analysis has been carried out using regression and trial and error method. Degree of operating leverage has been carried out to determine how the operations of the company are leveraged. Financial statements for the year 06 and 07 have been obtained and they have been used in carrying out both quantitative analysis of the report.
Two years of financial data from Saudi British Bank were obtained through the company website thus Finance reports. The balance sheet and the income statement from 2006 through 2007 were analyzed.
Common Size Balance Sheet
Balance Sheet Items (in % Terms)
The analysis of the above common size balance sheet shows some issues that should be considered in carrying out performance evaluation of Saudi British Bank. Cash and equivalent with SAMA have reduced from 16% to 10%. Customer deposits had reduced and other factors seem to be changing.
Break even analysis
To calculate break even point, costs must be classified according to their behavior. They must be classified as fixed cost, variable cost and total cost. The breakeven point(BEP) is the quality of output sold at which total revenues equal total costs – that is, the quantity of output sold at which the operating income is $0. Managers are interested in the breakeven point because they want to avoid operating losses. The breakeven point tells them how much output they must sell to avoid a loss.
Note that “ the total expenses” line is the same under either method. The graph that plots fixed expenses above the variable expenses is proffered by many accountants because it emphasizes the contribution margin motion. Both sales and variable cost lines start at the origin; the vertical distance between them is the contribution margin. When operations are below the break even point, the vertical distance between the sales line and the variable cost line measures the total amount of the contribution that sales volume is making to fixed expenses.
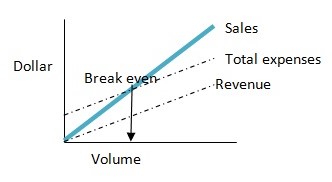
Figure shows the complete break even chart. The breakeven point is the point where the total-sales line and total –expense line and total-expense line intersect. But note further that this graph shows the profit or loss outlook for a wide range of volume. The confidence we place in any particular breakeven chart is naturally a consequence of the relative accuracy of the cost-volume-profit relationships depicted. Using the formula
At Break-even, the cost of production is equivalent to the sales revenue. In this case the fixed costs will be 100,000, 20,000 and 24,000 for apportioned rent and rates, fixed managers’ salary and apportioned depreciation respectively. The unit revenue is 1760 while unit variable costs are materials 2 units of materials x 250 = 500 and labor costs per unit is 2 employees X 16 hours X 30 = 960 per unit. Therefore, breakeven analysis will be as
When they want to sell at 1760 the break-even will be as follows:
Breakeven point = fixed cost
Contribution margin per unit
Fixed cost = 100,000+20,000+24000= 144,000
Contribution per unit = selling price- variable cost
Selling price =1760
Variable cost per unit = 500+960= 1460
Contribution = 1760-1460= 300
Therefore breakeven point = 144,000
300
= 480 units
Degree of leverage
The degree of operating leverage for the company will be calculated as percentage change before interest and tax and percentage change in sales. Percentage change in sales was 17.65% from year 2006 to 2007. The percentage change in earnings before interest and tax was 12.06% from year 2006 to 2007. Therefore the degree of operating leverage is calculated as follows”
- DOL = PERCENTAGE CHANGE IN EBIT = 12.06% = 0.68
- PERCENTAGE CHANGE IN SALES 17.65%
Financial Ration and Trend Analysis
Liquidity Ratio
On financial stability, the liquidity ratio indicates that the firm was financially stable only in 2006. This ratio was 1.22:1. This means that for every 1 of current liability there are only 1.22 of current liquid assets. The recommended ratio is 2:1 i.e. current assets should be twice as much as current liabilities. But in this case, they are less than twice the current liabilities. Through the years 2006, and 2007, its financial stability declines as shown by the ratios 1.22:1, and 1.19:1 respectively.
The cash from operations ratio also declines from 13% in 2006 to 1.72% in 2007. The ratio indicates how able the firm is in meeting its financial obligations from the most liquid assets. It is still a show that the company is not stable financially since it comes down. This ratio is an indication of the ability of the firm in meeting its financial obligation from its financial records.
Activity Ratios
The activity with regard to debtors (accounts receivable) shows a haphazard performance with improvements being witnessed in the year 2007. The rate at which the company converts debtors/receivable into cash is less than the industrial. As shown by the account receivable turnover, the debtors’ payments frequency was 0.08 times for 2007 and 0.07 for year 2006. It means that the efficiency with which the firm is utilizing its debtors to generate cash is improving.
The assets turnover is 0.06 times for 2006 which is lower than 2007 figure of 0.05 times. It measures the turnover on assets of most businesses ability of asset to generate high returns create substantial assets for each dollar. It measures how a dollar invested in assets is returned. In this case every currency invested the company gets 0.05 times of assets in 2007.
Profitability Ratios
Saudi British Bank has been focusing a lot on increasing revenue which can be seen with the increase over the two years. However profits are not increasing at all. This can be seen in exhibit above where the gross profit line is decreasing. The costs associated with the revenues are a lot more that is the cost of revenue are increasing in the same line as the revenue; therefore the objective of increasing revenue to increase profits has not been achieved. Hence this fact should be taken into consideration when developing future strategies as more concern should be given on controlling the costs and increasing efficiency in the quests of making more profits. Return for equity is another thing that is lucrative for shareholders which will be the basis of increasing the share price unless there is some speculation or external factor which will significantly restrict the increase in share price.
Growth
The most concerning issue is the decline in the share price. That’s why P/E ratio has significantly dropped. It seems bank will continue to increase its fees but unless it doesn’t control the costs the gross profit will not increase. Return for equity is another thing that is lucrative for shareholders which will be the basis of increasing the share price unless there is some speculation or external factor which will significantly restrict the increase in share price. Therefore shareholders should fear further drop in share price as it’s close to booking value. In the next two years bank will probably prove to be profitable and a good source of capital gain for the shareholders but keeping the current trend in mind, the share price could further drop below its book value so shareholders should buy the stocks of Starbucks as its likely that the stock price will increase, sooner or later.
Earnings per share show how the company makes profit as per each share. Earnings per share are in two forms basic and diluted. The shareholders always consider earnings per share, when making decisions to buy the shares of the company. This trend is worrying bearing in mind that profitability was improving.
Capital Investment and Financing
Analysis of Capital Expenditure
The company has undertaken some capital projects including opening new branch.
The average rate of return on investment
The WACC of Saudi bank is 21.27 (Return on Investment, ROI), the beta is 1.19 and the return on investment is using CAPM is 14%, assuming that industry ROI is the risk free return and sector ROI is the market.
Debt ratios
There is also high debt to total assets ratio is 87.82% in 2006 while in 2007 is 89.39%. The debt ratio is an indicator of the percentage of assets that have been financed through borrowed capital. It means that in 2007 89.39% of the total assets were financed through debt. It means the firm might be financing its assets using external sources. It measures how much of the debt is available in financing debt capital. In this case for every.8936 SAR of creditors there is only 1 SAR from total assets. This is very dangerous for a company.
Dividend policy
The has paid out dividend to the shareholders for the last two years. The dividends paid for the two years were similar. This means that this company has a policy of paying dividends regardless of amount of profits made.
Evaluation of stock price performance in the market
Par value: The par value of the shares of this company, was SAR 10 each.
Book value: The book value of the shares of this company was 25.08 which is calculated as follows;
Market value: The market value per share as at on the 14th January 2009 was SAR 62 this means the market is overvaluing the shares.
EPS: The company earnings per share as at 2006, and 2007 was 8.11 and 6.95 respectively.
DPS: The current dividends issued to the company shareholders were 2.35 per share at the time with a dividend yield of 3.79 percent.
P/E: The price earning ratio of the company currently stands at 8.21 and the decrease is associated with the financial crisis currently affecting the world.
Summary and Conclusions
To achieve better future results, better or close to industrial average, the firm needs to cut down its operating expenses. This would considerably improve the profitability ratios. They also have to review their policy on capital management and keep optimal levels of various items of current assets. This would improve the firm’s liquidity position. To improve the return on owner’s equity ratio, the management should invest in viable projects that would yield positive NPV’s. This has the effect of maximizing their wealth. To improve on the financial ratios, the firm would ensure that it has more liquid assets and also resort to internal sources of finance as opposed to external ones.
References
Davis, H.Z. and Y.C Peles, Measuring Equilibrating Forces Of Financial Ratios, The Accounting Review (1993)
Henderson, S., Peirson, G. and Herbohn, K., (2008), Issues in Financial Accounting, 13th edition, Frenchs Forest: Pearson Education Australia.
Largay, James A III and Clyde P. Stickney, cash flows, ratio analysis and the W.T Grant Bankruptcy, Financial Analysis Journal (1980)