Introduction
A performance evaluation has been undertaken in this write up of Saudi Industrial Investment Group (SIIG), a joint stock company in the kingdom of Saudi Arabia. The analysis is based on the consolidated financial statements framed by the company and its affiliates Saudi Chevron Phillips Company and Jubail Chevron Phillips Company.
Purpose of the study
The study has been undertaken to make a comparative analysis of the performance over the years of the company since 2006. This is a financial analysis to evaluate the growth of the company in relative with comparison with earlier years taking into account the changing financial and other circumstances like capital employed and other factors
Methodology and Source of data
The performance analysis is made of the company using four parameters or tools of financial analysis, namely, production and cost analysis, financial ratio indicating trend analysis of performance, capital investment and financing, and market evaluation of stocks of the company. Financial statements consisting of balance sheets, statements of income, statements of cash flows, and statements of changes in shareholders’ equity produced by the company over the years have been used to analyze the performance using the tools and parameters as stated above.
Scope and Limitations
The financial analysis of the performance of the company has been made from the data available in the financial statements since the year 2006. This analysis is purely general financial evaluation and should not be construed as investigation of forensic nature.
Production and Cost Analysis
Product line and underlying technology
The company aims at improving and developing industrial base in private sector particularly petrochemical in Saudi kingdom and opening channels for exports of its products. Accordingly the company started its first project in 1997 with Chevron Phillips Chemical Company under the style of Saudi Phillips Chevron Company at Jubail. The main products of the company are Benzene, Cyclohexane, and Gasoline. Again in 2003 SIIG in joint venture with Chevron Phillips Chemical Company started Jubail Chevron Phillips Company (JCP), wherein production of Styrene and Propylene is undertaken. Another project was started by same partners in 2001 under the name of Jubail Chevron Phillips.
Production Capacity and output volume
The company produces Styrene, Propylene, Benzene, Cyclohexane and Motor Gasoline. It is expected that the new project of the company Jubail Chevron Phillips Company (JCP) would have following capacity to produce Styrene, Propylene, and Motor e total Gasoline:
- Styrene 715 KMT,
- Propylene 150 KMT, and
- Motor Gasoline 300 KMT.
Break-even analysis
‘A break-even analysis is a calculation of how much sale revenue you must create to cover basic fixed costs of doing business. When you are operating at breakeven it is not costing you anything to keep your door open, and when you are over breakeven, you are money.’(Ed Paulson, page253)i It may be noted that information about variable and fixed expenses cannot be completely ascertained from the information provided in financial statements. Accordingly the breakeven is calculated by ascertaining the sales value to meet the total cost as under:

Zakat obligations are not treated as costs but apportionment of profits.
Degree of operating leverage(DOL)
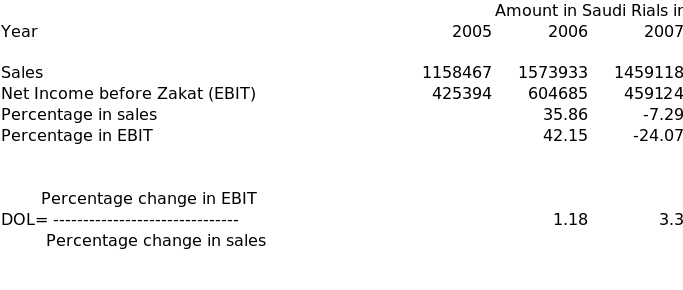
‘The degree of operating leverage (DOL) is the numerical measure of the firm’s operating leverage. Whenever there is percentage change in EBIT (earnings before interest and taxes), resulting from given percentage change in sales, is greater than the percentage change in sales, operating leverage exist. That means as long as DOL is greater than one, there is operating leverage.’(Lawrence J Gitman, page 543)ii Degree of attained operating leverage of SIIG over the years is calculated hereunder:

It will be observed that the degree of operating leverage in 2006 and 2008 was 1.18 and 3.3 respectively, but during the first three quarters of 2008 there is no operating leverage as DOL is less than one. The reason for this is that percentage change in EBIT is lower than percentage change in sales.
Financial Ratio and Trend Analysis
The ratios used for analyzing liquidity, activity, leverage, profitability, and growth trend analyses are calculated hereunder:

Liquidity
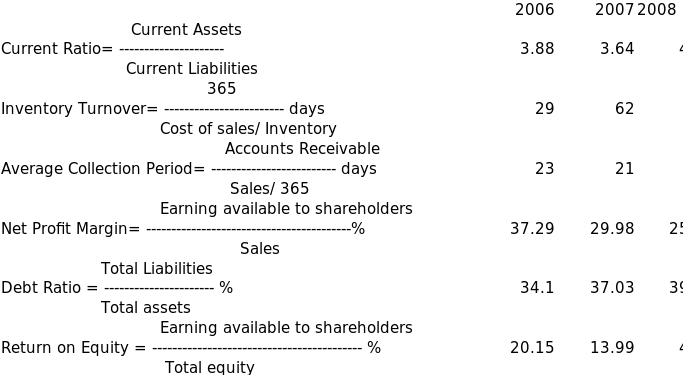
Liquidity of a company is concerned with short term solvency of the company. It is measured through current ratio of the company. Traditionally current ratio of 2: 1 is considered optimum for any type of industry. From the point of view of this standard SIIG is very comfortably placed. Its current ratio for 2006, 2007, and 2008 is 3.8:1, 3.64:1, and 4.29:1respectively. The company is solvent from short term point of view and comfortably in a position to meet its short term obligations when those become due.
Activity
Activity of company is reflected from the speed with which its different accounts are converted into sales or cash inflow. In other words efficiency inactivity of the company is measured from the speed of its conversion period from converting cash to inventory to sales and back inflow to cash. Inventory turnover ratio and average collection period are good indicators of the efficiency inactivity of the company. Inventory turnover indicates average number of days’ sales in inventory.
From this point the position of SIIG has deteriorated from 29 days in 2006 to 62 days in 2007 and alarming 75 days in first three quarters of 2008. The average collection period of SIIG has been fluctuating from 23 days in 2006 to efficient 21 days in 2007. But the average collection period dropped to as low as 79 days probably reflecting the effect of worldwide credit crunch in 2008. Overall SIIG has not performed efficiently and speedily over the period of three years in converting inputs to sales and back to liquidity.
Leverage
Leverage or capital gearing can be judged through debt ratio. Capital leverage indicates how total assets of the company have been financed by debt capital and owned capital. In case of SIIG 34.1% of debt capital was used in 2006 to finance its total assets, and this ratio rose to 37.03% in 2007 and 39.68% at the end of three quarters of 2008. These ratios have remained less than 50% and thus SIIG has been a low geared company where most of equity capital was used to finance its assets.
Profitability
Judging from the point of view of profits after interest and taxation, i.e., net profit, the performance of SIIG has been dismal. Net profits have gone down from 20.15% in 2006 to 13.99% in2007 and mere 4.87% in first three quarters of 2008. The performance is not at all noteworthy and SIIG will have to take concrete steps to improve its profitability.
Growth
There is no doubt that total assets invested in the company has risen from 4420971000 Saudi Rials in 2006 to 8974297000 Saudi Rials by the end of third quarter of 2008 and also the company has remained a low geared company, but continuously decreasing profitability is a greater cause of concern in measuring the growth of the company. It can be said the company has not utilized its assets effectively over the years.
Capital Investment and Financing
Analysis of Capital expenditure
Major capital expenditures have been confined to project under construction and property and equipments. The sources of the funds invested in such long term assets have also been sourced through equities (app 60% in 2008) and rest from debt capital. The company is low geared and not taking advantage of trading in equity. At the same time the company does not have any long term or short term solvency problems.
Average rate of return on investment is calculated hereunder

The rate of return on investment is very dismal all along from 2006 to 2008.
Short term vs. long term sources of finance
Short term assets have mostly been financed through long term sources as only 25.76% in 2006, 27.47% in 2007, and 23.32% in 2008 of current assets have been financed through current liabilities and rest are long term sources. This may be a good move from the point of view of short term insolvency but not a prudent move when some of long term resources have not been invested in income yielding long lived assets. Long term assets have been rightly financed through long term debt capital and equity funds and the firm has a low geared capital structure.
Debt ratio
Debts ratio has been of the company have been calculated above in ratio table. Only 34.1% in 2006, 37.03% in 2007, and 39.68% of total assets have been financed through long term debts. Some of debts have also been used for short term assets financing. However company is low geared from the point of view of capital structure.
New Common Stock Issue
In the year 2008 company raised SAR 2250000000 of fresh issue of shares of SAR 10 each. The fresh equity was raised without premium.
Dividend policy
The company is following a regular cash dividend policy since 2008. It paid dividend of SAR225000000 each in 2007 and first three quarters of 2008.
Sources and uses of funds
Debt capital and equity capital both have been used to finance both long term and short term assets but the contribution of debt capital is less than 50% of total sources.
Cost of capital is the rate of return that company must earn. As the company has raised both debts and equity capital, the cost of capital can be estimated using IRR method discounting on factors like business and financial risks.
Evaluation of Stock Performance in Market
Par value of the shares is SAR 10 per share. Other values and ratios are calculated as under:

In absence of information about market price, P/E ratio cannot be calculated.
Summary and Conclusion
SIIG basic strength lies with its equity funds and other long term debt capital that has financed not only long term assets and part of working capital as well. This has ensured its short term and long term solvency. All projects are not yet working at full capacity and as soon as that will happen the company’s profitability will start showing an upward trend. The company is very strong liquidity wise. The company weakness is not effective utilization of assets and that is the reason its return on investment is getting lower year after year. EPS is dwindling and this may affect the marketability of company’s shares.
It is recommended that company should put all its resources in long term assets ineffective use to increase its revenue. This will solve the profitability problems and increase the value of its shares.
References
- Ed Paulson, The Starting Your Own Business, Alpha Books, 2003, page. 253.
- Lawrence J Gitman, Principles of Managerial Finance, Eleventh Edition, Pearson Education, page 543.
