Business environment
At The Candy Company Inc., they have attained record consumer service scores and their team offered almost everything their consumers wanted. The personnel of the company seriously do deserve a real appreciations and congratulations as they are the ones who have fulfilled all the desires and wants of the consumers. Thus, The Candy Company Inc can establish their business in a nation like India to expand their global market as India boasts to have the second highest population after China.
Operating environment
The Company now sells Candy commodities in more than one state with man outlets. The states where the product is being sold make their stores more creative, increase their contact with their clients, and add severe margin growth. Its brands are accessible around the states and unite with the next generation of customer in a focused and regulated manner. In 2009, the company is prepared for the problems of the economy but focused very evidently on each brand and its customers. The four main areas that Brands will focus on are:
- Strong Cash Flow – They invest in projects with high return whether they are familiarized to growth or savings.
- Administer expenditure and operating framework – They have initiated an incessant improvement procedure which is being rolled-out throughout the business.
- Expand share of the market – Even in a market of recession, they claim to innovate with commodity and celebrate their brands.
- Employ and reward partners – They make sure that their personnel are provided the best treatment.
They are committed to variety and inclusion, sustainability, and helping those who are in need. They have innovated in these fields and promises to continue. Their commitment to constructing shareholder value by erecting a strong and varied consumer-focused enterprise is apparent. Delivering on that commitment in times of recession is confronting. However, the company believes that if they focus on the consumer and keep their eye on business essentials they will thrive in the coming years. Thus, even during the times of recession The Candy Company Inc claims to launch its product in developing country like India.
Long term objectives
Marketing strategy planning aims at matching opportunities to the firm’s resources and its objectives. Successful approaches are initiated when an innovative manager marks an eye-catching market opportunity. Yet, a chance that is striking for one company may not be striking for another. Even if an executive cannot find a ground-breaking opportunity, the company should try to get hold of a competitive advantage to augment its probabilities for profit or continued existence.
Competitive advantage implies that a company has a marketing mix. A competitive advantage may be caused by attempts in different regions taken by the firm, such as, cost decreasing in production, pioneering R&D, more effectual purchasing of required constituents, or financing for a novel allocation facility. Similarly, a well-built sales force, an eminent brand name, or commodity traders may provide it a competitive advantage in chasing an opportunity. An advantage is successful only if it permits the company to offer better-quality value and satisfy consumers better than some contender.
Sometimes a company can attain breakthrough chances and competitive advantage by merely fine-tuning its present marketing mixes or building closer associations with its clients. Other times it may require new facilities, new people in new sections of the world, and completely new means of solving problems. However, every company requires some competitive advantage. Thus, the promotion and success do not entirely depend on providing products at lower prices.
A major objective of marketing is to assure the requirements of some group of clients that the company serves. In broader terms, the company looks for purchasers with requirements that are not being fulfilled as well as they might be. It does not imply that all the probable customers have the identical needs and want to meet their needs in the same manner. There are different kinds of consumers with different traits.
For instance, individual customers often have different requirements than organizations, and individuals with definite attitudes or interests have diverse preferences. Despite many probable differences, there often are subgroups of customers who are identical and could be satisfied with the same marketing strategy. Thus, The Candy Company Inc may try to recognize and comprehend these diverse subgroups with market segmentation.
A marketing mix must satisfy the desires of target clients. However, a company is not expected to acquire a competitive advantage if it just fulfils needs in the same manner as some other company. So, in assessing possible approaches the marketing manager should consider about whether there is a technique to distinguish the marketing mix. Differentiation implies that the marketing mix is different from and better than what is obtainable from a rival. It often requires that the company fine-tunes all of the aspects of its marketing mix to the exact requirements of a idiosyncratic target market. Sometimes the differentiation is based mainly on one significant aspect of the marketing mix say, an enhanced product or rapid delivery. Thus, The Candy Company Inc can produce and bring their commodities into the market of India in an attractive manner so that the other rival firms do not get the opportunity to capture a larger market share. Differentiation is more noticeable to target clients. The marketing strategy and theme should be such that target customers will consider the product to be unique. The product must be alluring enough to meet the demands of the consumers
Financial analysis
The years 2006 and 2007 financial statements have been obtained for analysis in this case..
Common Size Balance Sheet
Balance Sheet Items (in % Terms).
Common Size Income Statement
Margins (% of Sales).
Analysis of common size balance sheet and income statement shows several important factors that need to be considered when analyzing The Candy Company. The cost of goods sold has decreased for the two years translating to increase in gross profit. Operating profit has also increased although operating expenses has increased (Siciliano, 179).
The current assets have increased from 71.80% to 77.03% while the furniture’s, fixtures and equipment have decreased from 56.52% to 47.56%. The current liabilities have also increased approximately 11% and the stockholders’ equity has decreased approximately 5%.
Ratio Analysis
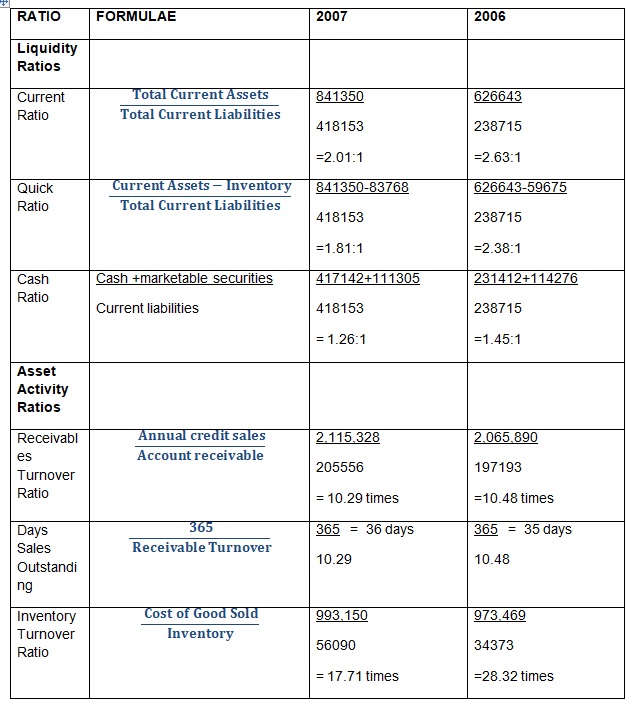
Analysis
Liquidity
The company liquidity position has been analyzed and seen to have decreased for the two years. The current ratio has decreased from 2.63 times in 2006 to 2.01 times year 2007. This decrease is due to increase in current liabilities as shown by common size analysis. The acid test ratio of the company also depicts the same picture. It decreased from 2.38 times to 1.81 in the same period. These ratios show that liquidity reduced substantially during 2006 and 2007. The cash ratio also decreased drastically The reason why these are so low during this year is due high current liabilities. Working capital amount is quite adequate although it has decreased for the past two years. It shows that company is in good position to finance its short term financial needs.
Activity ratios
The turnover ratios give the speed of conversion of current assets into cash. Receivable turnover ratio increased during the past 2 years. It saw its highest turnover during the years 2007 which result in day sales in receivable of 36 days only. In the year 2006 the ratio was 10.49 times which translates to 35 days. Inventory turnover decreased greatly during this period which was as low as 17.71 during year 2007 that is 21 days from 13 days or 28.32 times. It shows that company management efficiency to use current assets decreased i.e. in terms of converting its inventory into sales resulting in higher sales figure during the year 2007.
It shows that company is converting its inventory into receivables and receivable into cash quite efficiently. This operational efficiency of the company is evident as cash provided by operations. The inventory turnover ratio measures how much was sold off, or turned over in the course of one year. The used of total assets also decreased from 2.37 times to 1.94 times for the years 2006 to 2007. It measures the turnover on assets of most businesses ability of asset to generate high returns create substantial assets for each dollar. It measures how a dollar invested in fixed assets is returned. In this case every dollar invested the company gets 1.94 for 2007 and 2.37 for 2006.
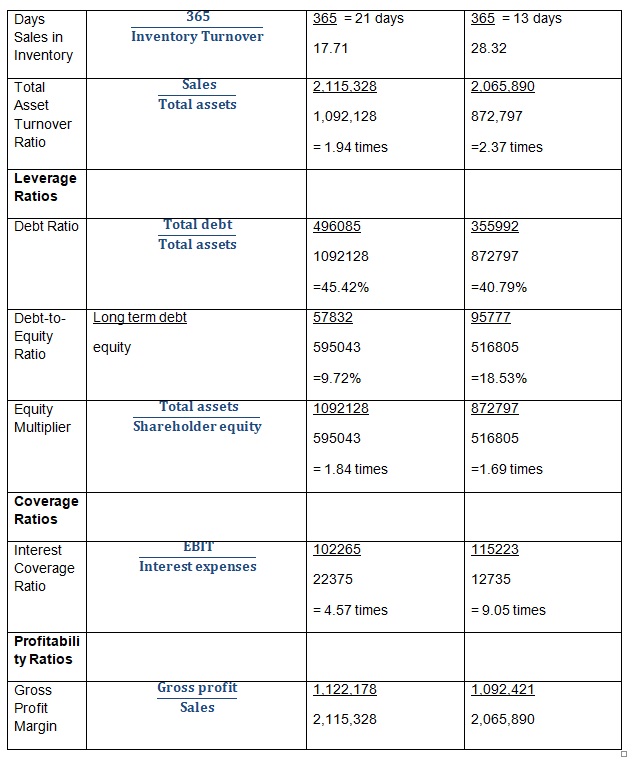
Leverage Ratios
This ratio gives the solvency of the firm. They indicate the extent of non-owner claims on the firm’s profits as well as the firm’s operating capability to meet its obligation. Gearing is the long-term debt to equity ratio which assesses the balance between liabilities and equity in the firm’s long term resource structure. Another is the interest coverage ratio which measures the extent to which earnings cover the interest obligation of the company( Rao, 78).
Capital structure of the company show how much of the company assets are financed by the company through debt and how much from equity. The calculations have shows that company is increasing its reliance on creditor financing steadily. There is also high debt to total assets ratio is 45.42% in the years 2007 while 2006 it is 40.79%. The debt ratio is an indicator of the percentage of assets that have been financed through borrowed capital. It means that in 2007 45.42% of the total assets were financed through debt and is 40.79% in 2006.
It means the firm might be financing its assets using external sources. It measures how much of the debt is available in financing debt capital. The interest coverage ratio has decreased from 18.53% and 9.72%. At the same time company equity financing decreased during the same last 2 years. This decrease in equity finance came mostly from increase in debt capital of the company.
Profitability
From its fiscal years ending 2006 and 2007, the company showed increasing net income figures available to common shareholders. The increase in net income the 2009 net income was amidst an increase in the company’s sales. The increase in profitability was exacerbated by a non-parallel increase in operating expenses and resulted to an increase in operating income.
As to the ability of the company to continue showing profitability in the years to come depends on how fast the world economy will recover from the economic crisis. Another ratio is the turnover ratio which shows to what the extent the company uses its assets to produce revenue.
ROA (Return on Assets) is also used for the same purpose of measuring the overall performance. However to be meaningful to calculate the ROA it should be adjusted for implicit interest which is difficult to estimate and hence makes the process unnecessarily complicated. The figures show that performance is decreasing than from 13.87% to 10.01% of the industry because the activities ratios were lower also.
However one needs to compare its position with the market and also its rival companies to have a clearer picture. The rate of return on Equity or ROE can be taken as a good measure to estimate the firm’s performance, from the shareholders’ point of view. However it fails to measure an overall performance of the firm. The higher this ratio is the better. If ROE is less than the ‘cost of equity’ the firm can be said to be destroying value. In the above statistics it seems that the shareholders’ viewed the firm’s performance to industry is lower.
DuPont analysis
In a DuPont analysis, the expression for ROE is broken up into three parts – profit margin, asset turnover and equity multiplier. The profit margin measures the operating efficiency of the firm concerned, asset turnover measures the asset use efficiency and the equity multiplier throws light on the financial leverage of the company under analysis. This identity helps one to understand where the superior or inferior return comes from.
Conclusion
Therefore the operating efficiency is high and improving and this is influencing the value of ROE. More or less we find that the operating efficiency is responsible for the improvement of returns that is which shows steady progress. In order to achieve better future results, better or close to industrial average, the firm needs to cut down its operating expenses. This would considerably improve the profitability ratios. They also have to review their policy on capital management and keep optimal levels of various items of current assets. This would improve the firm’s liquidity position. In order to improve the return on owner’s equity ratio, the management should invest in viable projects that would yield positive profits.This has the effect of maximizing their wealth (Meigs and Meigs, 125).
Recommendation
The company is the largest candy retailer in its industry in San Francisco , but due to the problems with world economy it is performing poorly, it has been seeing an effect on its sales and profits. The company’s performance in the market and are slowly making this stock an unfavorable one for potential investors. My recommendation for potential investors would be to purchase stocks as profits are improving even though there is financial crisis. I would advise those investors holding the shares to keep looking into this stock until they see a positive change in its market pattern and that would be when I would advise them to sell the stock; before its price increases higher than the average market price. This company is definitely a valuable one that I would not let go of if I owned shares in it (Arnold, 25).
Works Cited
Arnold, Glen. Corporate financial management. Harlow: Financial Times Prentice Hall, 2007. Print.
Meigs, Walter and Meigs Robert, Financial Accounting. New York: McGraw-Hill Book Company, 1970. Print.
Rao, Ramesh. Fundamentals of Financial Management. New York: Macmillan Publishing Company, 1989. print.
Siciliano, Gene. Finance for the Non- Financial Manager. New York: McGraw-Hill, 2003.