Introduction
Purpose of Study
Almarai is a company in food industry. The company was established in 1976. This study is undertaken to evaluate the performance of Almarai Company over the years.
Methodology and source of data
The company is listed with Saudi Stock Exchange (Tadawul). The analysis is based on the financial statements of the company and other data available at the site of the company as well as with Tadawul.
Scope and Limitations
The analysis is restricted to evaluation of the financial performance of the company over the period of last three years. The figures and information analyzed are those available at the site of the company and Tadawul. The evaluation is made under the categories of Production and Cost Analysis, Financial Ratios and Trend Analysis, Capital Investment and Financing, and Evaluation of Stock Price Performance in the Market.
Production and Cost Analysis
Nature of Products and Underlying Technology
Almarai is in food industry and its objective is to achieve leadership in the dairy and related sector in the entire GCC region. For this the company has already set up its infrastructure like farms, procurement and processing divisions, research and development, distribution and supply chain, and other operating divisions.
Breakeven Analysis
Breakeven analysis is also called cost- volume- profit analysis. At break even point the margin created by sales is exactly equal to total costs involved, both fixed and variables. To calculate break even sales the following equation is applicable:
Break even sales = F + I/ 1 – V /P
Where F = Fixed Operating Cost
I = Interest Cost
V = Unit Variable Cost
P = Unit Selling Price
In absence detailed information in the printed financial statements of Almarai, the only way to calculate sales at breakeven point is to add up total cost where sales meet the costs and there are no profit and loss. Therefore breakeven sales for three years have been calculated as under:
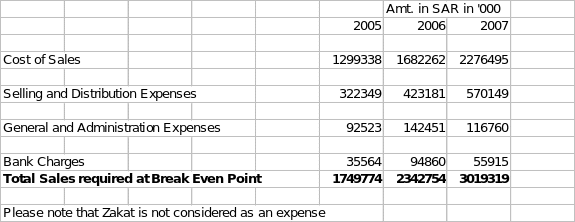
Degree of Operating Leverage
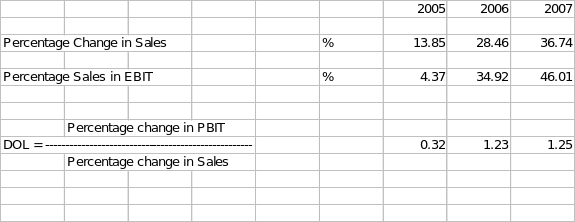
Operating leverage stems from the fixed operating costs. When a firm has fixed operating costs, a change in one percent in sales may result in a change of more or less than one percent in profit before interest and taxes. (PBIT). This is degree of operating leverage (DOL). The DOL is an important consideration in production planning. For example the firm may have the opportunity to modify its cost structure by using labour saving machinery that reduces variable labour cost but increases fixed operating costs. The increase in fixed operating costs and the decrease in variable cost will naturally increase DOL. Degree of operating leverage 9DOL) is measured for three years of Almarai as under:
Financial Ratios and Trend Analysis
Liquidity
‘The liquidity of a firm is measured by its ability to satisfy its short term obligations as they come due. Liquidity refers to the solvency of the firm’s overall financial position – the ease with which it can pay its bills.’(Lawrence J. Gitman, page 58)1
Liquidity position is the nerve of short term solvency of a company. A company is treated as solvent in short run when it can meet its short term obligations when those become due. Current ratio is the most popular yardstick to measure the liquidity of a company. Current ratio of 2: 1 is considered the state when a company is treated as solvent during short period. The current ratio of Almarai for three years is calculated as under:
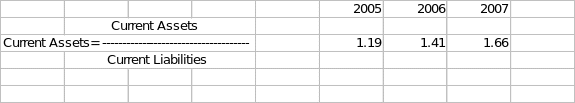
The liquidity position is not comfortable as it is below the standard of 2:1 and the company may find it difficult in meeting its current obligations when those become due.
Activity
‘Activity ratios measure the speed with which various accounts are converted into sales or cash – inflows or outflows’. (Lawrence J. Gitman, page 59)2
Efficiency of a company’s activities can be judged through how fast is its operating and credit cycle to convert cash and other assets like inventories to sales to accounts receivable and back to cash. In this regard inventory turnover and average collection period are calculated hereunder:
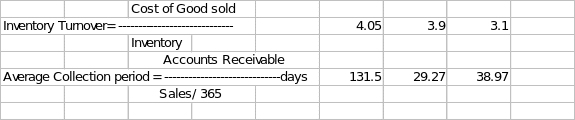
Inventory turnover has been very efficient and effective in turning inventory into sales and also improved over the years. The turnover was 4.05 in 2005 and that improved to 3.9 in 2006 and 3.1 in 2007. Average collection period was very dismal in the year 2005 of 131.5 days in 2005 but improved tremendously to 29.27 days in 2006 and 38.97 days. Though in 2007 average collection period has reduced to 38.97 days in 2007 as compared to 29.27 days in 2006 but the performance has improved when compared to 2005. Accordingly the company’s activities have been efficient during the current years.
Leverage
Leverage of the capital represents the financing structure of the assets of the company. It is also called capital gearing and is calculated based on debt ratio of the company.
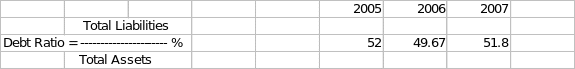
Debt ratio reflects the ratio of debt capital used in financing the total assets of the company. The higher is this ratio higher is the degree of indebtedness of the company and also it has higher financial leverage. They can also be called high geared under that circumstances. In the year Almarai has debt ratio of 52% that reduced to 49.67% and again rose to 51.8%. The company has high financial leverage during 2005 and 2007 when its indebtedness to finance total assets crossed the 50% limit. In the year 2006 the company has low financial leverage.
Profitability
The most common measure to evaluate the profitability is to assess it in relation to sales. That is why gross profit ratio and net profit ratios are most commonly used while assessing the profitability of a company. As the figures of gross profits are available in the published financial statements of Almarai, its profitability is assessed based on gross and net profit ratios calculated as under:
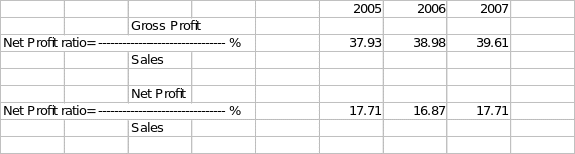
Gross profit is the margin of revenue remaining after meeting cost of goods sold. Almarai has a rising trend in gross profit from 37.93% in 2005 to 38.98% in 2006 and 39.61% in 2007. This shows the control of the company over its cost of sales as it leaves bigger margin to meet expenses, interest and taxes.
Net profit ratio is the margin remaining after meeting expenses, interest, taxes (including Zakat). These are the earnings that are available to shareholders of the company.
Net profit of Almarai is almost constant over the years except for a slight dip in 2006 when net profit ratio decreased to 16.87% from 17.71% in 2005. It again rose to 17.71% in 2007. An analysis can be drawn that expenses of Almarai are rising almost in similar fashion as its sales over the years. Almarai has to control its expenses to an extent to make available higher profits to shareholders, particularly when its gross profits are showing a constant rising trend.
Growth
Growth of a company can be assessed from its rising net assets and revenue. Total assets of Almarai have increased from SAR 2976416000 in 2005 to SAR 3771909000 in 2006 and that rise is 26.73% in relative terms. But in 2007 the rise in total assets are huge by SAR 2563921000 and it is relatively67.97% when compared to total assets of 2006.
The major contribution of increase in total assets has come from equity contributions of SAR 702000000 (including premium), and also debt capital SAR 1408363000, and rest are the contributions of earnings. Though the earnings are also rising but so far the growth of the Almarai is because capital contributions, both equity and debt capital. It appears that company is still involved in strengthening its infrastructures.
Capital Investment and Financing
Analysis of Capital Expenditure
Almarai has made major capital expenditure in the year 2007. The total net addition to non current assets in the year 2007 is SAR (in ‘000) 2015032. This includes an investment of SAR 471074000 to financial assets for the first time and also on property plant and equipment to the tune of SAR 995322000. As we have seen above the company is has slightly high leverage in capital structure and this despite raising of fresh equity capital including premium to the tune of SAR 702000000. Major capital expenditures have been confined to property and equipments.
Average rate of return on investment
Average rate of return is calculated hereunder:
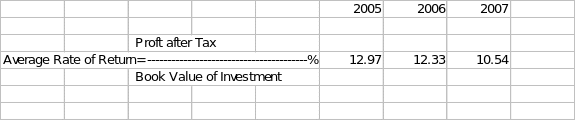
The average rate of return on investment is an investment appraisal criterion. It appears that with increasing investment particularly in 2007, the return on investment is going down. This may be because the actual returns may start only when the projects start working on their potential capacity.
Dividend Policy
So far the company has a policy of making cash dividend payment. The company has declared the following dividends since 2004 in million of SAR is as under:
Year 2004 2005 2006
Dividend in SAR (millions) 300 250 200
It is observed that amount of declaration of dividend is going down but cash dividend has special attraction to investors. There is regular distribution of dividend, and this regular dividend policy is being used as the company is confident about its regular earning capacities. This is a good sign for the investors as the company seems in believing in increasing the wealth of its shareholders.
Source and Uses of Funds
The company is using both long term as well short term sources for financing its assets. During the year 2005 to 2007 total assets of the company were financed as under:
Amt.: SAR in ‘000
Year 2007 2006 2005
Total assets 6335830 3771909 2976416
Equity Capital 3053446 1898031 1428759
Debt Capital 3282384 1873878 1547667
Estimate of the Cost of Capital
Cost of capital is the amount that the company must at least earn. This is the rate of return expected by the existing capital providers. As the company is using both debt capital and equity capital, the cost of capital may be calculated as under:
Cost of debt = Interest agreed to be paid on loans
Cost of equity = required rate of return which should be risk free rate plus risk premium.
In absence of complete information in the financial statements available at the site of company it is not possible to estimate the cost of capital; but is certain that rate of return calculated above is certainly higher than required rate of return or cost of capital. This is because the company is adding to retained earning year after year after providing for dividends.
Evaluation of Stock Price Performance in the Market
Different values are calculated as under:
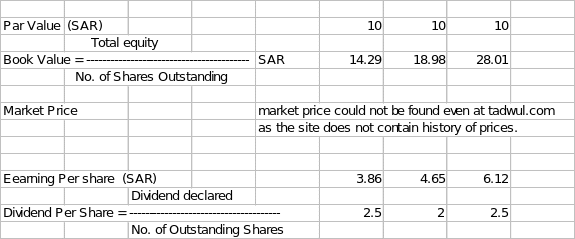
Book value is regularly rising as the company is not declaring heavy dividends and with regular increase in retained earnings, total equity of shareholders is constantly rising. The company is meeting the basic objective of increasing shareholders wealth.
P/E ratio cannot be calculated in absence of availability of history of market price even at tadawul.com.
Summary and Conclusion
The company is investing hugely in long lives assets and this will become the real strength of the company in achieving its objective of attaining leadership in the dairy and related sector in the entire GCC region.
The major weakness of the company is its fragile liquidity position as reflected from above calculated current ratio. Until liquidity position is improved the company will find difficulty in meeting its short term obligations when those become due.
It is recommended that the company should not depend upon debt capital to finance its assets.
References
Lawrence J. Gitman, Principles of Managerial Finance, Pearson Education 2006, page 58.
Ibid, page 59.