Company profile
Union National Bank is one of the leading banks in the United Arab Emirates. It is a locally based bank headquartered in Abu Dhabi. The chairman of the board of directors of the bank is H.H. Sheikh Nahayan Mabarak Al Nahayan. He is the Minister of Education and Scientific Research. The board comprises seven other directors. The Chief Executive Officer of the bank is Mohammed Nasr Abdeen. The Chief Executive Officer has 14 board relationships with other companies. He has won several awards including the CEO Middle East – 2010 Awards, banking category. Satya Dayanand is the Senior Vice President and also the Head of Strategic Planning and Financial Control Division. The top management of the bank is made up of Abdullah Al Rashedi who is the Head of Resourcing and Emiratization Division and Oscar Albuquerque who is the Head of Audit Division (Union National Bank, 2012a).
Union National Bank was founded in 1982 as a Public Joint Stock Company. The bank offers a “variety of products and services, addressing needs ranging from basic requirements of individuals to the more complex requirements of corporate entities” (Union National Bank, 2012a). Basically, the bank offers banking and brokerage services. It draws deposits and offers retail and commercial banking services. Specifically, the Bank offers “consumer, agricultural, trade finance, corporate, and small business loans, securities brokerage services, and custody services, and sponsors Visa credit cards” (Union National Bank, 2012a).
Union National Bank trades in the Abu Dhabi Stock Exchange market. The ticker symbol for the company is UNB: UH. It trades in the home currency, that is, Arab Emirates Dollar (AED). Currently, the shares trade at AED3.02 per share. The market volume of the shares traded is 162,388 (Union National Bank, 2012b).
Branches and subsidiaries
The Bank owns 59 branches across the nation and 36 other subsidiaries in Egypt and other parts of Abu Dhabi. In addition, it owns about 150 ATM outlets. The table below summarizes the subsidiaries of the bank and the percentage of ownership.
Source – Union National Bank, 2012b
Union Brokerage Company (UBC) is a leading brokerage firm in the United Arab Emirates. It is headquartered in Khalidiya, Abu Dhabi. Al Wifaq Finance Company was set up to offer “Sharia Compliant financial, commercial and investing services to both organizations and individuals in compliance with the rules and principles of the Islamic Law” (Union National Bank, 2012a). The bank has a massive presence in Egypt. It has opened several branches in Egypt. This came about after the acquisition of Alexandria Commercial and Maritime Bank.
Financial summary
In 2011, the bank had a total operating income amounting to AED 2,837,805 (US 772,612). This was up from AED 2,554,826 (US 695,670) in 2010. A large proportion of sales emanated from Islamic banking. The operating expenses comprise staff cost, depreciation, and other operating expenses. In 2011, the total operating expenses were AED 728,708 (USD 198,396) up from AED 714,975 (USD 194,657) in 2010. The operating profit of the Bank was AED 2,109,097 (USD 674,216) in 2011 up from AED 1,839,851 (USD 500, 913) in 2010. The net profit for the year of the bank after tax was AED 1,500,365 (USD 408,485) in 2011 up from AED 1,350, 046 (USD 367, 559) in 2010. The basic and diluted earnings per share were AED 0.56 (US$ 0.15) in 2011 and AED 0.50 (US$ 0.14) in 2010 (Union National Bank, 2012b).
The total assets of the Bank were AED 82,468,800 (USD 22,452,709) in 2011. This was an improvement from AED 81,779,759 (USD 22,265,113) earned in 2010. The total assets of the Bank are made up of cash and balance with the central bank, due from banks loans and advances, investment, investment property, plant and equipment, and goodwill. The liabilities of the bank comprise of customers’ deposits, due to banks, medium-term borrowing, and subordinated loans. The total liabilities amounted to AED 69, 400, 959 (USD 18 894,898) in 2011 up from AED18, 894, 898 (USD 19, 016, 842) in 2010. The equity of the bank comprises share capital, legal reserve, general reserve, retained earnings, foreign currency translation reserve, cumulative changes in fair value, and tier one capital. The total equity of the company totaled AED 13,067,841 (USD 3,557,811) in 2011. This was an improvement from AED 11,930,899 (USD 3,248,271) in 2010. The bank employs over 1,000 people in all its outlets (Union National Bank, 2012b).
Competitors
Banking is a competitive industry. To be on top of the competition, a bank needs to offer alluring products that suit the needs of the target market segment. In addition, a bank needs to offer world-class customer service. This helps in attracting and retaining customers. Union National Bank operates in the United Arab Emirates. Its top competitors in the United Arab Emirates are the National Bank of Dubai, First Gulf Bank, National Bank of Fujairah, National Bank of Abu Dhabi, Abu Dhabi Commercial Bank P.J.S.C, and First Gulf Bank. The top competitor of Union National Bank is the Emirates National Bank of Dubai. Emirates National Bank of Dubai is the biggest banking group in the United Arab Emirates. The Group is made up of six companies and eight subsidiaries. The group has a presence in eight countries such as the United Kingdom, Jersey, India, and Iran. The Group has over 8,000 employees. As of 31 December 2009, the asset base of the Group amounted to AED 281.6 billion. The amount is about 3.5 times the asset base of Union National Bank. Competition is healthy since it guarantees customers quality products and services. It also regulates prices.
Performance of shares of Union National Bank
Earnings per share are the total of earnings ascribed to the shareholders. It is computed by taking the total earnings of the bank divided by the total number of shares of the bank. The Price-earnings ratio shows the relationship between the price of the shares and the earnings per share. Dividend yield shows the relationship between the dividend paid per share and the share price.
From the table, the earnings per share, dividend yield, and price-earnings ratio are increasing over the three years. This shows growth in the performance of the Bank. Besides, it also indicates that the shareholders’ funds are used efficiently to generate profits hence high returns. When compared with the performance of the competitor, Union National Bank performs better than the National Bank of Dubai.
The market price of the stock
Market prices of the stock are the prevailing share prices in the stock market. Historical prices of the shares can be analyzed over time to monitor performance. Data for daily share prices are selected for the past 3years. The values are in US dollars. Workbook on the excel attachment shows the historical share prices and a graphical representation of the daily share prices for the past three years. From the graph drawn, it is clear that the share prices of the Bank had an upward trend over the three years.
Return on assets and return on equity
Return on assets is the ratio of net income and total assets. It shows the efficiency in the use of total assets to generate income. On the other hand, return on equity is the ratio of net income and total shareholder’s equity. The table below shows a summary of the return on assets and return on equity for three years.
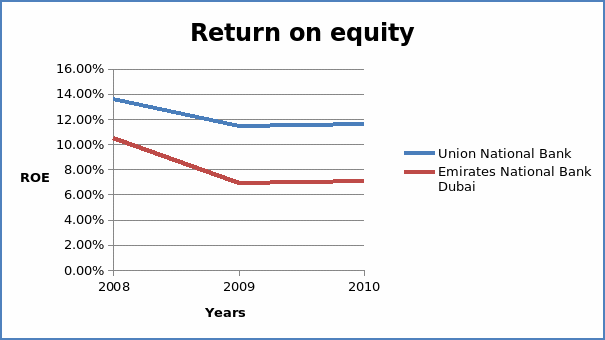
The graph of return of equity for the two banks is shown in the graph below.

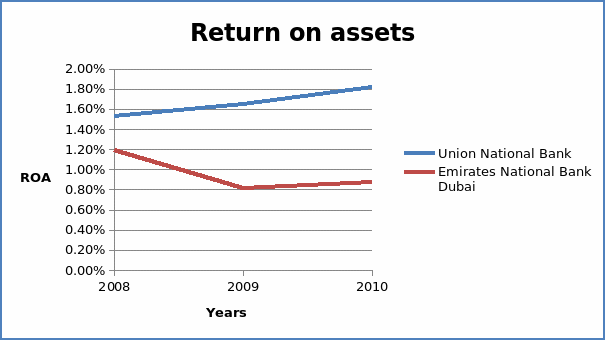
The graph below shows the return on assets of the two banks for the three years

From the graphs, return on equity and return on assets for Union National Bank are better than those of the competitors. The two companies have the same trend for return on equity. Union National Bank has an upward trend on return on assets, unlike its competitor.
Debt ratio
The debt ratio is the ratio of total debt to total assets. It is a measure of leverage. It shows how well the Bank’s debts are covered by the total assets. The table below shows the summary of the debt ratio for the two banks over three years.
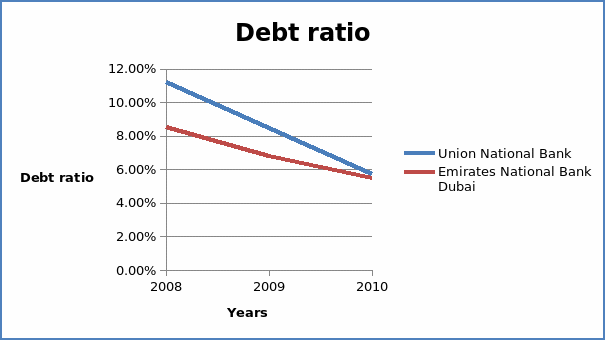
From the table above, the debt ratio for the two banks is less than 100%. This implies that debts for the banks are less than well covered by the total assets. That is, the amount of debt does not exceed the total assets.
The graph below shows the debt ratio for the two banks

Conclusion and recommendations
The paper focused on a comprehensive review of the Union National bank. It looked at the Bank’s profile in detail. It also analyzed the market prices of the shares for a three-year period, that is, 2008 to 2012. It further concentrated on the financial performance of the bank for three years. Debt ratio, return on assets and return on equity are computed to access the financial viability of the company. The results are then compared with that of the competitor. From the analysis, shares of the Union National bank perform better than those of its competitor. In addition, the Bank performs better than its competitor as indicated by return on assets and return on equity. Therefore, an investor should invest in shares for Union National Bank.
References
Union National Bank. (2012a). About us. Web.
Union National Bank. (2012b). Financial performance. Web.

