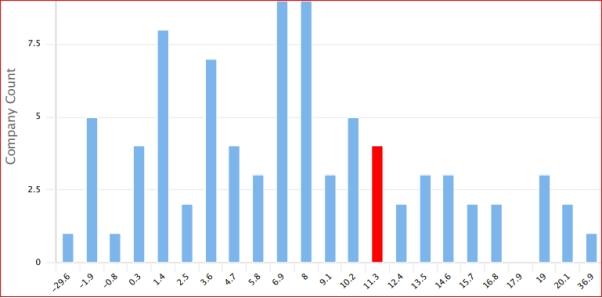
Stock Price Chart.
Industry Overview
Costco Wholesale Corporation, Walmart Inc., Target Corporation, PriceSmart Inc. belong to the retail industry. The sector is directly involved in selling or renting goods and services for household or personal use (Rahman 18). It involves many diverse activities, such as purchasing goods and services, data processing, advertising, and inventory maintenance (Rahman 18). The sector entails dealing with various merchandise categories, including foods, beverages, electronics, cleaning supplies, office supplies, cosmetics, health products, and other general merchandise (Rahman 18). The retail industry accounts for over 10% of the countries’ GDP, and it is predominant in developed nations, such as the United States and the United Kingdom (Rahman 18). The retail industry generates at least $3 trillion in sales annually and employs approximately 22 million people (Rahman 19). Intrinsically, for an economy to thrive, regardless of its size has to benefit from the retail industry.
Costco Overview
Costco Wholesale Corporation operates chains of warehouses across the world under the name ‘Costco Wholesale.’ It started its operations in Seattle, Washington, in 1983 and carried quality, brand-name products at substantially low prices (Rahman 19). Costco targeted to help small to medium-sized businesses cut down costs in buying for resale and daily business usage. Costco focuses on prices by buying and selling in bulk and passing on the savings to its member stores in a warehouse style. It sells goods and services at low prices in size and markets them to large businesses and families. Costco presents one of the most extensive and best-exclusive product categories in a single warehouse, with merchandise categories that range from groceries, hardware, furniture, appliances, books, and electronics (Rodnick 223). Costco seems to trade in almost all merchandise worldwide due to the wide range of products and services it provides to customers.
Costco’s CEO and the executive team are in charge of the company. The top three executives are Craig Jelinek (President, CEO), Hamilton E. James (Chairman of the Board), and David Skinner (Vice President) (Rahman 20). Craig Jelinek has worked in different management positions in the company for at least 20 years. Hamilton E. James has worked in various companies at the management level and is experienced in offering financial advisory services. David Skinner, too, has experience in top management and financial advisory services. The executives have the background and skills to lead this company based on their vast experience in management.
The main source of Costco’s revenue majorly comes from retail sales and membership fees. There are three segments, namely United States, Canadian, and Other International Operations. The United States Operations segment is the primary source of their revenue since it represents about 70% of the total revenue (Rahman 21). In 2020, the company generated close to $122.14 billion in revenue from U.S. operations. The majority of the warehouses are located in the U.S., contributing to significant revenue figures.
Costco has plans based on its most recent earnings, the same as other companies in the industry. The company plans to have a 10% annual revenue growth rate in the next four years due to historical trends in the sales growth rate of about 5-10% (Chen 103). As a result, it will lift the annual revenue from about $163.4 billion in 2020 to close to $264 billion in four years, about 60% of total growth (Morningstar.com).
The earnings per share would double the profits since Costco does not repurchase substantial stock. From an analyst’s point of view, these plans, there are achievable, provided the company continues to open new stores across the world. Costco seems to open about 20 warehouses yearly, and it is projected that by 2025, it will have at least 900 warehouses in total (Chen 104). With these factors put in place, the company’s strategy will continue to shine and win in the retail industry.
The thesis
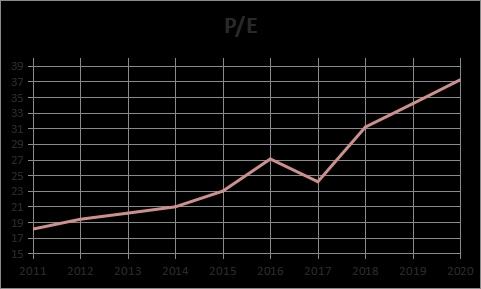
P/E ratio is one of the valuation ratios determining how much investors in ordinary pay per dollar of the current earnings. Costco retailer’s P/E ratio decreased slightly between 2020 and 2021. However, the stock is not currently undervalued based on the P/E ratio, which is 47.10 (Chen 105). Stock valuation depends on the price multiple of the benchmark company. The benchmark company used in this case is Walmart Inc., with a P/E ratio of 29.29 (Finviz.com). The Costco stock is overvalued since its price multiples are higher than Walmart, Inc as a benchmark.
The firm’s earnings are going to increase since there is a projection of an increase in revenues. The company is recording a high membership renewal rate, close to 90%, indicating strong business. High membership increases revenues through sales and membership fees that form the primary source of revenues. Costco is opening more warehouses targeting more members and sales, which are likely to increase the firm’s earnings. The catalyst that moves stock is the digital presence (E-Commerce) that has given the company edge over its competitors. Costco has a massive ready-made database of close to 100 million members with cards that are loyal e-commerce customers (Rahman 22). It leads in the retail industry since it continues to meet customers online, unlike its close competitors, that are reasonably resilient against e-commerce.
Risks to Thesis
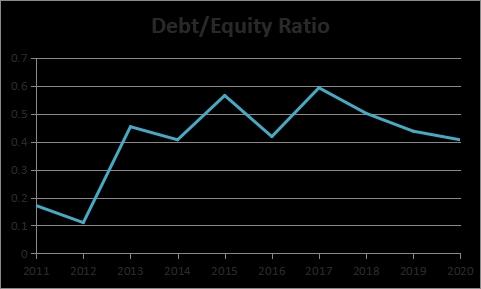
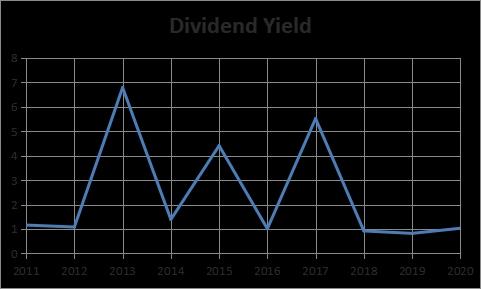
Costco may not achieve its stated goals due to some stock factors that would reduce dividend payments. The company may have erratic dividend payments, which cannot be depended on to offer safety factors in a high-dividend-yield stock (Chen 97). Increasing the dividend payout ratio would increase the dividend per share, which is not sustainable when the situation gets tough. Colossal capital expenditure and expansion can reduce or eliminate dividends, which impact the returns.
Competitive Landscape
Understanding of the Industry
The retail industry has many companies that compete with each other to control the market. Costco has many competitors, and the following are the main competitors; Walmart Inc., Target Corporation, and Kroger Corporation (Chen 57). The retail industry trends that companies should embrace to thrive in the industry. The most significant retail industry trend is investing in Omnichannel retail strategy. The average digital consumer always has about three connected devices consulted before purchasing an item (Rodnick 223). Consumers use their mobile phones and other devices, such as iPad, to get more information about specific things in different stores. Therefore, retailers should take advantage of the technology to reach more customers by encouraging mobile shopping.
Another current industry trend is the use of mobile as a mode of payment. Bank of America commissioned a study and found that about 91% of adult customers own smartphones in the U.S. The rise of the digital wallet shows the growth in mobile payment methods, making consumers flexible. Retailers will survive in this industry by adopting flexible payment methods, such as Apple Pay and Android Pay (Rahman 24).
It has been estimated that about 20% of adults in the U.S. use digital wallets or are interested in using them in the future (Dallas II 34). The retail industry, as mentioned before entails many firms with different amounts of shares. Out of 136 companies, the following are firms that hold the largest share in the retail industry; Amazon with a market cap of $1.864 trillion, Home Depot ($432.31 billion), Alibaba ($424.47 billion, Walmart ($235.84 billion), and Costco ($235.84) (Finviz.com). These firms compete to control the industry, implying that Costco has to be creative and innovative to outshine its rivals.
Competitors versus Costco Wholesale Corporation
Earnings per share show that the company is likely to make every share and estimate the corporate value. In essence, high EPS indicates high value since investors are likely to pay with anticipation that the company will make more profits. In contrast, low EPS indicates low value since the investors will be reluctant to pay more, expecting low profits in the future. From the figures provided, Costco has the highest EPS compared to its three competitors. Costco has an EPS of 11.27, with the closest rival, Target Corporation, with 8.64 (Finviz.com). Based on these figures, it can be concluded that most investors would prefer Costco to its competitors since it is more likely to make more profits than its competitors.
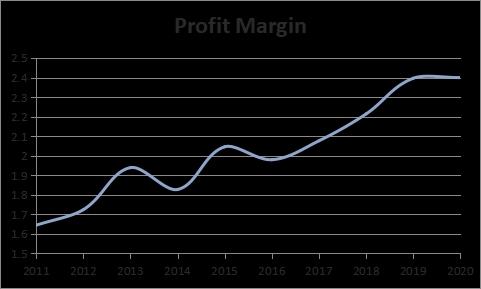
The profitability ratios used in this analysis are gross margin, operating margin, and net margin. Based on the figures provided, Costco has the lowest gross margin of 12.88 compared to its competitors. The competitor with the highest gross margin is Target Corporation, with a gross margin of 30.24. Costco has the second-lowest operating margin of 3.42, and at the bottom, Kroger has 1.71. Lastly, based on the net margin, Costco is the second best with 2.56, and the highest competitor with the highest net margin is Target Corporation, with a net margin of 6.29 (Macrotrends.com). It implies that all these companies are doing well based on the margins demonstrated in financial analysis.
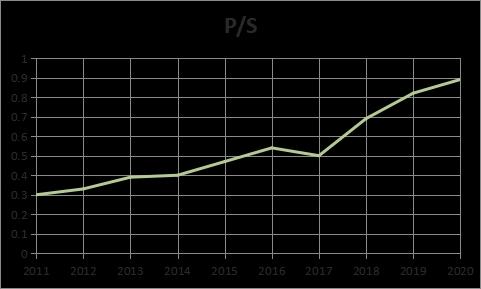
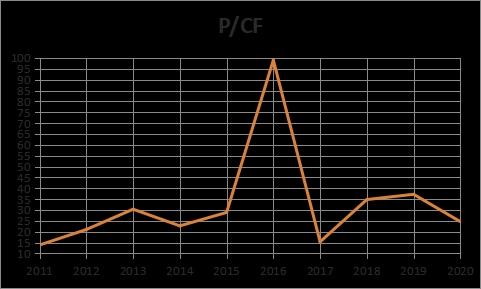
Valuation ratios indicate the relationship between a company’s market value or equity and other metrics, such as earnings. Some of the valuation ratios used in this analysis are P/E, P/CF, P/S, and P/B. Table 1 shows that Costco has the highest Price-to-Earnings (P/E) with 40.35 compared to its competitors. Walmart closely follows it with 39.78 and then Kroger with 26.69 (Macrotrends.com). Costco also has the highest Price-to-Book (P/B) and Price-to-Cash Flow (P/CF) compared to competitors. It means that Costco Company has a good relationship between its equity and earnings, cash flow, or revenues.
Table 1: Costco Valuation Ratios. Source: Finviz.com.
After comparing Costco’s financial ratios with the competitors, the company needs to expand on its market value, which seems lower than some competitors like Walmart. The company has financial strengths in P/E, P/B, and P/CF compared to its competitors. The valuation ratios are better for Costco than competitors, implying that investors would prefer the competitors.
Financial Analysis
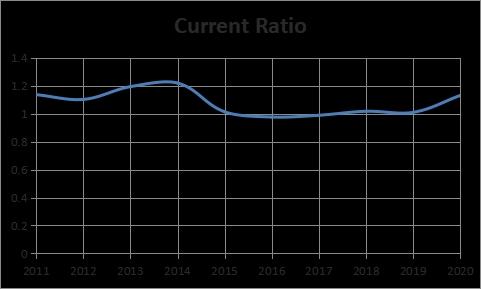
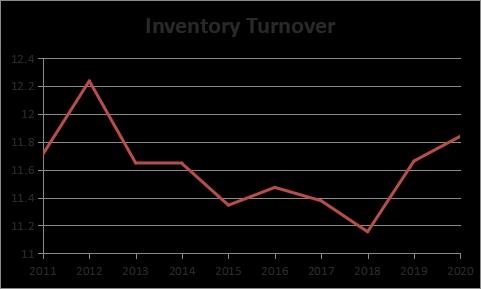
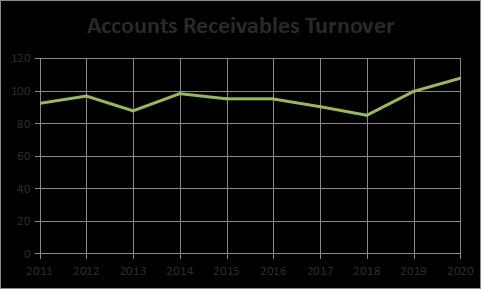
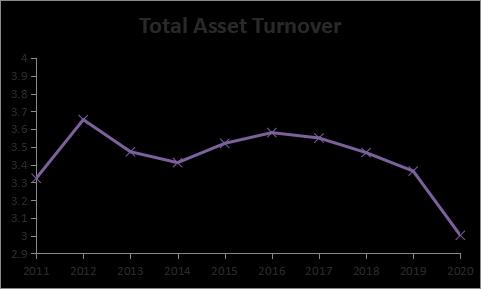
The analysis includes company trends concerning financial ratios over the past ten years in relation to the competitors. The data was extracted in excel, and representative graphs were created.
Five-part DuPont Analysis
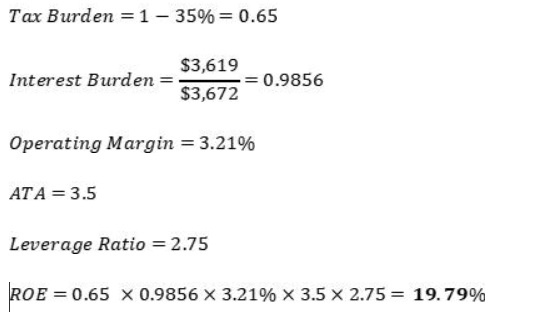
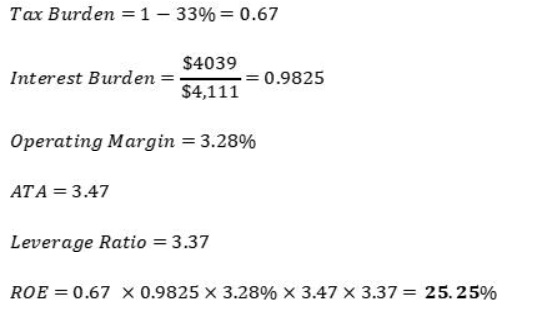
DuPont Analysis is used to identify several factors that affect Return on Equity (ROE) that would allow investors to determine the strengths and weaknesses of the company. DuPont analysis is calculated by multiplying net profit margin by total asset turnover by equity multipliers (Dallas II 37). DuPont analysis allows investors to know the type of financial activities that affect changes in Return on Equity (Dallas II 38). It is vital in comparing operational efficiency between two companies from the same industry (Dallas II 39). The calculations for the five-part DuPont analysis for the past five years are clearly shown below.
ROE Calculations for 2016
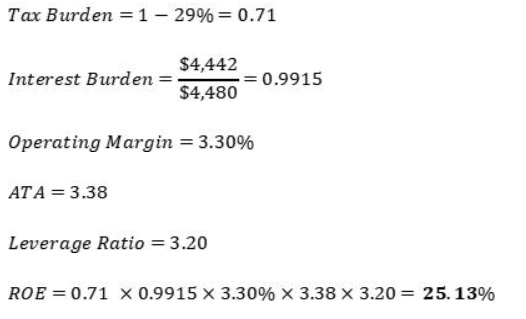
ROE Calculations for 2017
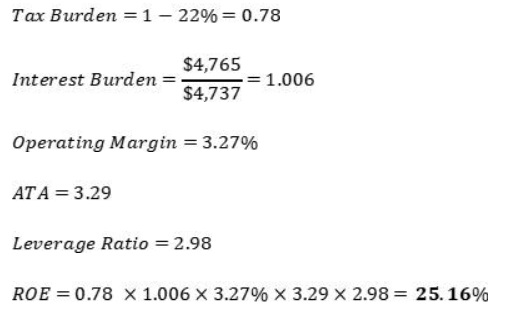
ROE Calculations for 2018
ROE Calculations for 2019
ROE Calculations for 2020
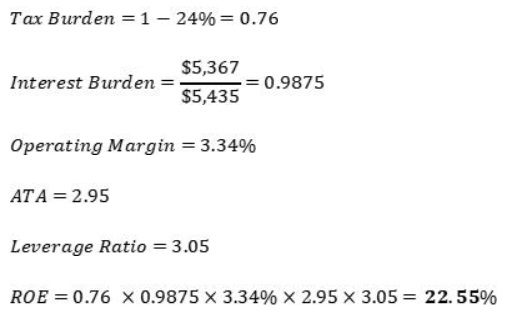
Table 2: Summary of ROE Calculations. Source: ROE Calculations.
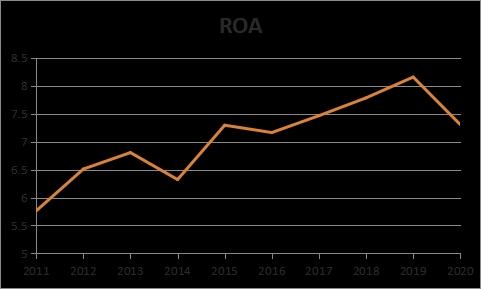
Over the past three years, there has been an increase in ROE due to some factors. The increase is caused by the increase in revenues over the years. From 2018 to 2021, the company experienced a massive increase in revenues, contributing to the increasing ROE over the period. Income is also a critical factor that affects ROE, implying that an increase in income will automatically increase ROE. Costco has reported an increase in income over the past three years from $3,659 in 2019 to $5,007 in 2021. The increment in income has contributed to the rise in ROE over the past three years.
Based on the financial data collected, it is evident that the company management is making good investments and financial decisions that increase shareholders’ value. Costco has a good relationship between the required rate of return and the rate of return since the Price-to-Book is greater than 1. It implies that company management is thinking about future profitability provided that the book value reflects the value of assets. The company’s overall financial performance is much better than its competitors, associated with a better decision-making process.
From the figures provided, Costco has the highest EPS compared to its three competitors. Costco has an EPS of 11.27, with the closest rival, Target Corporation, with 8.64. Based on these figures, it can be concluded that most investors would prefer Costco to its competitors since it is more likely to make more profits than its competitors. The firm proves that its revenues do not rely on earnings and book value metrics but on accounting practices.
Price-to-Cash Flow is also an excellent financial ratio that indicates that the company is making reasonable economic decisions. P/CF is always associated with companies with positive cash flow, but its profitability is determined (Dallas II 45). It shows that management investments and financial decisions that produce cash flow are challenging to manipulate based on the existing accrual accounting (Dallas II 45). P/CF has varying ways to determine the cash flow metrics, and proper decisions should be made to realize targeted cash flow estimates.
Project Price
Dividend Growth Model
Customers have substantial unit savings with the company and would prefer to make bulk purchases. Costco has a high chance of paying dividends since it maintains its low payout ratio (StreetInsider). In essence, a low payout does not significantly affect the unexpected headwinds that the company might face. It means that the company’s dividend is reliable, and earnings are likely to grow the time. The model portrays the company as of great value to its shareholders based on its commitment to paying dividends.
The Dividend Growth Model may not work in scenarios where the growth rate is higher than the required rate of return. Costco’s required rate of return as of August 2021 is 11.99% (Gurufocus). The price from today, P1, can be calculated from this equation, P1 = D2 / (K – g). Where;
P1= Current Price
D2= Dividend Payment
K= Discount rate of the company
g= Growth rate
Current Price=7.8/(5.42-11.99%) =$41.34
Holding period return = (Future target price/ Current price) – 1
The future target price of Costco is $523.05 for the next five years (Finviz.com).
Holding period return = ($523.05/ $41.34) – 1 =11.65
From this analysis, it is evident that the model did not work since the rate of return parameters are not giving close answers to the figures in the growth model. The dividend history is not easy to project based on the model used, and preferable the WACC would likely give the best answers.
Recommendations
Based on this analysis, I would recommend buying this stock due to numerous reasons elaborated above. I would advise the client to buy this stock since it is ‘buy on margin.’ Costco’s gross profit margin, operating margin, and net margin over the years are favorable compared to its competitors. As a result, clients would be interested in investing in a stock with a fair margin that would be profitable soon.
Assuming that 100 shares are bought at a 50% margin, and the average stock price is $404.16, according to Morningstar. The cost of this stock can either increase or decrease depending on the minimum margin requirement needed. The fall in price to achieve the required margin can be calculated as follows;
![]()
The low the stock price can fall in one month is $279.47, assuming the beginning stock is $404.16. It has to factor in the monthly interest, which should be deducted from the profit made. The stop-loss price will be (404.16-279.47) = $124.68. The stop-loss price is determined by calculating the difference between the beginning and new stock prices based on the minimum margin requirement. To avoid plugging the company into decreasing its returns, the stop-loss price should be less than the new stock price.
Works Cited
Chen, Jiangpei. “Marketing strategy management of Costco: Analysis and comparison to S-Group“. (2021). Web.
Dallas II, Aaron Fitzgerald. “A Comprehensive Financial Analysis of Retail and Wholesale Food Chains.” (2019). Web.
Finviz. “Financial Data”. (2021). Web.
Gurufocus. “Financial Analysis.” (2021). Web.
Macrotrends. “Annual Reports.” (2021). Web.
Morningstar. “Stock Analysis.” (2021). Web.
Rahman, Md Habibur. “Financial Analysis Of Costco Wholesale Corporation: Exploring The Strengths And Weaknesses.” The Bangladesh Journal of Agricultural Economics. Vol 41. No. 1, 2020, pp. 17-34.
Rodnick, Kaitlyn. “Tiffany & Co. v. Costco Wholesale Corp.: Cut, Clarity, Carat, Color, and Costco?.” Tul. J. Tech. & Intell. Prop. Vol. 23, 2021, pp. 223.
StreetInsider.com. “Dividend History for ().” (2021). Web.