Executive Summary
Financial ratios are a fundamental technique in investigating through comparison of companies along with timelines of the liquidity, profitability, efficiency and stability position over a period of time. This technique has been used to analyze the performance of Wesfarmers Limited and Woolworths Limited. Specifically, the company evaluates the performance of the two companies on profitability, efficiency, short-term and long-term financial stability and determines the findings. Nevertheless, the paper also justifies the means through analysis of the limitations with conclusive recommendations. Woolworth has a Gross Profit margin of 25.73% as per FY 2010 which increased insignificantly to 25.78% in the FY 2011Wesfarmers Limited has a Gross Profit margin of 30.99% as per FY 2010 which reduced insignificantly to 30.96% in the FY 2011. Woolworth has higher values on Gross profit margin and returns on equity. This corresponds to the diversification of its investment to bring high profits hence utilizing its assets effectively. Woolworth Limited and Wesfarmers are in the same industry but do not generally undertake the same accounting policies. As such, the use of different financial reporting procedures and policies fundamentally leads to misleading indications of the ratio. This is because; the companies also range in size, level of diversification as well as a technological endowment which makes it quite impossible to partake in a unifying industrial analysis on the use of financial ratios. Ultimately, the ratios may only be used to quantify and qualify the measure of performance of quantifiable variables which are mostly numerical values. On the other hand, the technique fails in its application to valuing the performance of non-quantifiable areas of performance.
Introduction
Financial ratios are a fundamental technique in investigating through comparison of companies along with timelines of the liquidity, profitability, efficiency and stability position over a period of time. As such, the analysis highly contributes to establishing if a company is able to meet this obligation, survive in the market and earn profit to sustain it during this period. Wesfarmers Limited (Wes) and Woolworths Limited (Wow) are companies in the same industry offering chain store and supermarket services (Birt, 2010).
Woolworths Group is a company owned by a retail chain. Its chain stores reach over eight hundred stocked with all types of goods mostly children’s clothing (Woolworth Limited 2010). Today, the company prides itself as the best in the United Kingdom region coupled with its popular name Woolies (Straub 2007). The financial stability of the company was compromised in the year 2008 when the company shares were suspended. After the process of receivership, the company was repurchased as Woolworth. Today, the company prides on ensuring a broad representation of the workforce, diversification of its investments as well as fundamental leadership ability (Crundwell 2008).
Profitability
The profitability indicated by the financial ratios posts the efficiency and effectiveness of Wesfarmers Limited (Wes) and Woolworths Limited (Wow) in channeling their assets to generate revenue. Again, the comparison of efficiency ratios between the two competing companies illustrates the distinction of efficiency and profitability between the two countries.
In essence, the analysis of whether profits are escalating or dwindling and the reasons for such effects encompass the profitability analysis as per this paper. The profitability ratios undertaken in this paper, as analysis tools for the two companies are Gross profit margin, Net profit margin, return on assets, and return on capital employed, among others. A reduction in profits normally arises due to reduced sales revenue as well as increased costs or both. Favorable profitability indicates to the management a sense of efficiency and effectiveness in revenue generatio as well as a significant endeavor in cost control.
Woolworth has a Gross Profit margin of 25.73% as per FY 2010 which increased insignificantly to 25.78% in FY 2011. This indicates a small increase in sales as well as a corresponding decrease in the cost of sales (See appendix). Again the net profit margin and increased from 5.96% to 6.05% in the year 2010 and 2011 respectively. Notwithstanding, immense improvement in the return on equity was fundamental. It increased from 26.07% to 27.28% in the years 2010 to 2011 respectively. This indicates a favorable increase in sales and effective utilization of assets to generate income (Woolworth Limited 2010).
Wesfarmers Limited has a Gross Profit margin of 30.99% as per FY 2010 which reduced insignificantly to 30.96% in the FY 2011. This indicates a small decrease in sales as well as a corresponding decrease in the cost of sales. Again the net profit margin and increased from 5.76% to 6.11% in the year 2010 and 2011 respectively. Notwithstanding, immense improvement in the return on equity was fundamental. It increased from 6.34% to 7.59% in the years 2010 to 2011 respectively. This indicates a favorable increase in sales and effective utilization of assets to generate income (Australian Stock Exchange (2011).
It is, however, notable that Woolworth has higher values on Gross profit margin and return on equity. This corresponds to the diversification of its investment to bring high profits hence utilizing its assets effectively. Again, a high return on equity implies shareholders have a higher residual claim than those of Wesfarmers, thus, attracting more investors.
Efficiency
Financial ratios are used to evaluate the effect that the Company is using its assets to recoup the sales. This is done by use of efficiency ratios mostly referred to as turnover ratios. The ratios encompassed in this context are the rate of stock turnover, debtor’s turnover, and creditors’ turnover. Woolworth Asset turnover (times) has reduced from 2.80 times to 2.57 times. Inventory turnover has increased from 33 days to 34 days. Debtors’ turnover increased significantly from 1.5 days to 2 days, while the creditor’s turnover was maintained at 40 days. This data goes respectively in the 2010 and 2011 financial years. In general, Woolworth has experienced improvement as reflected in the shorter stock conversion period which is favorable. Again, the debtor’s higher increase in frequency to 2 times implies movement to efficiency (Groppelli & Nikbakht 2006).
Wesfarmers Limited Asset turnover (times) has increased from 1.27 times to 1.30 times. Inventory turnover has increased from 49 days to 50 days. Debtors’ turnover increased significantly from 10 days to 11 days, while the creditors’ turnover went up by a day from 49 to 50 days. This data goes respectively in the 2010 and 2011 financial years. In general, Wesfarmers Ltd has a higher debt collection period that has fundamentally increased which implies the company is in a worse position in obtaining debts. Again, it ought to improve through strategic approaches. Like Woolworth, Wesfarmers Ltd has experienced improvement as reflected in shorter stock conversion period and increased inventory turnover which is favorable.
On the general scale, Woolworth has a favorable condition in terms of efficiency due to the less time on debt payment as well as meeting its obligation to the creditors. Wesfarmers has overcapitalized its business due to a large number of assets. In this effect, it has led the organization to incur large funds and time to recoup money from the debtors (See appendix).
Financial stability short term
The ranging abilities of the companies to meet their short-term obligations have a subjective weight on their stability as well as liquidity risks. Financial stability can be measured using liquidity ratios that offer a predictive clue as to whether a particular company is overcapitalized, undercapitalized or undertake optimal investment working capital. The current ratio, quick ratio and cash ratio are significant in ensuring effective analysis of Woolworths Ltd and Wesfarmers Limited stability (Walker 2008).
The stability position of the companies has been analyzed using the quick ratio as well as the current ratio. Woolworth Limited’s current ratio increased from 0.73 to 0.80 in the years 2010 and 2011 respectively. The company quick ratio also increased from 0.21 to 0.32 respectively. This indicated that Woolworth company has enough working capital to keep it operating and its liquidity is high enough to meet its obligation.
Wesfarmers Limited’s current ratio reduced from 1.23 to 1.17 in the years 2010 and 2011 respectively. The company quick ratio also reduced from 0.64 to 0.59 respectively. This indicated that Wesfarmers Company has enough working capital to keep it operating and its liquidity is high enough to meet its obligation. This is because the current ratio is over 1, thus, a sign of overcapitalization. However, the decrease in quick ratio and current ratio reveals the company’s struggling in liquidity problems. The company is gradually running into inefficient strategies thus the decline in the ratios (Australian Stock Exchange 2011).
Irrespective of the decrease in value of the ratios, Wesfarmers ratios are large than Woolworth limited. This indicates that Wesfarmers Ltd is more stable to handle liquidity obligations as opposed to Woolworth. This may be because Wesfarmers Limited concentrates on cash flow generatio and upholding an effective balance sheet, not to mention their strategy to go for long-term management as a sustainability approach (Harwood 2006). Again, Wesfarmers focuses on capital management initiatives in an effort to store generated cash flows which offers room for surplus generatio through having liquid cash for immediate investment. This allows for the company to have high liquidity. Woolworth has focused on investment diversification like restructuring, line items and endways supermarket supply chain developments that leaves little cash or cash equivalent to meet its obligation.
Financial stability long-term
Working capital-working capital is the net sum total of cash required to periodically meet the purchase of inventories and or creditors in the light of crediting debtors purchases. Hence, the amount of cash flow from the project should be able to cater for cash purchases and on-time payments of creditors in due time so as to have a smooth flow of activities. The amount of working capital is essential in selecting and determining the project choice.
Risk is essentially considered in the determination of the project’s cash flow. Forecast of the investment financials incorporated no mention of the possibility that these projections may not be accomplished. These assumptions take the fact that projections were recognized with certainty. In reality, a big number of causes of risks or uncertainty may be able to control the end result of a project. However, the forecasts of the investment economic decisions are completed with the best probable information and method with regard to uncertainty. Then again, an investment is not perilous if the project’s economic value can be determined with assurance.
Risk is the chance of unwelcome/welcomed consequences brought about by the uncertainty of the operatioal activities of the invested project. The cash flow of the investment will from time to time fluctuate, because of the varying values of the components of the project obstacles and opportunities. The inconsistency in the revenues and expenses incurred of the project is the cause of business perils. This fluctuation will, in the same line, lead to fluctuations of the cash flow and consequently the determine project’s cash flow.
Limitation of analysis
However, it is worthwhile to note that even the best methodology undertaken in any analysis does not lack a demerit that accounts for its limitation, and drives the analyzer into below 100 percent reliance on the method. Even if the financial ratios are fundamental tools on company financial analysis, they suffer particular drawbacks. In particular, where a company is a monopoly or a dominant company in a particular industry or region, the industrial analysis ends up being minimized because financial ratios only apply effectively in comparison undertaken in industrial analysis.
Again, the technique is a significant short-term tool in contributing to management decision-making. On the other hand, they fall to be very irrelevant or inapplicable in deducing useful long-term plans. In essence, financial ratio analysis offers techniques that give a clue and pinpoints to areas of weakness that call for further evaluation and investigation. Therefore, they fail to offer a form of a basis for final conclusion.
Financial ratio analysis is undertaken from financial statements (may sometimes be consolidated) prepared to lack considering account changes in the value of money. As such, the ratio calculated for management decisions and forecasts will reflect past results and mostly wrong as per the real-time. This limitation to the results, therefore, may be fundamentally misleading in making decisive decisions for the company (DePamphilis 2008).
Woolworth Limited and Wesfarmers are in the same industry but do not generally undertake the same accounting policies. As such, use of differing financial reporting procedures and policies fundamentally lead to misleading indications of the ratio. This is because; the companies also range in size, level of diversification as well as technological endowment which makes it quite impossible to partake a unifying industrial analysis on the use of financial ratios.
Ultimately, the ratios may only be used to quantify and qualify the measure of performance of quantifiable variables which are mostly numerical values. On the other hand, the technique fails in its application to valuing the performance of non-quantifiable areas of performance.
Risks increase the value of the common stock. Less the risk of investment, the less value of the common stock. On the other hand, high risk translates to a high value of the common stock. This is as illustrated in the interest rates change with the changes in the various environmental risks within a market. More often we get the government bond to bring less interest and value because of fewer risks. However, other investments offered by companies, which have higher risks have always been attached with higher interest rates and higher value as well.
Recommendations
As such, the use of different financial reporting procedures and policies fundamentally leads to misleading indications of the ratio. This is because; the companies also range in size, level of diversification as well as a technological endowment which make it quite impossible to undertake a unifying industrial analysis on the use of financial ratios. Inventory turnover has increased from 33 days to 34 days. Debtors’ turnover increased significantly from 1.5 days to 2 days, while the creditor’s turnover was maintained at 40 days. This data goes respectively in the 2010 and 2011 financial years. In general, Woolworth has experienced improvement as reflected in the shorter stock conversion period which is favorable. Again, the debtor’s higher increase in frequency to 2 times implies movement to efficiency (Cartwright, & Schoenberg 2006).
However, the level of uniqueness differs across each other. The resultant type and sophistication of the cultural approaches will be determined by the nature of the merger or acquisition. If the two companies are to be fully merged, the most excellent aspects of both legacy entities will have to be incorporated into a single company with new policies concentrated on achieving the business objective and goals. Where the two entities are to be operated as two separate organizations, cultural integratio is neither essential nor recommended (Elwin 2010). However close association to make sure there exists a mutual dealing between two separate cultures will be indispensable to guarantee shareholder value (DePamphilis 2008 p. 764).
The significance of having efficient and consistent internal and external communication for the period of a synergy process should be well affected. If not, major stakeholders should be properly informed in the period that there is a merger process. This will be to ensure that their optimistic buy-in is probably not lost in case the merger process takes more time than expected. According to KPMG (1999 p. 13), business entities that prioritize communications are 15% more optimistic of being successful than others. Further, the clear lines of communication plan imply that incompetent staff will have many disadvantageous effects on the merging or acquisition success as opposed to shareholders (Fitzgerald 2002).
A balanced approach to information exchange is significant. It has been one of the contributing factors to fewer payoffs expected because the new management might ignore a group of employees as they focus on employees in the target business. The same trend will run down to customers KPMG (1999 p. 15). However, it is uniformly probable to feel concerned about the change to the company.
References
Australian Stock Exchange (2011). Wesfarmers Limited (WES). Web.
Australian Stock Exchange (2011). Woolworths Limited (WOW). Web.
Birt, J., et al, (2010). Accounting: Business Reporting for Decision Making, 3nd ed. Wiley: Brisbane.
Cartwright, S., Schoenberg, R., (2006). “Thirty Years of Mergers and Acquisitions Research: Recent Advances and Future Opportunities”. British Journal of Management.
Crundwell F. K. (2008). Finance for Engineers: Evaluation and Funding of Capital Projects. New York: Springer.
DePamphilis, D., (2008). Mergers, Acquisitions, and Other Restructuring Activities. New York: Elsevier, Academic Press. pp. 740-782
Elwin T., (2010). Organization talent, change, and leadership @telwin: Mergers and acquisitions failures are project management failures. Web.
Fitzgerald, R. (2002). Business Finance for Managers: An Essential Guide to Planning, Control and Decision Making (3rd ed.). Kogan Page Publishers.
Groppelli, A.A & Nikbakht, E. (2006). Finance (5th ed.). Barron’s Educational Series.
Harwood, I. A. (2006). “Confidentiality constraints within mergers and acquisitions: gaining insights through a ‘bubble’ metaphor”. British Journal of Management 17 (4): 347–359
KPMG, (1999). Unlocking Shareholder Value: The Keys to Success Mergers & Acquisitions, a Global Research Report p. 10-15
Straub, T., (2007). Reasons for frequent failure in Mergers and Acquisitions: A comprehensive analysis. Wiesbaden: Deutscher Universitätsverlag
Walker, J. (2008). Accounting in a Nutshell: Accounting for the Non-Specialist (3rd ed.). Butterworth-Heinemann.
Woolworth Limited (2010). Woolworths Limited Submission regarding proposed changes to the ASX Corporate Governance Principles and Recommendations. Web.
Appendices
Table 1: Woolworths Ltd and Wesfarmers Ltd
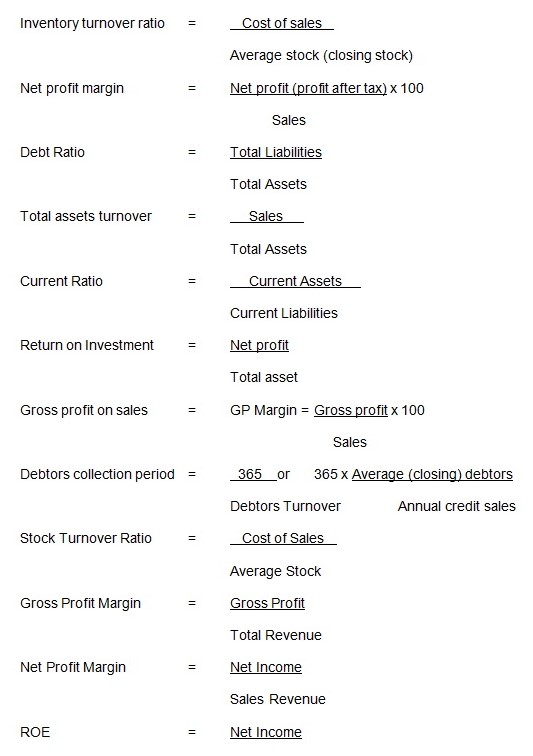
Formulae: ratio Analysis