Introduction
Fujairah Building Industry (FBI) is a public joint-stock company that was set up in Fujairah, which is owned mainly by the government of Fujairah, department of industry and economy. It was established in 1978 to provide high-quality blocks and interlocks within the United Arab Emirates. Since then, the company has been producing concrete products.
The company is centralized to the city, while the Depot is located in Al Hail. Company Profile Fujairah Building Industry operates in the construction sector.
Company overview
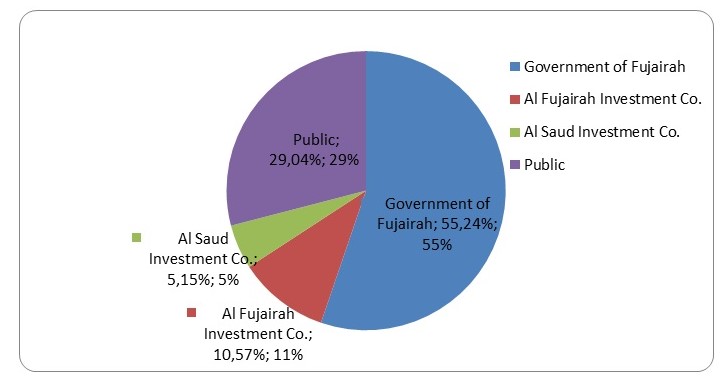
Major Shareholders
Fujairah Building Industry has a tightly held stock as the Government of Fujairah owns 55.24% of the company’s shares and the second-largest shareholder is Al Fujairah Investment Company, which owns 10.57 %. The company’s shares are traded on the Abu Dhabi Securities Exchange.
The other large investor is Al Saud Investment Company. This makes a total of 70.96% Owned by institutional investors. The balance owed by the general public is only 29.04 %.
Financial Ratio Analysis
Profitability Ratios
Fujairah’s Profitability Ratios
From the above graph, we can see that the return on equity was the highest over the years, followed by the return on assets, and the lowest was the profit margin. We can also see that between 2005 and 2006, all the three ratios were constant then return on equity and return on assets increased in 2007 while profit margin still remained almost constant. Between 2007 and 2008, all the three ratios were decreasing.
This means that the efficiency with which the company utilizes its resources to generate income has decreased and is not systematic.
Industry Vs Fujairah Profitability Ratios
Profit Margin
From the computation, it is evident that the highest profit margin was realized in 2005 at 17.15 %. During that year, investments in the United Arab Emirates and particularly in Dubai were very high. The profit margin however started falling after the crisis and reached the lowest point of 13.76 % in 2008. This is a 19.77 % decrease from 2005.
However, from the graph, Fujairah’s profit margin can be seen to be almost constant in the years 2005, 2006, and 2007. Even in 2008, the decrease is minimal. The industry’s profit margin is seen to have dropped sharply in 2006, and then it kept dropping very minimally in the years 2007 and 2008.
Compared to the industry ratio, Fujairah’s profit margin is far much lower than that of the industry.
This means that compared to the other firms in the industry, Fujairah Building Industry is earning less profit in proportion to the resources that they invest in the production of their products. This may be attributed to Fujairah’s underpricing of its products, or the company may be buying its inputs and raw materials at a higher price than the other firms in the industry.
Return on Assets
The return on assets declined from 9.48 % in 2005 to 8.69 % in 2006 then increased again to 12.19 % in 2007 and dropped again to 10.57 % in 2008. This means that compared to other firms in the industry, Fujairah is more efficient in managing and utilizing its assets. This is evidenced by the fact that in all four years, the company has a higher return on assets than that most.
Return on equity

The company’s return on equity increased from 13.57 % in 2005 to 14.63 % in 2006 and then to 19.5 % in 2007, but then reduced slightly to 19.2 % in 2008. Compared to the industry, Fujairah’s return on equity was higher than that of the other firms in the industry in all years except in 2005.
This shows that the company was utilizing its equity funds efficiently in generating revenue, and is therefore offering higher returns to its shareholders on their investment than most firms in the industry. (Graham, J., Smart, S., Megginson, W. 2009).
Du Pont Analysis
Return on Equity = Profit margin*Total Assets Turnover * Equity Multiplier
From the above calculations, the return on equity has improved over the years, meaning that the shareholders have been earning a higher return on their investment.
Asset Utilization Ratios
Receivable Turnover
From the above table and graph, we can see that Fujairah’s collection policy seems to be improving over the last two years. This is evidenced by the increase in receivables turnover from 3.27 in 2006 to 3.87 in 2007 and 4.52 in 2008.
In all four years, Fujairah’s receivables turnover is higher than the industry’s, which shows that the company has a better collection policy than the other firms in the industry. (Graham, J., Smart, S., Megginson, W. 2009).
Average collection period
From the figures on the table above, Fujairah was easily converting its receivables into cash except in the year 2006, in which the average collection period increased from 108.52 days in 2005 to 111.55 days in 2006. However Fujairah’s average collection can be seen to be decreasing, which means that the company is improving in its debt collection.
The company’s average collection period was also less than half the industry’s in all four years, which means that the company was converting its receivables into cash faster than the other firms in the industry.
Inventory turnover
From the figures on the above table and graph, Fujairah had a lower inventory turnover than that of the industry in all four years, meaning that the company was less efficient in managing its inventories as compared to the industry. Also over the years, change in the company’s inventory turnover was not systematic because it reduced from 4.79 in 2005 to 3.14 in 2006 then it increased to 4.00 in 2007 and further increased to 4.63 in 2008.
Fixed Assets Turnover
From the figures on the above table, Fujairah had a lower fixed assets turnover than that of the industry in all four years, meaning that the company was less efficient in managing its assets as compared to the industry. Also over the years, the change in the company’s fixed assets turnover was not systematic because it reduced from 1.54 in 2005 to 1.37 in 2006 then it increased to 2.02 in 2007 and reduced again to 1.85 in 2008.
Total Assets Turnover
From the figures on the above table, Fujairah had a higher total assets turnover than that of the industry in all four years, meaning that the company was more efficient in managing its assets to generate revenue as compared to the industry. Also the company’s total assets turnover reduced from 0.55 in 2005 to 0.52 in 2006 then it increased to 0.72 in 2007 and further increased to 0.77 in 2008.
Liquidity Ratio
Fujairah’s Liquidity Ratio
From the above figures, we can see that Fujairah’s liquidity ratios increased in the year 2006 but then they dropped in 2007 and further dropped in 2008. this shows that the firm’s liquidity position is weakening.
Industry Vs Fujairah’s Liquidity Ratio
From the above graph we can see that in the year 2005, Fujairah’s liquidity position was weaker than most firms in the industry. This position however changed and in the years 2006, 2007, and 2008, Fujairah’s liquidity position was far much stronger than the other firms in the industry.
Current Ratio
Fujairah’s current ratio had increased from 1.36 in 2005 to 1.94 in 2006 before decreasing to 1.87 in 2007 and further decreasing to 1.73 in 2008. This means that the company’s ability to meet its short-term maturing obligations is reduced.
Compared to the industry, the company was more able to meet its short-term maturing obligations because its current ratio was higher than that of the industry in all the years except 2005.
Quick Ratio
Fujairah’s current ratio had increased from 0.91 in 2005 to 1.24 in 2006 before decreasing to 1.19 in 2007 and further decreasing to 1.13 in 2008. This means that the company’s ability to meet its short-term maturing obligations from its current assets excluding inventories reduced.
However compared to the industry, the company was more able to meet its short-term maturing obligations from its current assets excluding inventories because its quick ratio was higher than that of the industry in all the years except 2005.
Debt Utilization Ratio
Debt to Total Assets
From the above figures, we can see that Fujairah has a lower debt to total assets ratio compared to the other firms in the industry in all the years except 2006, during which the difference was minimal. This means that the company had lower liabilities and debt obligations than the other firms in the industry, which also means that the company can manage its debt better than the other firms in the industry.
Time Interest Earned Ratio
This ratio is calculated by dividing a firm’s earnings before interest and tax by the total interest on debts. A higher Time Interest Earned ratio indicates a more stable company. (Graham, J., Smart, S., Megginson, W. 2009).
From the above figures, we can see that Fujairah has a higher time interest earned ratio compared to the other firms in the industry in all the years. This shows that the company has a good debt management policy.
Fixed Charge Coverage Ratio
Fixed Charge Coverage Ratio measures a company’s ability to pay fixed costs during hard economic times. It is computed by dividing the sum of earnings before interest and taxes and fixed costs, by the sum of fixed costs and interest. A higher Time Interest Earned ratio indicates a more stable company that can meet its fixed cost even during low seasons. (Graham, J., Smart, S., Megginson, W. 2009).
Fujairah’s fixed charge coverage ratio had increased from 15.81 in 2005 to 24.91 in 2006 before decreasing to 20.15 in 2007 and increasing to 28.05 in 2008.
Trend Analysis
Profitability Ratios
Horizontal Analysis
Income Statement
Although an increase in accounts receivable normally reflects an increase in sales, we can see that the increase in sales over the years is a lot more than the account receivables. The average collection period has also reduced greatly. It initially increased from 108.52 in 2005 to 111.55 in 2006 then reduced to 94.5 in 2007 and further reduced to 80.68 in 2008.
The level of inventory has also increased more than four times from 13,420,208 in 2005 to 61,856,926 in 2008.
From 2005 to 2006, the company had its highest decrease in inventories.
The investments in securities available for sale had increased by 9.5 % in 2006 then by 12.9 % in 2007 before dropping by 8.1 % in 2008. This was a result of the financial crisis in 2008. The company’s profit margin also decreased over the years, as a result of the financial crisis.
Property, Plant and Equipment increased only slightly in 2006 and 2007, and then dropped in 2008.
The company’s total liability increased a lot in 2006 then decreased in 2007 before increasing again in 2008. This shows that in 2007, the company was able to pay its debts 2007 but then increased its borrowing again in 2008.
The current liabilities increased sharply in 2006 and then increased at a decreasing rate in 2007 and 2008.
The company’s share capital increased greatly by 220 % in 2006 then increased at a decreasing rate in 2007 and 2008. This means that in 2006, the company issued more than twice the shares it had in 2005 than in 2007 and 2008, the company issued minimal shares.
The total shareholders’ equity increased at a decreasing rate by 76.3 % in 2006, 59.8 % in 2007 and then by 29.2 % in 2008.
The total shareholders’ equity increased at a decreasing rate by 74.5 % in 2006, 28.5 % in 2007 and then by 12.5 % in 2008. This implies that the company is expanding and growing, but at a declining rate.
The change in total liabilities was not systematic, as it increased sharply in 2006, and then increased only slightly in 2007 before increasing by over 50 % again in 2007.
We can see that sales and net income are both increasing but at a declining rate.
We can also see that the percentage increase in cost of goods sold over the years is higher than that of sales. This percentage increase in cost of goods sold may have been caused by the inventory valuation method of first in first out.
The finance charges decreased by almost half in 2006 before increasing sharply in 2007 and then decreasing slightly in 2008.
The general and administrative expenses increased at a reducing rate over the years as sales also increased at a reducing rate.
Degree of Financial Leverage
financial leverage refers to financing the firm from fixed costs. An example is having very high operating profit, also referred to as earnings before interest and tax. Degree of financial leverage measures the effect of the amount of financial leverage on earnings per share (EPS). The volatility of Earnings Per Share (EPS) depends on the degree of financial leverage. If the degree of financial leverage is high, the firm’s earnings per share (EPS) will be more volatile and if the degree of financial leverage is low, the firm’s earnings per share (EPS) will be less volatile, all other factors remaining the constant. The degree of financial leverage can be computed as follows:
- Degree of financial leverage = Percentage change in earnings per share
Percentage change in earnings before interest & taxes
From the computations we can see that the degree of financial leverage was very high between 2005 and 2007, but it drastically between 2007 and 2008. This means that the firm’s earnings per share have been very volatile but the volatility has decreased substantially over the years.
Degree of Operating Leverage
Operating leverage refers to the use of large proportions of both fixed and variable costs in the day-to-day running of the firm. The degree of operating leverage is a ratio that summarizes the effect of a specific amount of operating leverage on a firm’s operating profit, also referred to as earnings before interest and taxes (EBIT). The volatility of the operating profit also referred to as earnings before interest and tax, depends on the operating leverage. If the degree of operating leverage is high, the firm’s operating profit, also referred to as earnings before interest and taxes will be more volatile and if the degree of operating leverage is low, the firm’s operating profit, also referred to as earnings before interest and taxes will be less volatile, all other factors remaining the constant. The degree of financial leverage can be computed as follows:
- Degree of Operating = Percentage change in earnings before interest & taxes
Leverage Percentage change in sales
From the computations, we can see that between 2005 and 2007, the degree of operating leverage decreased then it increased again between 2007 and 2008. By the end of 2008, the degree of operating leverage was very high, meaning that the firm’s earnings before interest and taxes is very volatile.
Conclusion
Although Fujairah Building Industry’s performance has not been systematic in that it has been moving up and down, this can be attributed to external factors since the firm’s performance is still better than that of most firms in the industry. The company especially performs better than the other firms in the industry in terms of asset utilization, liquidity and debt utilization. This is evidenced by the asset utilization ratios, liquidity ratios, and debt utilization ratios. Something can however be done to improve the company’s profitability, since this is the area where Fujairah seems to be lagging in the industry, as shown by the profitability ratios.
Recommendations
I would recommend that investors maintain their investments in Fujairah since its performance is still better than that of most firms in the industry. The company’s return on equity is also better than most firms in the industry, and its earnings per share are also not so volatile. This makes it a better place to invest as compared to the other firms in the industry. They should however give the company time to stabilize before increasing their investments since the performance has not been very stable. This is especially because the company’s earnings before income and taxes are very volatile.
Fujairah’s management should also investigate whether they are getting a good deal at the prices of raw materials, and also research on whether their products are correctly priced. This is likely to improve their profitability, which is the only area where the other firms in the construction industry are performing better than Fujairah Building Industry.
Reference List
Block, S., Hirt, G., (2007). Foundations of Financial Management. Hill/Irwin: McGraw.
Bragg, S. (2007). Financial statement analysis: a controllers’ guide. John Wiley & Sons, Inc.
Erich, H. (n.d). Financial analysis tools and techniques: a guide for managers. Hill: McGraw.
Fridson, M, Avarez, F. (2002). Financial statement analysis: a practitioners’ guide. John Wiley & Sons, Inc.
Fujairah Building Industries. Company Profile (n. d) (online). Web.
Gulf Base. FBI Company Profile (n. d) Web.