Cost and Revenue Assumptions
In order to create an excellent pitch that would attract the interest of the target investors, thorough market research for a new product should be conducted. Through market research, the potential target market can be identified, preferences established, and competing products identified; hence, a customized product that would compete favorably in the selected market can be produced. Based on the market research, therefore, appropriate cost and revenue assumptions can be deduced (Bplans, 2009). Cost assumptions refer to the assumptions made regarding the expected future costs of running a business or organization (Reference for Business, 2011). These assumptions play a crucial role during the preparation of forecasting financial documents such as cash flow budgets and balance sheets. On the other hand, revenue assumptions refer to the assumptions made regarding the expected future revenues from net sales, interest, and any other increase in owners’ equity (Hinton & Diane, 2011). In our startup, for instance, it is an assumption that: costs and revenues are linear; costs are either fixed or variable; costs are only influenced by changes in activity; and that all manufactured units are sold (Reference for Business, 2011).
Cost and revenue assumptions are especially valuable because they expose the viability of a new product. Therefore, it is essential that workable financial plans are delivered to target investors alongside the cost and revenue assumptions. The new footwear product has fully incorporated essential factors and includes a high target market, market share, unit pricing, competitive advantage and the high sales forecast during the initial years of operation. The footwear industry, as observed from the conducted research, is growing quickly and attracts key investments in the industry (TGW Group, 2010). However, few manufactures have utilized this opportunity leaving this new product with high chances of entering and securing a large market share. Within the first three years of operation, therefore, we expect to obtain a market share of approximately 10 percent and sales revenue of between 200,000 and 300,000 British Pounds.
Marginal Costing Cost Statement
Marginal costing is a valuable financial accounting method that differentiates between the fixed and variable costs of products and often used during decision making (Drury, 2006). In connection to that, the marginal cost of a product refers to the variable cost of the product, which may include direct labor, material, expenses and overheads (Globusz, 2001). On the other hand, the marginal cost statement refers to a document that helps to realize the marginal costs and contribution margins right from the product. Relevant sources define marginal costing as “the accounting system in which variable costs are charged to cost units and the fixed costs of the period are written-off in the profit and loss account for the associated period” (Globusz, 2001). Since marginal costing is easy to understand, several managers use the method in presenting their accounting information.
Consequently, it is an excellent accounting approach that can be used to present the information to a group of potential investors that may not be familiar with most accounting systems because it is easy to understand (Drury, 2006). Furthermore, marginal costing does not apply fixed costs to the products and clearly shows the existing relationship between cost, price and volumes. Unfortunately, the method does not apply fixed costs to the products; thereby, creating a notion that such costs have no role in the production. Additionally, the application of variable operating costs depends exclusively on approximations, and it is hard to categorize costs into variable and fixed costs (Kinney & Raiborn, 2008). When using the marginal cost method, variable costs of production are barely allocated to products, which are then added to the stock evaluation. As such, the fixed costs of production remain unassigned to the product; however, they are taken as period costs that become directly transferred to the profit statement (Kinney & Raiborn, 2008). In this section, the marginal costing statement for the new footwear product is calculated and analyzed as shown in the following paragraphs.
Table 1: Tarco Footwear CompanyMarginal Costing Cost Statement.
As deduced from the marginal costing statement, the contribution margin is £ 5.7 per unit of the new footwear product. For the first year of operation, therefore, the contribution margin will be at £ 570,000 from the sale of 85,000 units. Consequently, a net profit equivalent to 15.44% (£ 210,000) of the sales figures results after deduction of fixed costs that amount to £ 360,000.
Break-Even Analysis
Several reputable sources confirm that breakeven analysis is a platform, which allows business leaders to generate informative financial documents: Severally, this occurs in organizations characterized by fluctuations in production and sales volume (Tutor2u, n.d). Therefore, breakeven analysis gives simplified highlights on the operations of a business, and can be used to deduce the future direction of such a business (Globusz, 2001). As mentioned earlier, marginal costing is a valuable financial accounting method, which also creates an effective working ground for breakeven analysis. Breakeven analysis, therefore, depends on the assumption that there will be no alterations on the sales outcome, as well as, the variable costs of the products. Additionally, the analysis holds that variable costs will be affected with changes in business activities; however, the fixed costs will remain unchanged (Berry, 2003).
During the preparation of breakeven analysis for businesses, therefore, it is inevitable that all financial calculations relate to these key assumptions. Otherwise, there shall be substantial deviations and unexpected results from the estimations already established by the business managers. In the long-term, however, the variable costs may be subject to changes resulting from alterations such as variations in direct labor efficiency among others. In breakeven analysis, the most critical part is the establishment of the breakeven point (BEP), which refers to the level of activity where there is no profit or loss in the business operations (Business Town, 2003). As shown in the following calculations, the breakeven point is established through dividing the fixed costs by the contribution per unit. The contribution per unit, on the other hand, follows the given method: Contribution margin per unit = Revenues per unit – Variable expenses per unit (Globusz, 2001). The breakeven analysis for Tarco Footwear Company is as given in the following calculations.
Fixed costs = £ 360,000
Contribution per unit = £ 5.70
Breakeven Point = Fixed Expenses/Contribution per unit
= £ 360,000 /£ 5.70
= 63,158 units
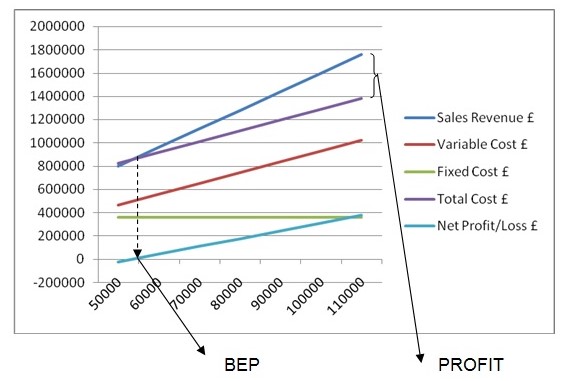
Therefore, this means that the business will reach its breakeven point after successfully selling 63,158 units of the new product (Berry, 2003). However, the business does not make any profit or loss at this point other than covering all the costs of production (Tutor2u, n.d). As such, the value of the breakeven units is essential in the determination of the breakeven point in sales value as shown below (Business Town, 2003).
BEP = (BEP Units x Sales price)
= 63,158 x 13.6
= £ 858,948.80
%BEP = (BEP Units x 100)/Capacity in Units
= (63,158 x 100)/85,000
= 74.30%
Table 2: Break Even Table for Tarco Footwear Company.
The data in the break even table (table 2), can further be represented graphically as shown in the following diagram.
Financial Documents for Tarco Footwear Company Limited
In this section, the financial documents of the proposed business venture “Tarco Company Limited” undergo a full analysis in order to highlight the potential financial position (Van, 2001). In particular, the cash budget, forecast income statement, and forecast balance sheet will be discussed in this section. As such, all the financial details required will be clear from the information that is about to be given. Firstly, the cash budget gives a clear picture as to whether the business venture can generate adequate funds from operations (Edwards, 1999; Peavler, 2011). Using the cash budget, therefore, it is possible to tell whether the business venture will be sustainable and generate substantial growth from the income (Ward, 2011; Peavler, 2011). Secondly, the forecast income statement captures the potential profitability of the business venture, which is useful for business decision making (Whited & Regassa, n.d). Lastly, the forecast balance sheet will indicate the financial position of the business venture at the end of the first year of operation. As such, these three documents are extremely valuable in determining the potential success or failure of an investment (Brigham & Joel, 2010). All the financial documents prepared for the proposed business venture “Tarco Footwear Company” can be found in the following pages. The operations of the proposed business will officially start in January 2012; hence, all the financial documents relate to the same period.
In order for business operations to commence, an initial capital of £ 200,000 is mandatory. This initial amount will be made available by the business founders; however, a further long-term loan of £ 370,000 will be necessary in order to have sustainable future operations. Tarco Footwear Company hopes to attract potential financiers that will accept the investment, which shall be repaid at an interest rate of 9.5 percent. Additionally, it is necessary to mention that the loan will be payable on a quarterly basis and over an estimated 5-year period. The proposed business will also make an asset investment of £ 360,000 that will include property, land and equipment in order to have the right platform for carrying out all operations. During the first year of operation, the venture will rely on rented premises before attaining its own premises in the future years. Therefore, overheads in terms of rent arrears will exist and will amount to £ 90,000 for the first year of operation alone. In the future, this figure will substantially reduce as the venture will be financially healthy to acquire its own business premises. Table 3 below shows the cash budget for the proposed venture.
Table 3: Monthly Cash Flow Budget Forecast Statement for the Year 2012-13.
As shown from the cash budget, the business will generate £ 250,680 of cash after settling 200,000 of the long-term loan. Since the cash is substantial, it will allow the smooth operations of the company over the following months of the 2013 financial year. This further indicates the potential of the business to generate enough funds for reinvesting in the venture. Additionally, the overall profits reflect an 18.4 percent value of the total sales which lies within the standards in the footwear industry.
Table 4: Forecast Income Statement for the year ending 31st December 2012.
Table 5: Forecast Balance Sheet as at 31st December 2012.
Business Plan for the Proposed Venture
Tarco Footwear Company
From_____________________________
Us_______________________________
To_______________________________
Name Financiers Limited________________
Presentation of a Business Plan for a New Footwear Product
Over several years, several manufacturers in the footwear industry have made unrealistic assumptions on what the market needs or what people want for their footwear products. Several sources indicate that most manufacturers of footwear products lack in one way or another in their attempt to satisfy the customer. While some product may be durable, for example, they may be too expensive for the customer or be available in just a few sizes (Cagan, 2007). On the other hand, several manufacturers have not factored in the key changes; hence, some of their product may just become obsolete without their knowledge. These are just some of the few cases that we noted during the recently conducted research on the footwear industry, including the target market and possible future trends. The new product is a unique design of rubber sandals that will be available for both sexes, which can be used for all weather. The product shall be made from an identified cheap, but durable material and will allow the production of high quality affordable sandals for all generations. Through this proposal, we hope that Tarco Footwear Company will successfully secure a financier to enable production and marketing of the new product.
The new footwear product is an all-generation, all-sex, durable, but affordable sandal design that would fit the needs and preferences of the target market. As mentioned earlier, recent market research confirmed that several footwear products do not meet the full requirements of the end users. As such, the management at Tarco has developed strategies aimed at meeting such requirements by providing the ultimate product (Collis, & Hussey, 2007). The material for the sandals is cheap and readily available, and necessary tests have been conducted to show its durability. The results confirmed the product’s ability to remain durable in all weather, while keeping the user as comfortable as possible.
Business Plan
The market research conducted in ten jurisdictions and yielded appealing results, and gives us much hope that the launch will be a complete success (Infrasystems, 2008). The older generation rated high among the potential target market since the findings showed that most footwear manufactures slightly neglected the group, while venturing substantially in the younger generations. Additionally, older men showed more interest in the product than women and children since they had few varieties, which just meet their leisure requirements. All the groups, however, showed a significant level of interest in the new design, and we expect that substantial sales can be realized just from the initial years. Since the product will be favorably low-priced as compared to the expensive brands that currently flood the market, we expect to attain a large market share in the short-term period. The marketing mix for the company is highlighted in the following paragraphs, which include product, price, promotion and place respectively.
Product
The new product assumes the name “Tarco Sandals”, as derived from the name of the company “Tarco Footwear Company”. Tarco Sandals meet the needs of all the generations; hence, it is a prediction that the product will compete favorably in the footwear industry (Infrasystems, 2008). The sandals will be produced from a readily available material that is durable and all-weather resistant. Additionally, the product is of high quality and meets all the health standards as stipulated by the law. In order to attract a wider market, the sandals will be available in several color and sizes with the possibility of accepting any customizations for the customer (Kotler, 1974).
Price
The proposed product, unlike current products selling in the market, will be cheap and an affordable option for the identified target market. As such, the product will compete well against several products that fall in the highest segment in terms of price. Since the product is of high quality, yet affordable, there are high chances that a significant market share will be attained within the first year of operation. The company will rely on two pricing strategies namely penetration pricing and psychological pricing (Tutor2u, n.d). Penetration strategy ensures that the starting price are low enough, while psychological strategy makes the buyer feel that the product is lower than it is; for example, listing a pair of sandals as £10.99 instead of £11 (Tutor2u, n.d). Later on, other pricing strategies will be used basing on the condition of the market.
Promotion
In order for the product news to reach the target market in an effective and considerable short period, several marketing strategies have been established for the purpose (Cagan, 2007). Initially, we expect to reach a portion of the target market through commercial advertisement that will be aired in the local television stations. The commercial will show people of all genders and age groups using the “Tarco Sandals”, and giving the benefits realized from the product. Additionally, brochures and catalogs giving sufficient details on the products will be distributed for every purchase of the product. Furthermore, internet marketing will be used appropriately where people may be able to view the whole varieties of the product from the website and write reviews. With increased business and revenue, other sophisticated methods of advertising such as issuing of weekly magazines to potential clients will arise.
Place
The target market should have a continuous supply of the product in order to ensure that all the local stores have sufficient stocks. This will ensure that the supply remains sufficient and that customers remain loyal to the company as a result of efficiency (Cagan, 2007). As such, independent contractors or dealers will deliver the products to various locations. This will ensure that the service runs well as the contractors will have to meet stipulated rules for a successful cooperation. In the future, more sophisticated means such as online purchases will be acceptable at slightly higher costs.
Financials
As previously established from the financial documents, the business venture requires a start-up capital of £ 570,000. Out of this, the proposal expects to raise a total of £ 370,000 while the owners will source for the remaining £ 200,000. The investment is feasible as it has a payback period of 2.5 years, when all the financial loans shall be catered for in full (Collis, & Hussey, 2007). This means that all the loans will have been paid by this period while growth takes on a stable position. In the first year alone, the venture is estimated to generate a gross of £ 185,000, which qualifies for an income tax of £ 18,500,000. As such, the company will attain a surplus of £ 250,680 which offers a safe operating margin. Hence, the business will be in the safe margin as most manufacturers within the industry lie within the mentioned bracket. Additionally, the profit from the first year reflects to a value of 18.5% return on the initial investment of £ 570,000. Further financial details can be obtained from the financial documents attached in the appendix section of this document.
Conclusions
As established in the previous sections, the new product will be durable, affordable and of high quality. Also, the product meets the needs for all age groups, as well as genders; hence, has enormous potential in the footwear market. Additionally, the material used for the design makes it an all-weather product, which is not the case with many footwear products. Therefore, it is highly likely that the product will revolutionize the footwear industry and earn fame to the company. From the financial analysis, the results indicate that the investment is feasible and has immense potential of generating a substantial income within a short period. In conclusion, the business venture has an excellent indicator of a successful future, and any investment in it should be considered a perfect decision.
References
Berry, T. (2003) Breakeven Analysis. [Online]. Business Knowhow. Web.
Bplans. (2009) Clothing Manufactures Business Plan. [Online]. Bplans. Web.
Brigham, E. and Joel, H. (2010) Fundamentals of Financial Management. Southern-Western: Cengage Learning.
Business Town (2003) Accounting Projections: Breakeven Analysis. Web.
Cagan, M. (2007) Product Management vs. Product Marketing. Web.
Collis, J. and Hussey, R. (2007) Business Accounting: An Introduction to Financial and Management Accounting. Basingstoke: Palgrave Macmillan.
Drury, C. (2006) Cost and Management Accounting – An Introduction. USA: Cengage Learning.
Edwards, D. (1999) Cash Budgeting Leads to Better Cash Management. Web.
Globusz (2001) Basic Cost Concepts. [Online]. Globusz Publishing. Web.
Globusz (2001) Breakeven Analysis. [Online]. Globusz Publishing. Web.
Globusz (2001) Marginal Costing and Absorption Costing. Web.
Hinton, K. and Diane, C. (2011) The Fundamentals of Revenue Forecasting. [Online]. Pragmatic Marketing. Web.
Infrasystems (2008) Product Marketing Defined. [Online]. Svproduct. Web.
Kinney, M. and Raiborn, C. (2008) Cost Accounting: Foundations and Evolutions. New York: Cengage Learning.
Kotler, P. (1974) Marketing Management. 2nd ed. New York: Prentice Hall.
Peavler, R. (2011) Financial Forecasting for Your Small Business. [Online]. Bizfinance. Web.
Reference for Business (2011) Cost-Volume-Profit Analysis. [Online]. Encyclopedia of Business. Web.
TGW Group (2010) NG2 Builds largest Automated Logistics Centre in the Eastern European Footwear Industry with TGW. [Online]. TGW Group. Web.
Tutor2u (n.d) Marketing: Pricing Approaches and Strategies. [Online]. Tutor2u. Web.
Tutor2u (n.d) NG2 Introduction to Breakeven Analysis. [Online]. Tutor2u. Web.
Van, J. (2001) Fundamentals of Financial Management. Horne and John Martin Wachowicz: Prentice Hall.
Ward, S. (2011) Small Business Canada. [Online]. Sbinfocanada. Web.
Whited, H. and Regassa, H. (n.d) Forecasting an Income Statement and Balance Sheet: A Case Exercise for Beginners. [Online]. Colorado State University. Web.
Appendix
Table 1a: Monthly Cash Flow Budget Forecast Statement for the Year 2012-13
Table 2a: Forecast Income Statement for the year ending 31st December 2012
Table 3a: Forecast Balance Sheet as at 31st December 2012