Economic Environment
Pembina Pipeline is a Canadian company that operates in the oil and energy industry and is currently based in Calgary, Canada. The company operates a network of oil and natural gas storage and transportation infrastructures throughout Canada. The company also owns and operates oil and natural gas processing facilities in Canada.
The brief discussion that this paper will focus on and the type of industry where it operates as an important one, because it sets the direction of the discussions that will be done in the succeeding sections and subsections, especially from a macro-environmental and industry analysis standpoint. In terms of the geographic focus of the discussions, it will be constrained to Canada, because the company is stationed in Canada. Despite the company’s intentions to expand to the US market, its current production is primarily locally oriented (Pembina Pipeline 2020).
Relevant Trend
Opportunity: Real GDP Per Capita: Pembina Pipeline’s main market is still Canada. It has, however, been very keen on diversifying. The company has, in the past years, set its sights on regional markets like the USA.
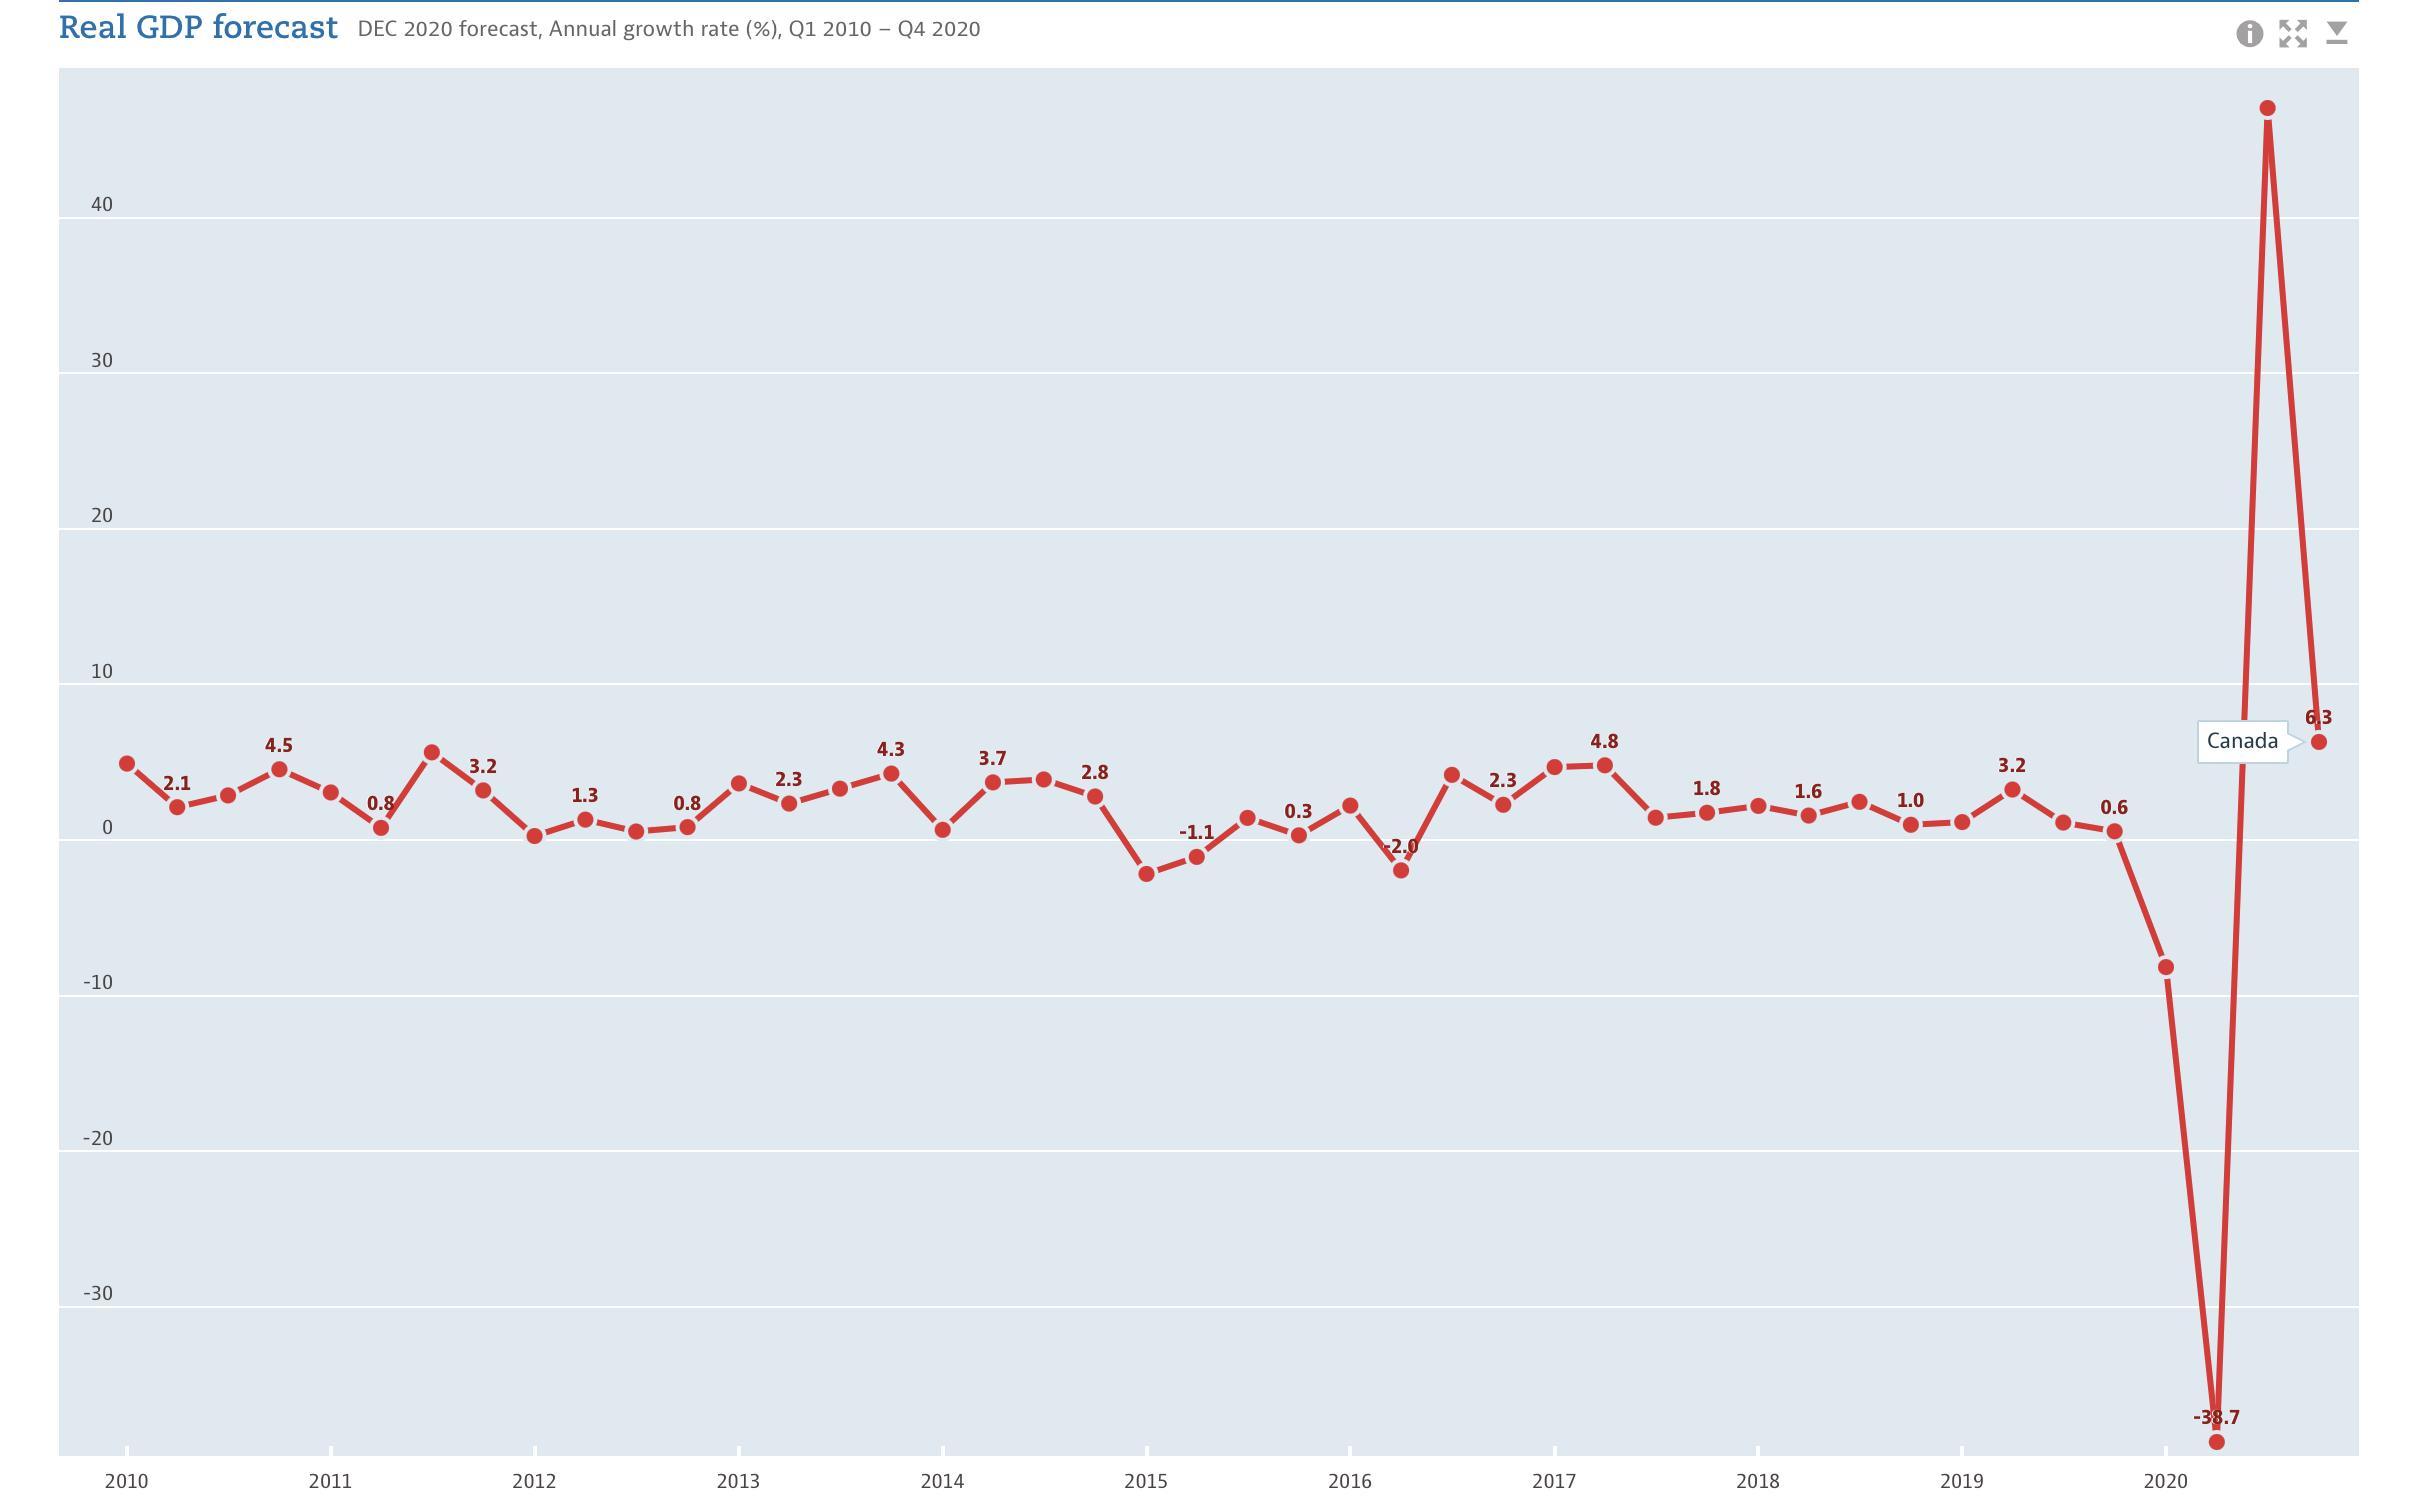
Figure 8 shows the movement of the annual real gross domestic product (GDP) annual growth rate figures in Canada from 2010 to 2020. It can be observed in Figure 8 that there has been a consistent increase in real GDP growth rate in Canada, and that there has been a sharp downturn in real GDP per capita in 2020 for Canada. This can be attributed to the global pandemic that took hold between second and fourth quarters of 2020, and resulted in the implementation of extreme lockdown measures, disrupting the flow of goods and services, and thereby hurting the country’s economic outcomes. There had already been a sharp bounce in real GDP per capita growth in the last quarter of 2020, but the bounce is not yet enough to offset the net losses that have been realized in the past year.
GDP is an important macroeconomic indicator to look at for a company like Pembina Pipeline because this determines how suitable the consumers in a particular geographic market are as targets for certain products and services. Luxury products that cost significantly more than their non-luxury counterparts, for example, would sell at higher rates in countries that have a higher GDP. A good example of a country with a high GDP for companies that sell access to pipelines is the USA. Then again, there is more to sales and marketing outcomes than just a country’s GDP per capita. This leads the discussion to the next section which is disposable income per capita.
Opportunity: Real Disposable Income Per Capita: Disposable income is a metric that measures the amount of money that a household or an individual saves or spends from their annual personal income after income taxes and other statutory and state-mandated deductions have already been factored in.
The rationale for including a real disposable income per capita analysis in this macroeconomic analysis is the same as the reason for including GDPPC (in the previous section). Theoretically, a high RDIPC is an indication that the consumers in the geographic market that is being examined are wealthy. This is an important factor to consider for companies that are planning to bring in products and services that have a high price tag. These companies essentially have to make sure that their target market has enough disposable income to afford their products and services.
Canada has a higher level of RDIPC among the developed economies. According to figures that have been released by the OECD, the average net adjusted disposable income per capita among OECD countries is $30,563 per year. Countries that are included in the OECD list include the USA, Luxemburg, Canada, Austria, Germany, Mexico, and Chile.
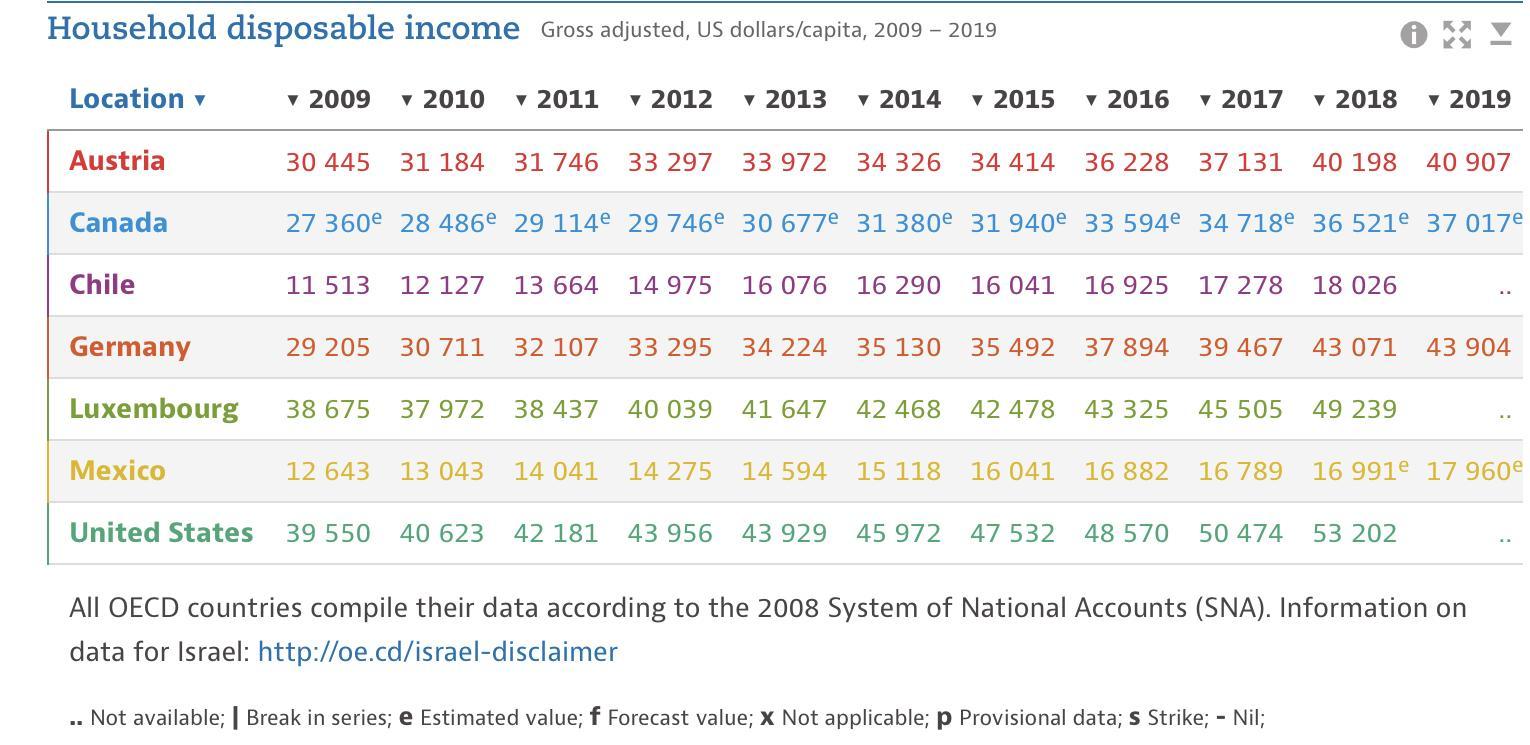
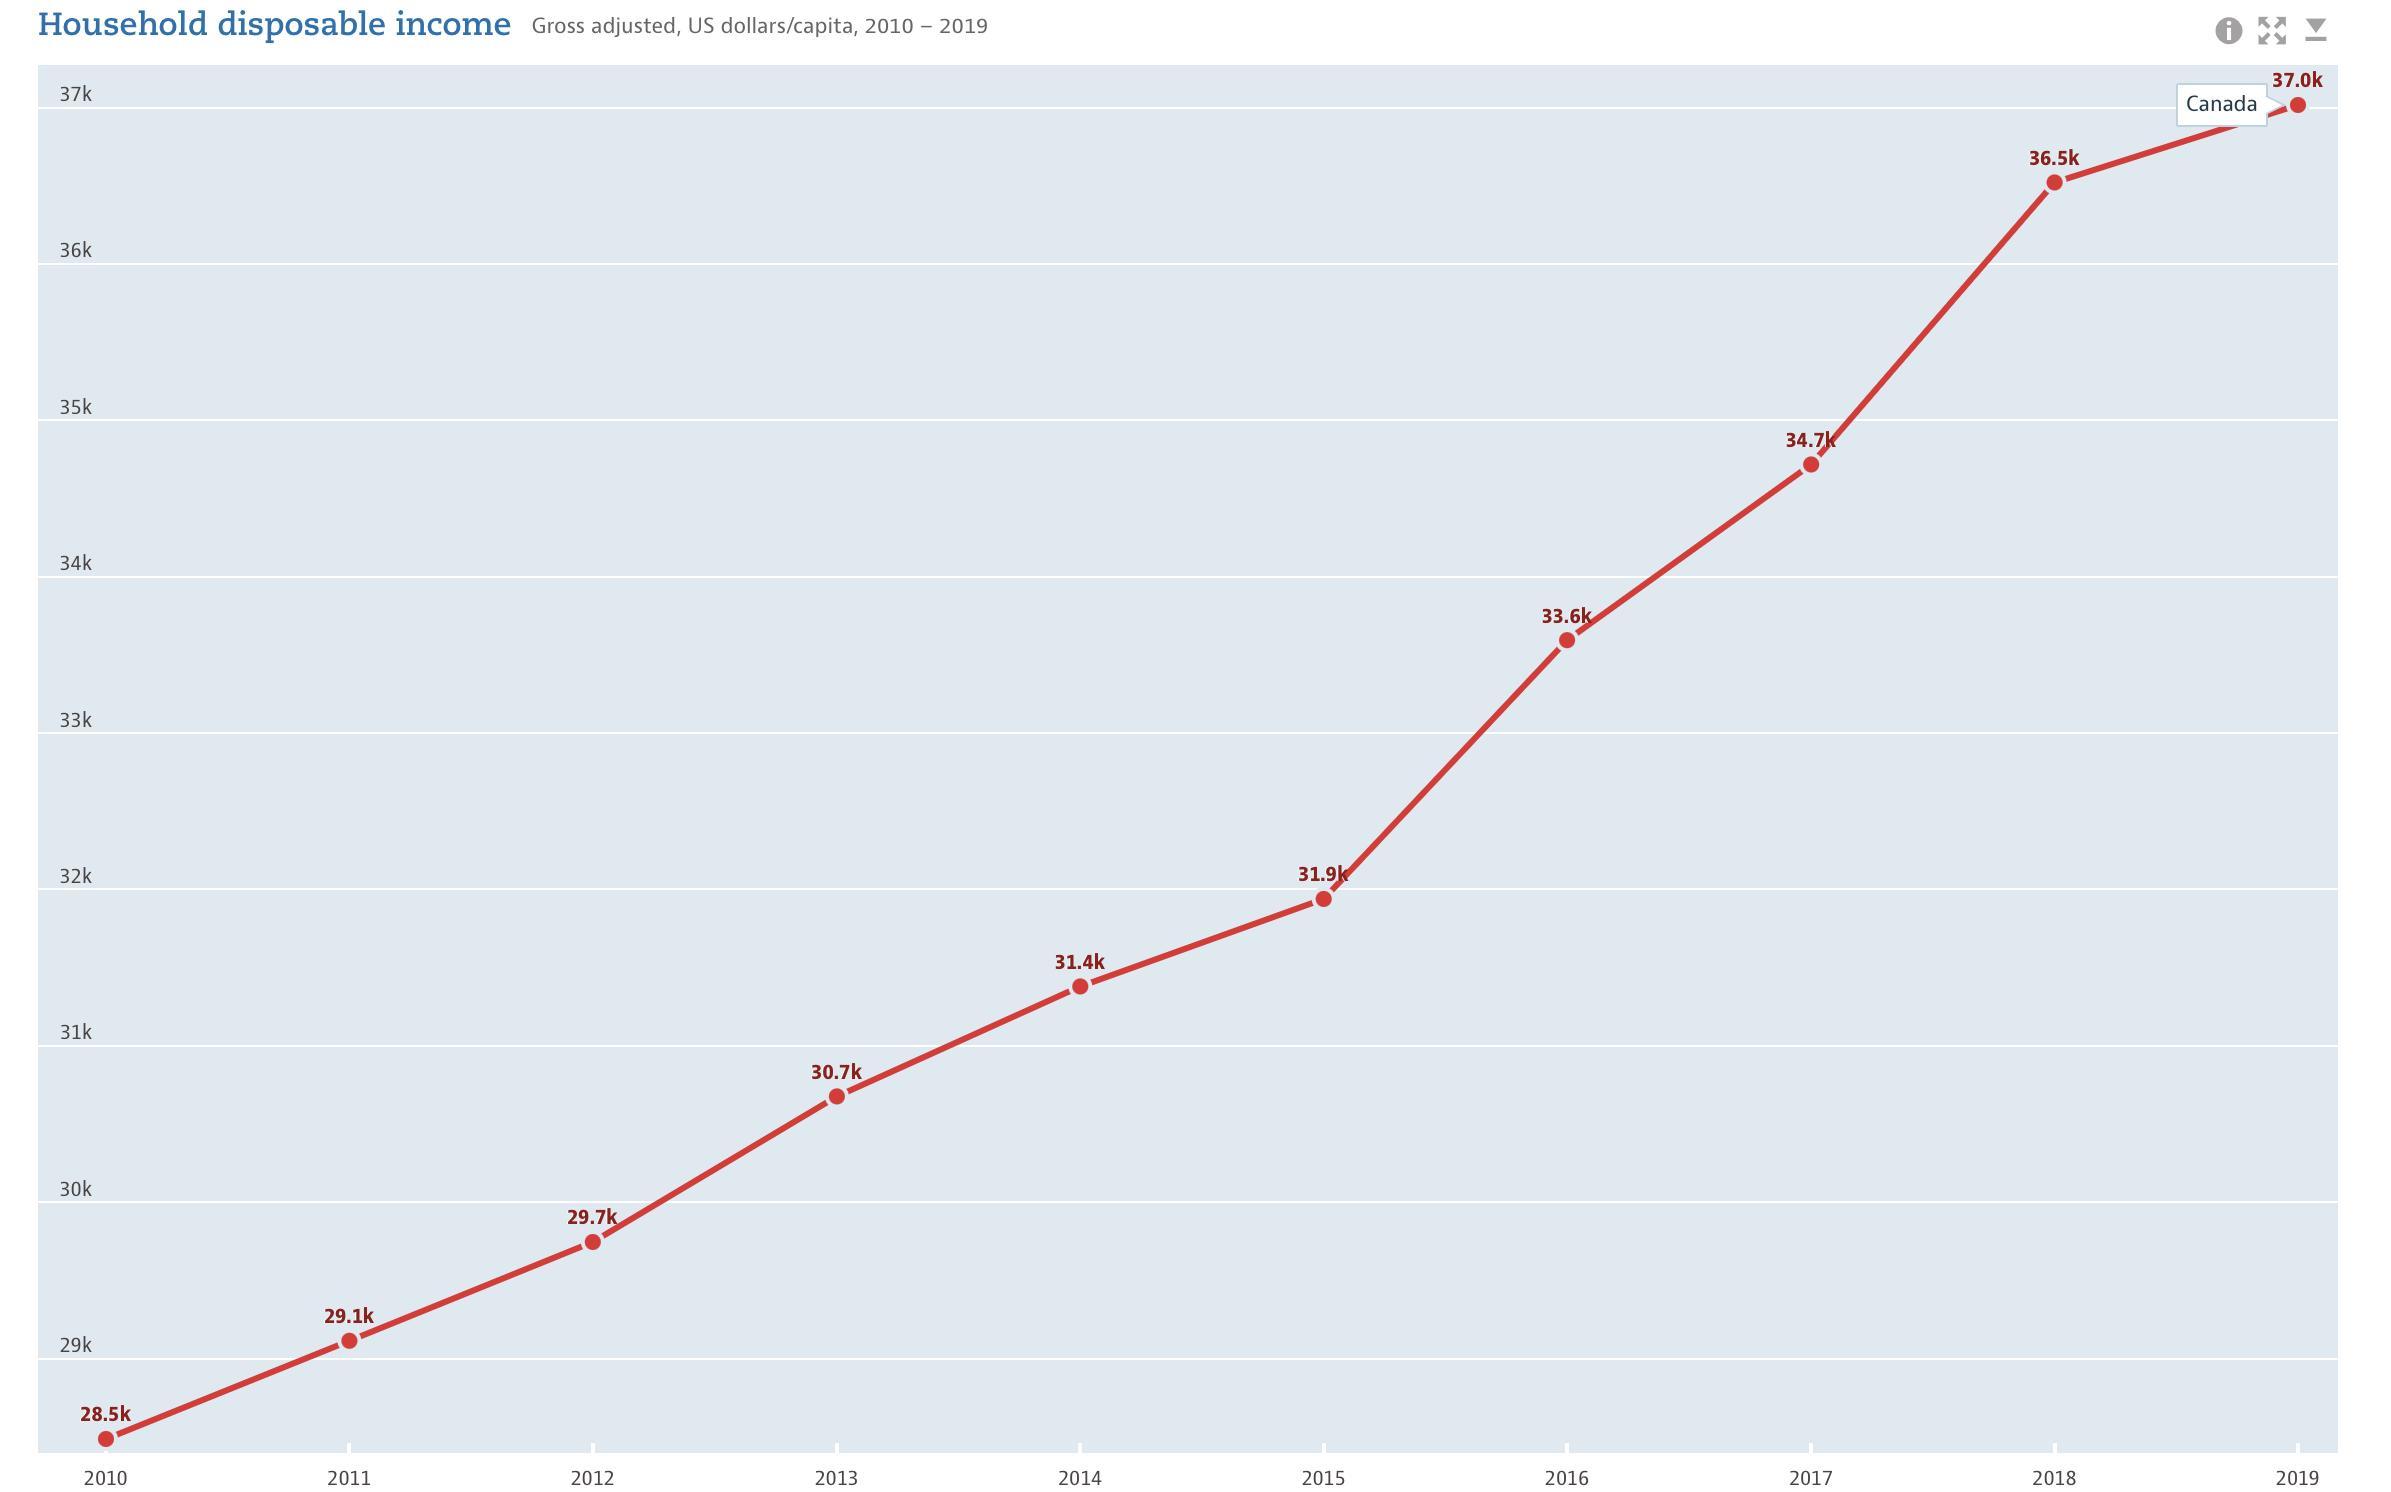
Figure 9 shows the RDIPC among OECD countries in the past ten years. Based on a year-end report from Statistics Canada, the Canadian household disposable income annual growth rate has a large fluctuation range, the drastic reduction of disposable income per capita that occurred in the third quarter of 2020 reflecting the effects of COVID-19. The second quarter of 2020 reaches the peak of disposable personal income at $1,474,308 million (Canadian dollars (CAD)); then the third quarter drops to $1,416,188 million (CAD) (Statistics Canada 2020), which can again be attributed to the global health pandemic. Despite this, the country still has a high disposable income per capita compared to other developed countries. This makes it an attractive target for companies that are planning to bring in products and services that only high income people can afford.
Opportunity: Retail Sales Per Capita: The latest data available on Canada’s total retail sales per capita was for 2020. However, the report had to make some computations, because the data was not readily available. Retail sales per capita can be computed by getting the total retail sales for the year and then dividing it by the number of people in the country. In this case, the total retail sales that were recorded for August of 2020 was $53.2 billion (CAD) ( Statistics Canada 2020).
In order to obtain the annualized figure, the researcher multiplied this by 12, resulting in a figure of $638.4 billion (CAD). The current population in Canada is approximately 38.1 million. This means that the retail sales per capita in Canada stands at around $16,755 (CAD). What this means is that in Canada, people’s annual spending on various goods and services, on average, sits at around $16,755, which is in a higher level compared to other countries. This is an important factor for a company like Pembina Pipeline to consider before expanding their corporation away from Canada, because they must ensure that the consumption of people in the existing market is sufficient for them to expand into new target markets, so that they can afford their oil and gas products and construct new networks of pipelines.
Threat: Consumer Price Index: The consumer price index (CPI) is a measure of inflation, as it is reflected by the prices of basic goods and commodities—that are included in the consumer price index. This can vary from one country to another. This CPI analysis is specific to Canada.
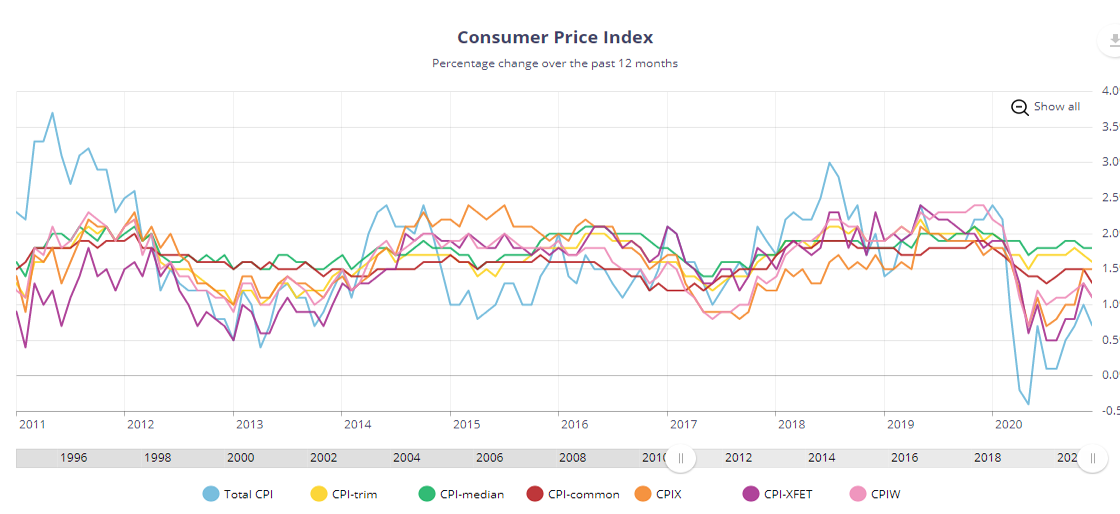
The figure above shows the Consumer Price Index movements in the last ten years, from 2010 to 2020. This data set was derived from the Bank of Canada (2021). The data from the chart above shows that the Consumer Price Index was relatively stable from 2010 to 2019. The CPI suffered from a sharp downturn in 2020. There was even a slight deflation in terms of the total CPI for a brief period in 2020. This can be attributed to the Covid-19 pandemic and its negative effects on the economy. A lot of people lost jobs, and as a result, consumption of goods and services went down, leading to a suppression inflation.
Threat: Consumer Confidence Index: Consumer confidence index (CCI) is a metric that measures the level of confidence that consumers have in the economy. This is a metric that can be used to assess and even predict consumer behaviors. In general, a higher CCI is better, because that means the economy is poised for growth, as opposed to when the CCI is on a decline.
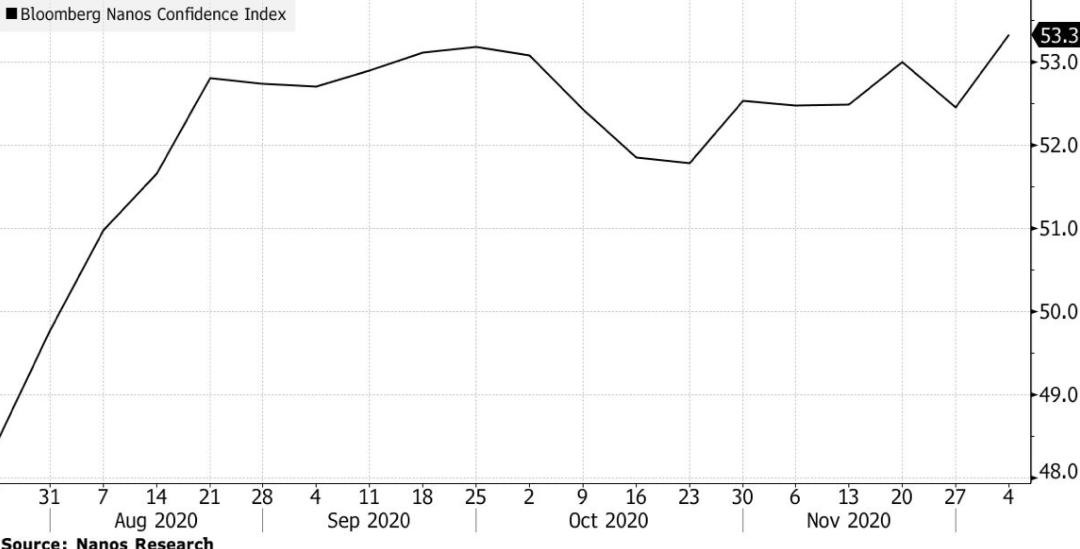
Hagan (2020) reported on the Canadian CCI in 2020. It was revealed in the report that the Canadian CCI tanked sharply in 2020, as a result of the Covid-19 pandemic. It has, however, recovered in the 4th Quarter of 2020 and into 2021.
Home Ownership: The prediction of consumer behaviors is undeniably correlated with the consumers’ economic safety and stability. Thus, one of the most beneficial ways to define such a stability rate is to examine the number of residents who own their homes. According to the 2019 Statistics Canada report, in 2016, nearly 63% of Canadian families owned their principal residence, with the tendency gradually increasing over time due to the quotient of older adults in the state (Uppal). However, despite the promising outcomes, the modern home ownership situation is affected by the notion of the pandemic. Moreover, the mortgage debt rates also continue to increase, providing people with accommodation yet limiting them in terms of consumer behavior patterns.
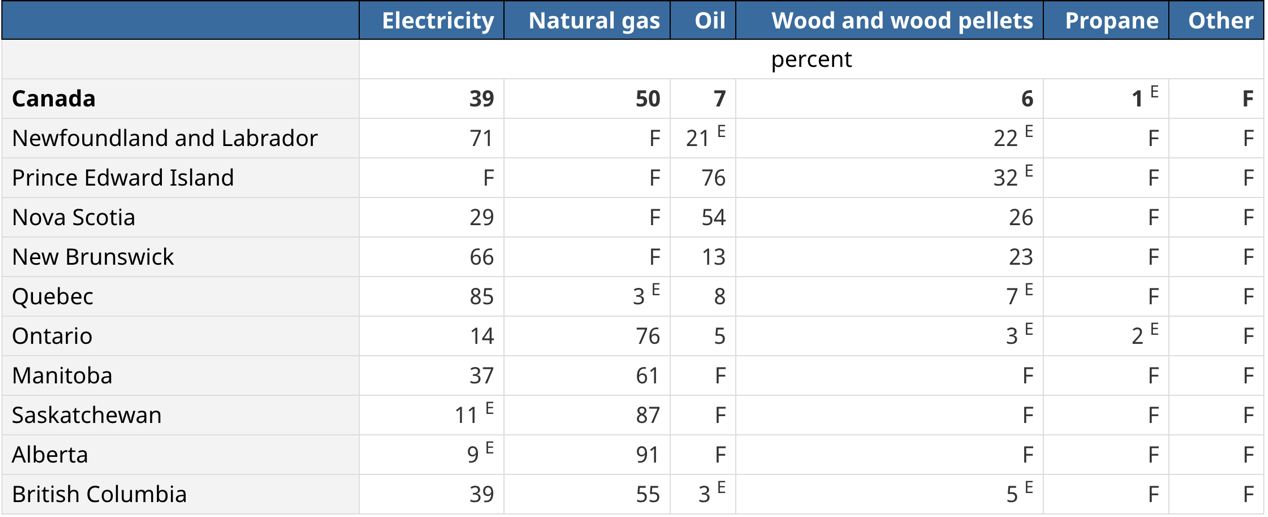
Threat: Consumer Heating Patterns: Today’s context of environmentally conscious house heating has become unprecedently popular with developed areas such as Canada and provinces. Thus, a growing number of homeowners are trying to use alternative energy for heating in order to preserve limited natural resources, even if it means larger financial investments. Thus, according to the publicly available data provided by Statistics Canada, nearly 39% of households in the country are heat fueled by electricity, as opposed to 37% in 2007. The percentage of natural gas and oil use remains approximately the same yet does not increase. Moreover, considering the forecasts in terms of resource limitation, the situation is likely to deteriorate in the near future.
Mezzanine or Sector Level Data
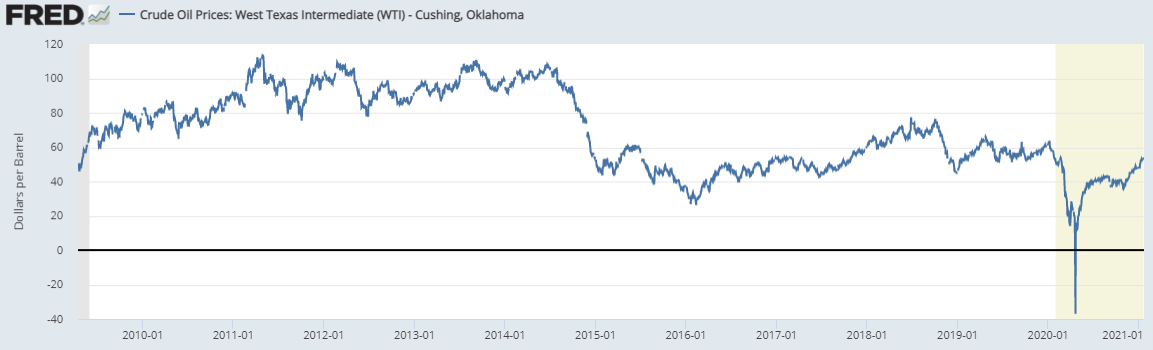
Opportunity: Commodity Prices: In the analysis of commodity prices, the researcher looked at the price of oil. This was derived from the Federal Reserve Bank of St. Louis, i.e., FRED. The outcome of the operations of companies like Pembina Pipeline will depend on the price of its core commodity, which in this case is oil.
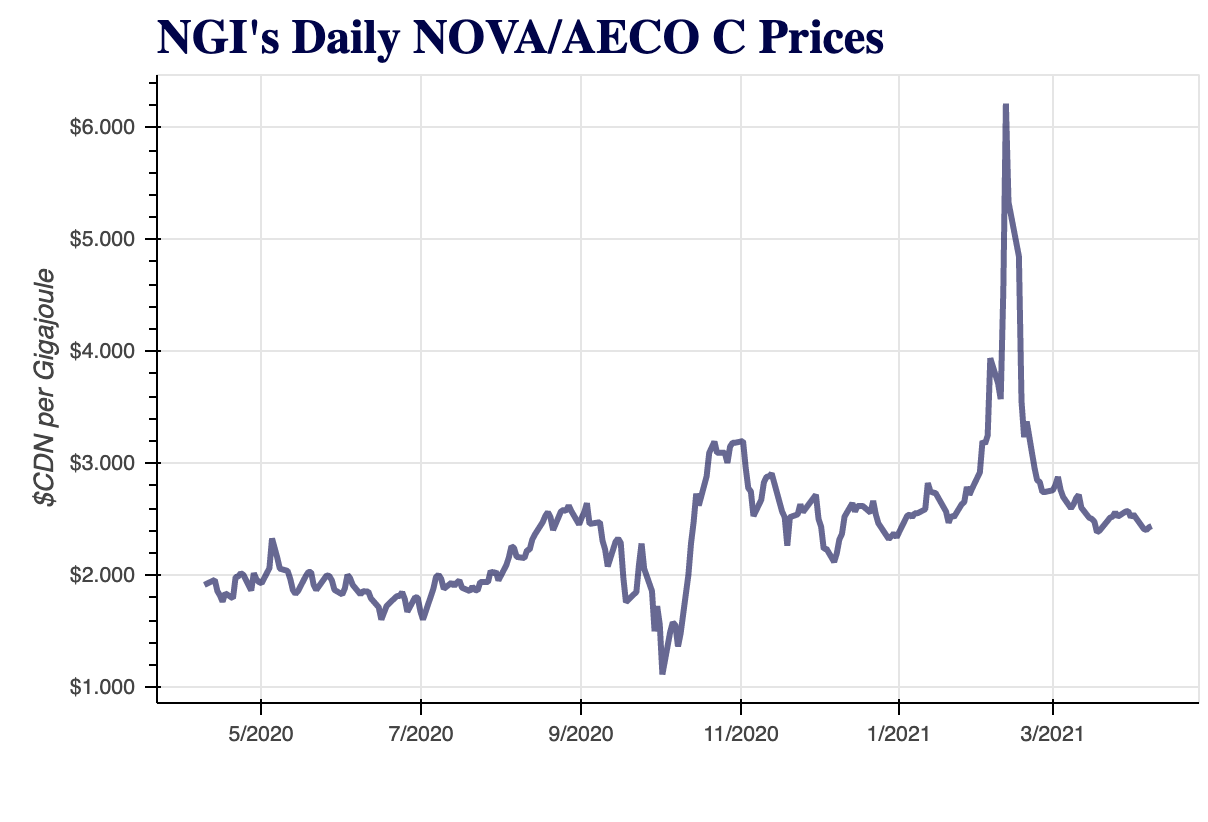
Threat: Natural Gas Price: Since natural gas is a major commodity required by the Pembina Pipeline to operate, it is imperative that natural gas is affordable yet profitable. According to the most recent data presented by Henry Hub, an interstate natural gas distributor, the price for natural gas has decreased rapidly since February 2021 (Figure 15).
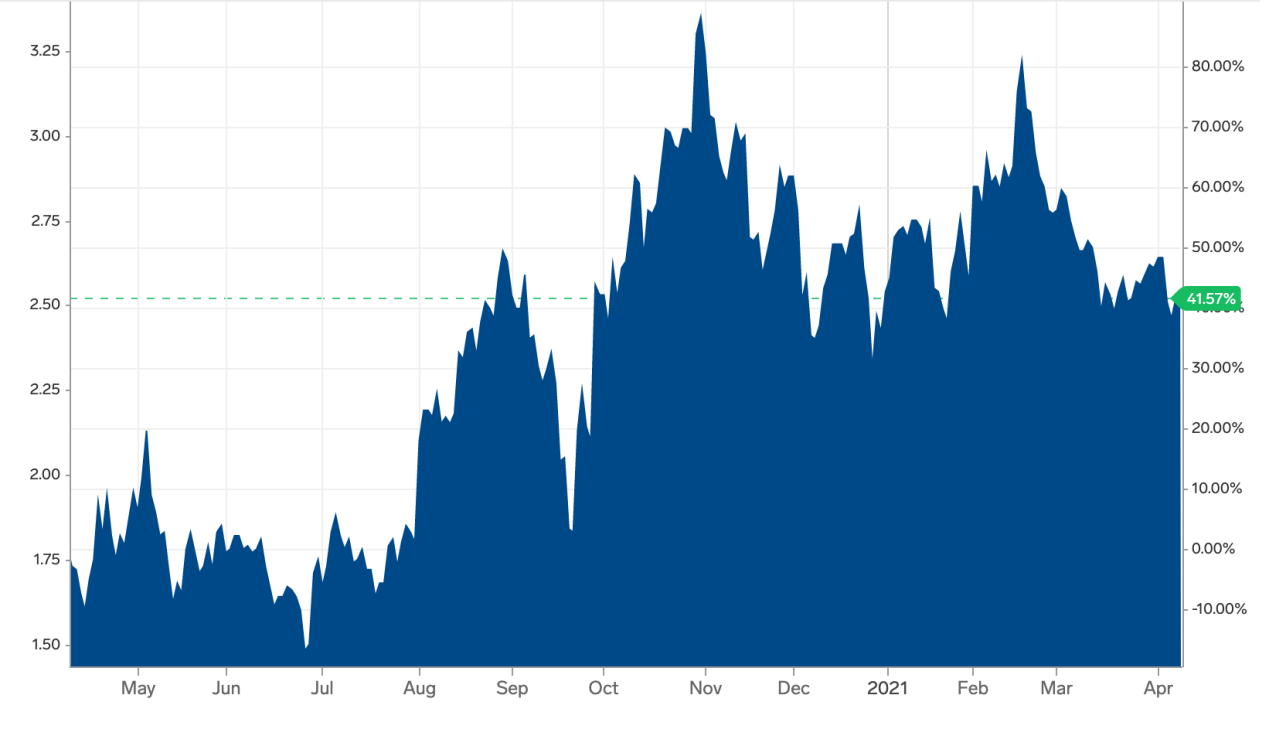
Although there have been no significant price modifications over the past month, the instability of the situation puts companies such as Pembina Pipeline at a disadvantage of being unable to secure a steady income. When speaking of Canada in particular, the situation is not different, while the price for gas may be even slightly lower when converted to the USD: ~ $2,1 per 0,9 MMBtu (Figure 16).
While such a tendency is, by all means, beneficial for potential consumers, natural gas plays a crucial role in the formation of state GDP. Hence, once natural gas price continues to decrease, GDP will be affected, resulting in long-term negative outcomes for the population. Individual residents, being major consumers of the final product, may eventually be unable to meet the company’s expectations in terms of consumption rates.
Threat: Prices of Major Inputs to the Chosen Industry: Pembina Pipeline operates in the midstream segment of the oil and natural gas industry. This is by virtue of the fact that it owns and operates a network of pipelines, which can be classified as support or auxiliary infrastructures. Still, the major input to this industry would still be oil. Pembina Pipeline, for example, has a network of oil and natural gas refinement and processing facilities in Canada. These facilities take in crude (unprocessed) oil as its input, and put out processed oils such as gasoline, diesel, and other types of fuels as outputs. The prices that Pembina Pipeline can set for its products and services, therefore, are going to depend on the price of oil. The same can be said of its profit margins.
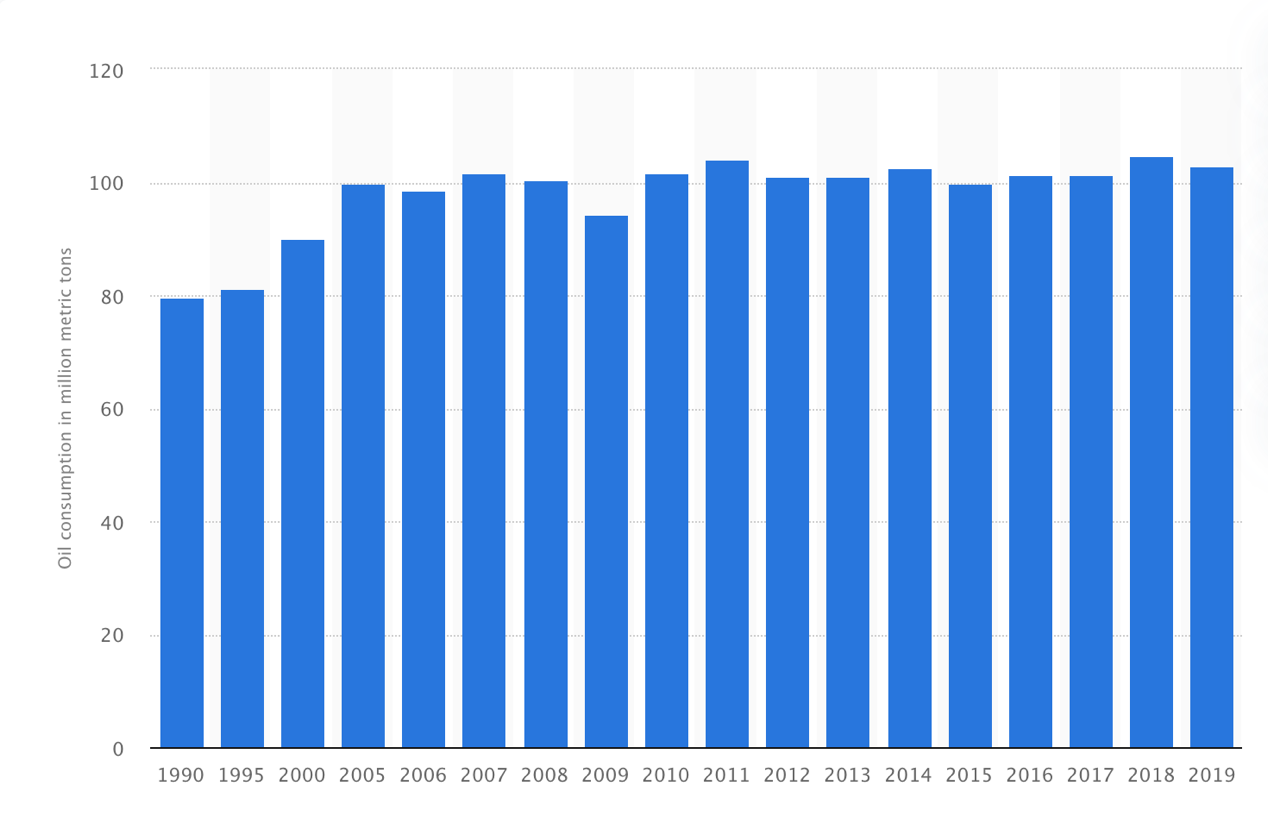
Annual Consumption in the Industry: In June 2020, the Statista research led by N. Sönnicksen was released, covering the Canadian patterns of annual oil consumption over 1990-2019. According to the research, in 2019, the country consumed nearly 102.8 million metric tons of oil. Following the global tendency, the consumption rates decreased since the previous year, which constituted 104.8 million metric tons (“Canada: Oil Consumption 2019 | Statista”).
Natural gas consumption, in its turn, appears to become more relevant over the past years. According to the data, Canadians consumed 4,394,632 cubic feet of natural gas in 2017, compared to 3.8 million cubic feet in 2016 (“Canada Natural Gas Reserves, Production and Consumption Statistics”). This increase leads to the indicator of 328 cubic feet per capita every day. When compared to the global indicator of 48 cubic feet per capita, it may be concluded that Canada’s demand for natural gas poses a benefit for the industry. The oil consumption, in its turn, is undergoing a decline, and it should be taken into account by the company.
Threat: Capital Investment Trends in the Sector: Deloitte University Press (2020) recently published a report where they followed the capital trail in the oil and gas industry. The objective in the aforementioned report was to paint a picture of the capital investment trends in the oil and gas industry, which is an important thing to do, considering how fast the growth of other industries, renewable energy industry—for example, is accelerating.
In the report, the authors concluded that the global oil and gas industry is currently facing a downtrend in terms of capital investments. This can be seen in one of the charts that they presented in the report below.
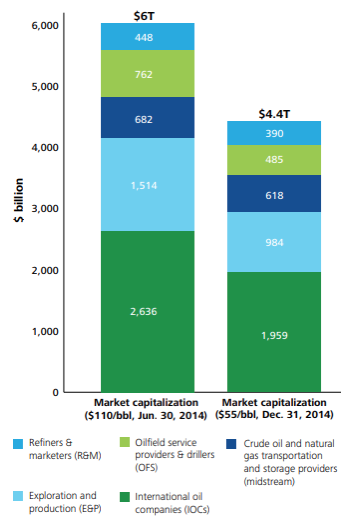
Initially, the target was to collect data within the last three years (that is, from 2017 to 2020). This, however, is not a practical target when analyzing capital investment trends, because it usually takes a coupe of years before these trends emerge, which is why the latest highest quality data that the author of this paper was able to obtain was for the year 2014 (Deloitte University Press 2020, 5). Figure 6 shows that there has been a sharp decline in the market capitalization of companies that are operating in 2014 alone, from a high of $6 trillion to just $4.4 trillion, with just a quarter in between them. In 2020, it would be safe to say that the market capitalization rates have already recovered, but not nearly enough to enable the affected companies to enjoy the same level of market capitalization that they used to have when oil was trading at around $110 per barrel. For reference, oil is trading at around $50 per barrel at the time of writing.
Analysis of a Report for the Next Two Years the Oil Industry
For this section, this report used the Deloitte University Press report about the future of the oil and gas industry. This was one of the subjects that they touched in their 2020 report about the industry. One of the metrics that they used as the basis of their projection of what the future of the oil industry would look like two or even more years from now is the ratio of the capital expenditure and dividends to operating cash flow. A ratio of 1.0 means that a company’s internal cash generation equals cash flow. A ratio of more than one indicates that the company’s Capex and dividends value is more than that of the OCF; a ratio of less than one indicates that a company’s internal cash generation outvalues its capex and dividends. Now, in the Deloitte University Press report, the analysis was done on a per country basis.
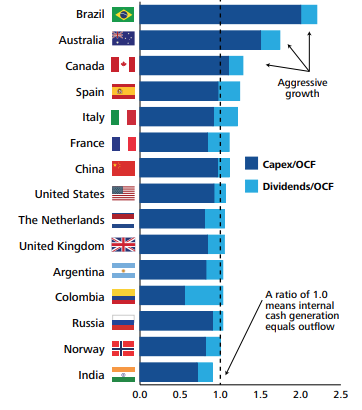
The figure above compares the different countries in terms of their capex and dividends to OCF ratio. A high ratio (above 1.0) is usually an indication that growth is being anticipated. This is a side by side comparison of different countries with a sizable oil industry. It can be seen that topping the charts are Brazil, Australia, and Canada. This is a good thing for PP, because most of its operations are still stationed in Canada, at least for now. The USA is somewhere in the middle, which may not bode very well for PP, because the company has in the past years set its sights on expanding its reach in North America.
Despite this, however, the author of this paper still believes that the oil industry is going to face an extremely challenging future, mostly because of the fact that there has been a consistent period of high supply and relatively meek demand.
This is something that can be observed not just in Canada and the USA but in the rest of the world as well. A large part of the industry’s future growth would most likely be determined by the outcomes of the Covid-19 pandemic. The most important questions to answer would be what the new normal would actually look like, and how that new environment would affect the processes and operations in the oil and gas industry, particularly those that are operating in the midstream segment, e.g., Pembina Pipeline. Another important question to answer would be when the Covid-19 pandemic would be resolved. Naturally, the sooner the pandemic gets resolved, the better, because that would mean that businesses would already be able to go back to normalcy, and maybe even recover. The longer the Covid-19 pandemic drags, the gloomier the estimates would most likely be.
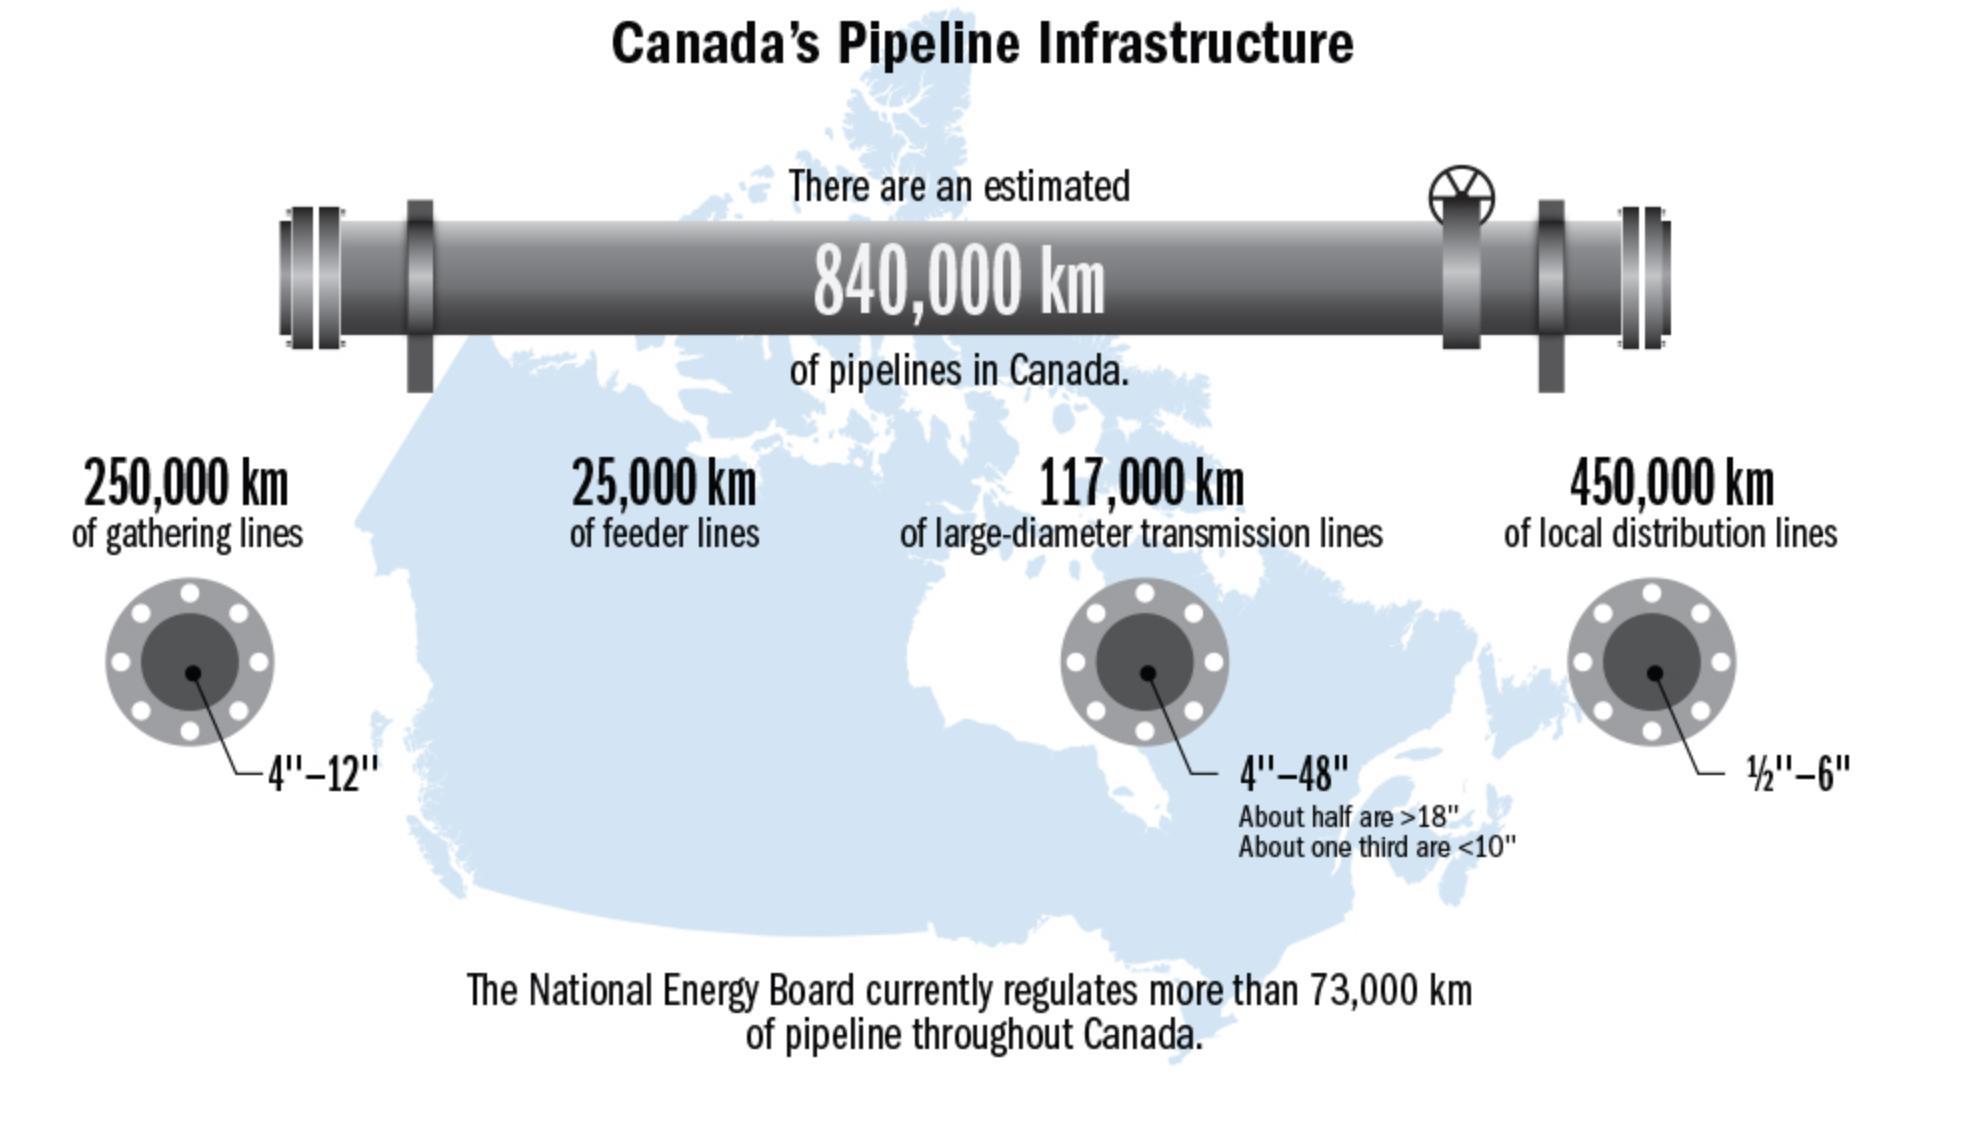
Pipelines in Canada: According to the Government of Canada (2020), there are over 840,000 kilometers of pipelines in use.4 The figure below reveals how Canada’s Pipeline Infrastructure is distributed in Canada. There are 117,000 kilometers of large-diameter transmission lines that majority provinces have significantly. Besides that, approximately 73,000 kilometers of pipelines are monitored by the Canada Energy Regulator. Majority of provinces have significant pipeline infrastructure, pipelines are usually buried underground and operate in remote and densely populated areas. The main crude oil and natural gas pipelines provide services to most major cities in Canada.
Moreover, pipelines which are entirely in one province are the responsibility of the provincial government where they are located. It is the province authority’s duty to distribute those pipelines to transmit natural gas or water heaters to every household. These pipelines transport fuel for Canadians to use for daily life, such as heat houses, drive cars, buses, as well as airplanes. All public transports have a necessary demand for petroleum products. So, the normal operation of traffic in this country and the daily life of residents are guaranteed by pipelines.
Due to the prosperity of the Canadian oil and gas pipeline industry, the department has provided more than 740,000 direct or indirect jobs. This guarantees the disposable household income of some people. Not only that, the output value of the oil and gas industry is approximately as high as 11% of Canada’s GDP, and on average it pays more than $20 billion Canadian in taxes and fees to the government each year. Take the year of 2014 as an example, a federally regulated pipeline transported crude oil, petroleum products and natural gas worth about $159 billion in transactions to domestic and export customers. It can be seen that the oil and gas industry has made outstanding contributions to Canada’s economy.
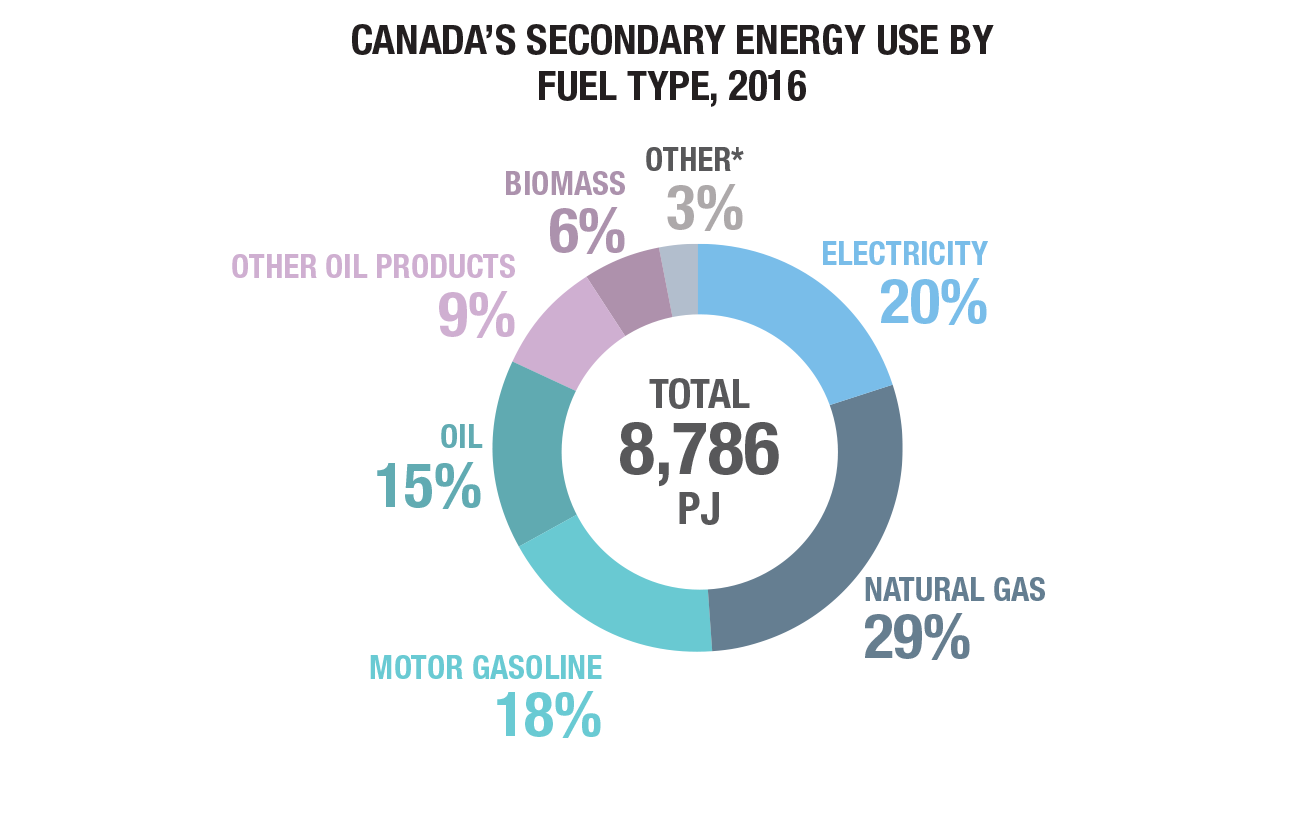
Energy consumption: Globally, Canada ranks as sixth among the largest energy production entities. It is also ranked fourth in net exporter and eighth in energy consumption. The country has a diverse range of energy resources, including renewable energy, crude oil, natural gas, coal, nuclear energy, and more. On an international scale, Canada’s energy is ranked Sixth. Canada’s economy is highly dependent on the energy industry.
The resources contribute significantly to the country’s wealth. It is a source of employment, revenue, and a significant part of the nominal Gross Domestic Product (GDP). For instance, in 2019 the energy sector created employment for over 23 282,000 people and invested in more than 550,500 jobs. Canada’s energy sector contributes more than 10% of the nominal Gross Domestic Product (GDP). In 2018 the industry created government revenue amounting to $17.9 billion in 2018. For this reason, Canada is highly invested in the growth, development, and sustainability of the energy sector.
The pipeline industry is one of the industries that is greatly affected by energy consumption. Pipelines are considered the safest and most environmentally friendly means of transporting crude oil, natural gas as well as refined petroleum products. With the country dealing with bulk production, exportation, and consumption of crude oil and natural gases, it is highly dependent on the pipeline industry. For this reason, there are over 840,000 kilometers of pipelines providing transportation services to most major cities in Canada.
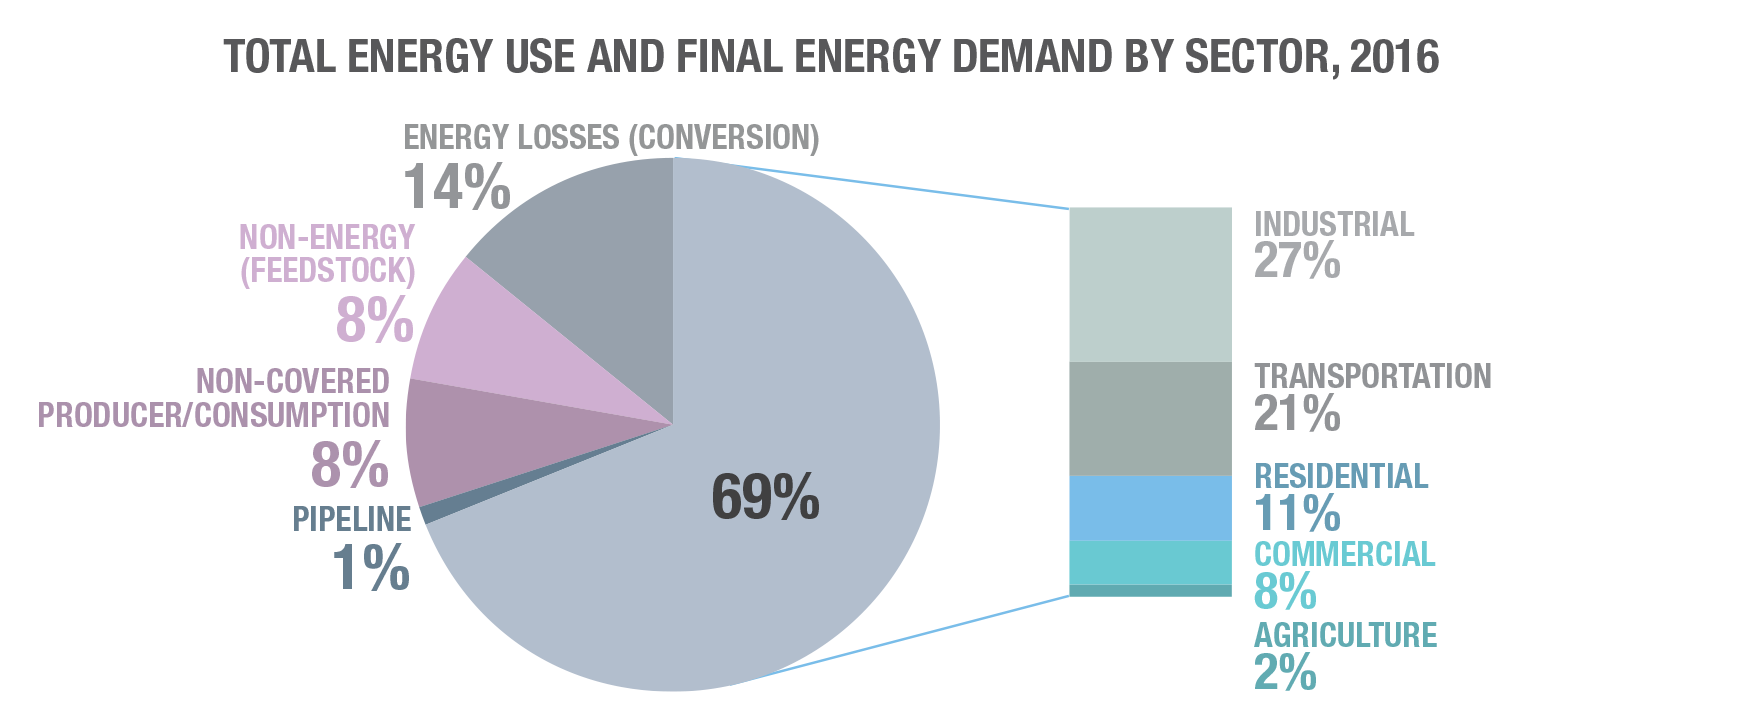
In addition, providing a constant inflow of energy resources, Canada on its own provides a large pool of customers for the energy product, which has played a significant role in boosting the economic stability of the pipeline industry. Ranging from residential, commercial, industrial, and agricultural use, the country provides a stable market. This has allowed the pipeline industry to remain operative. It is able to pay for needed resources, including workforce and machinery, and the same generate adequate revenue.
As the below figures reveal, pipelines take the least energy using which is only about 1%.
Power of Suppliers to the Industry
“When you drive steel up by thirty per cent… pipe’s going to go up quite a bit as well.”
The Pembina Pipeline’s biggest line of business is the one that involves the transportation of oil and natural gas. Although the company indeed has a segment that focuses on the processing and refinement of crude oil into different types of fuel and other petroleum products, the bulk of its operations still focus on the transportation of oil and natural gas. This was a primary consideration in the process of researching the company’s NAICS code. The NAICS code refers to the North American Industry Classification System code.
Finding the NAICS code where a company belongs is a good way to classify business establishments for data gathering, management, and analytical purposes, especially when it comes to the generation of macroeconomic reports. Pembina Pipeline belongs to the Transportation and Warehousing code 48-49. There are 614,334 companies in North America that fall under this classification. There are also other subclassifications under the NAICS code 48-49. The most relevant NAICS codes in relation to the Pembina Pipeline’s business processes and operations are the following:
- NAICS Code 4861 – Pipeline Transportation of Crude Oil, of which there are 790 across North America, and
- NAICS Code 4862 – Pipeline Transportation of Natural Gas, of which there are 1,751 across North America.
There is also NAICS Code 486910 – Pipeline Transportation of Refined Petroleum Products, of which there are 323 across North America (NAICS Association 2021).
What Pembina Pipeline is selling can be considered a service. This service involves the delivery of oil and natural gas, and refined petroleum products from one location (e.g. Canada) to another (e.g. another part of Canada or another country in North America such as the USA), and vice versa. Therefore, when analyzing the availability of substitutes for the service that is being offered by the company, one only has to look for companies that offer the same type of service. There are a lot of companies across North America that offer a line of commodity transportation services. Most of these companies do so via long haul trucks and oil tanker ships. These substitute services, however, tend to be significantly more expensive on a per unit basis compared to pipelines.
According to Enbridge, “transporting oil by pipelines is more than twice as safe as using rail”, and other means of transportation. Pipelines also tend to be the more cost-efficient option for customers, because they cost less per unit of oil to transport than other means like rail and oil tanker trucks. Pipeline-based oil transportation is also faster, because the commodities do not have to go through various lines of bureaucracy. The overall value being offered by pipeline companies are simply much higher than the overall value being offered by companies that provide the substitutes or alternatives to pipeline-based oil transportation services. This is why even if it is true that the Pembina Pipeline’s service has a lot of substitutes, it should, in theory, still remain competitive, because of the natural characteristics of pipeline-based oil and natural gas transportation.
Pipelines require a huge capital outlay to construct. The oil pipeline-based transportation industry is also a heavily-regulated one. This means that it would be extremely hard for new entrants to enter the business and provide a network of services that can actually rival that of Pembina Pipeline, because they would have to go through stringent regulations, and not to mention shell out billions of dollars’ in capital expenditures to finance the construction of a new pipeline. According to the data provided by NAICS, the manufacturing of oil and gas transportation steel pipelines falls into category NAICS 23712 – Oil and Gas Pipeline and Related Structures Construction (Government of Canada). The Canadian government claims the existence of nearly 3 thousand such establishments across the state, claiming the presence of a relatively competitive market despite the procedure complications.
The input for the type of service that Pembina Pipeline offers is crude oil. Therefore, the supplier would come in the form of crude oil drillers and natural gas suppliers. The supplier industry, for the most part, is perfectly balanced in terms of being fragmented or concentrated. There is only a small number of companies that can supply oil and natural gas. However, at the same time, there is only a small number of companies that can offer pipeline-based transportation for such commodities. This is what makes it safe to suggest that the supplier industry—in which Pembina Pipeline operates is neither fragmented or concentrated.
The companies that supply oil and natural gas to Pembina Pipeline are, for the most part, price takers, especially at this point in time, where the oil industry is essentially in a crisis. Oil and natural gas companies in the upstream market are always looking for ways to cut down costs, and this is where the advantage of Pembina Pipeline’s business truly shines, because it offers a fast, safe, and cost-effective way for the now-desperate oil and natural gas firms to transport their products to their intended customers. The leverage here lies in the hands of Pembina Pipeline, because the oil and natural gas firms that need transportation services are in such a high level of desperation, so long as they can keep the prices reasonable of course, resulting in a rate of 6 out of 10.
Marketing and Sales
Market Share
Pembina Pipeline is operating in a competitive and dynamic market environment. The market consists of well-established and organized companies that are focusing on similar markets at any given market. It becomes difficult to assess with certainty the extent of the market share, but approximations can be undertaken based on the revenues and profits where it has over 10 percent of the market share at any given moment.
Marketing Expense
Marketing charges are part of the operating expenses of the company. Accountants tend to include them in the category of “selling, general and administrative expenses” section regarding preparing and presenting the statement of profit and loss. In the same regard, the management of Pembina Pipeline has been focused on the aspect of ensuring that the SG&A expenses are captured to facilitate the understanding of what is transpiring at any given moment.
The table below facilitates the computation of the marketing expenses as a percentage of sales for the company over the past three years and the similar information regarding the top competitors that have been selected in this context.

Analysis of the marketing expense as a percentage of sales for the past three years facilitates the indication that Pembina Pipeline has experienced a situation where the values have been increasing each passing year, starting with 3.58% in 2018 4.02%. The implication in such a case is that the management team realized that through proper marketing, the company could generate the much-needed revenues moving forward. The budgetary allocations that have been set aside for each of the three recent years to cater for the marketing expenses increased steadily to facilitate the situation in which the levels of awareness among the target customers can be enhanced and sustained in the best ways possible.
A comparative analysis of the situation where the top competitors that have been selected in this context lead to the understanding that none of them has incurred a great marketing expense as a percentage of sales for the last three years than Pembina Pipeline. Such a situation can be interpreted to mean that the company has been determined to ensure that it increases the budgetary allocations meant to facilitate sales and marketing in the best ways possible. The upward trend for the covered period indicates that the company is determined to reach out to a wider market in the quest to survive in a dynamic and competitive situation.
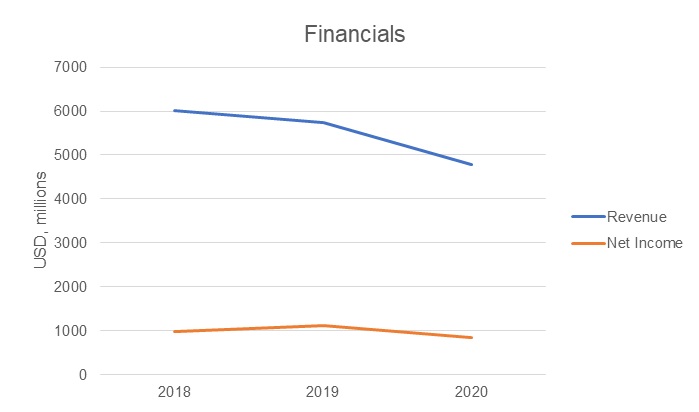
Sales Trends
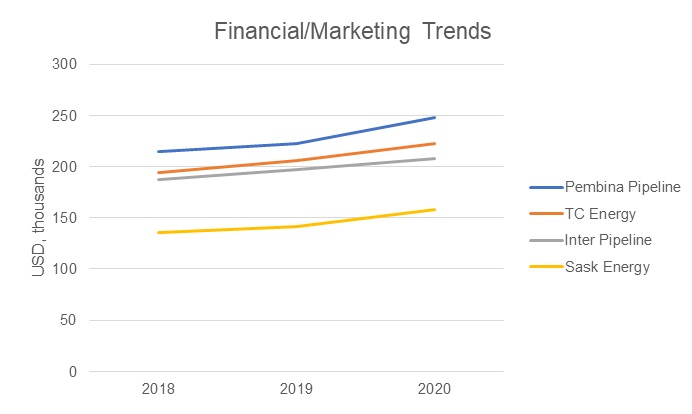
Analysis of the sales trends leads to the understanding that companies operating in competitive and dynamic market environments are always determined to have situations in which they have to make profits and ensure that their operations are sustainable. In this context, Pembina Pipeline has registered declining sales results for the past three years. The situation of this company and that of the competitors is as depicted in the figure below.
The market has been depicted in this context as one that has been registering the declining sales levels for all the companies whose data has been captured above. 2018 has remained stronger than the other two recent financial years in that it recorded higher sales figures than the rest except in the cases of Inter Pipeline and SaskEnergy that recorded increased figures in that period. The implication is that the segment of the midstream oil and gas industry that the four companies whose sales trends have been captured above have been registering declining results. All the companies have suffered the same fate without being spared from the harsh market realities.
The other interpretation of the whole situation is that oil and gas demand has declined in the past three years. The products and services that Pembina Pipeline and its selected top competitors are dealing with are no longer as marketable as they would have been envisioned. It is the reality that can be linked to the tough economic conditions that the COVID-19 pandemic has created. Analysis of the pandemic leads to the understanding that the demand for most products and services has declined. Secondly, the move towards clean and sustainable energy has led to the situation where oil and gas consumption is being discouraged in various quarters.
Financial/Market Metrics on Marketing Trends
The ultimate goal of Pembina Pipeline and its competitors is to have a framework where they are profitable, competitive and sustainable. It follows that efforts have to be made to ensure that the levels of sales are sufficient enough to cover the expenses and lead to the generation of the much-needed profits. In this context, various metrics can illustrate that the marketing/sales trends have grown or declined.
In this context, the ideal marketing trends are the marketing expenses that the company has incurred for the past three years. Pembina Pipeline has been availing the financial resources that are meant to cover all the marketing expenses, whose rationale is to create and sustain awareness about the activities that the company is pursuing at any given moment. Similarly, the amounts in question have to be deducted from the sales revenues to determine the extent to which profits have been generated. The table below illustrates the marketing expenses of Pembina Pipeline and its competitors;
The analysis of the figures that have been captured in the table above leads to the understanding that Pembina Pipeline is the company that has incurred lots of marketing expenses, followed by TC Energy, then eventually Inter Pipeline. SaskEnergy has had the least expenses in that regard. Thus, it can be argued that each company has the obligation of ensuring that it covers the expenses associated with the specific marketing obligations and activities undertaken at any given moment. There are different types and extents of marketing activities that can be undertaken at any given moment.
In the financial metrics associated with the marketing expenses, there is the need to understand how such expenses have affected the profits generated at the end of the trading period, given the information about the revenues/sales that had been captured earlier on. In this context, there is the need to ensure the concentration on the profitability trends to justify the expenses incurred in due course of marketing the various products and services in question.
The table below has the information about the profits that have been generated by Pembina Pipeline and its competitors in the recent years.
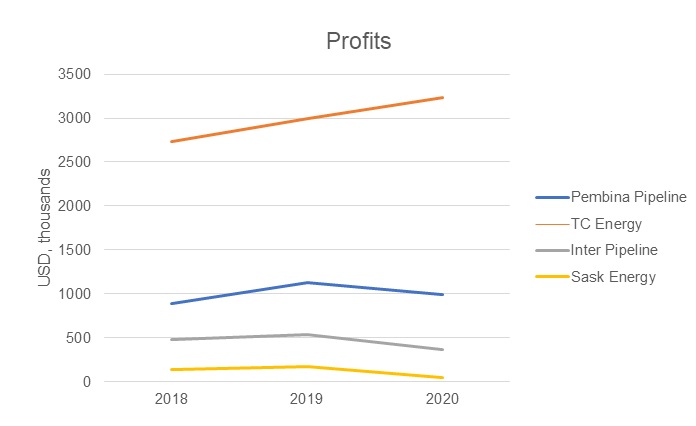
The analysis of the profits generated by the three companies competing with Pembina Pipeline leads to the understanding that TC Energy has generated the highest profits since it also had very high sales revenues. Pembina Pipeline has done exceptionally well given that the profit margin is too high compared to the competitors that generated high revenues for the past three years. SaskEnergy has recorded the least profitsfor the three consecutive years, implying that general expenses have been increasing in comparison to the revenues raised.
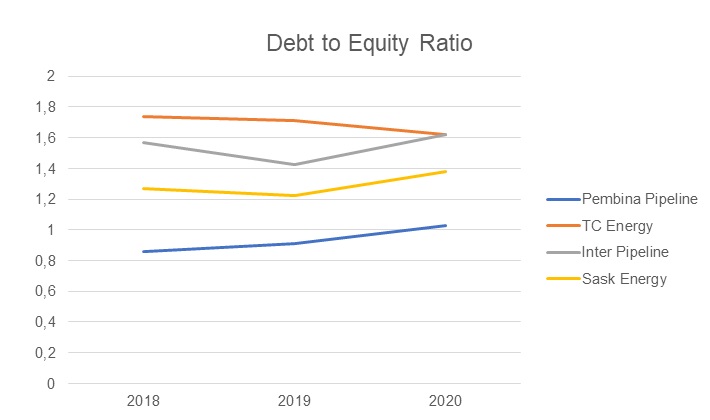
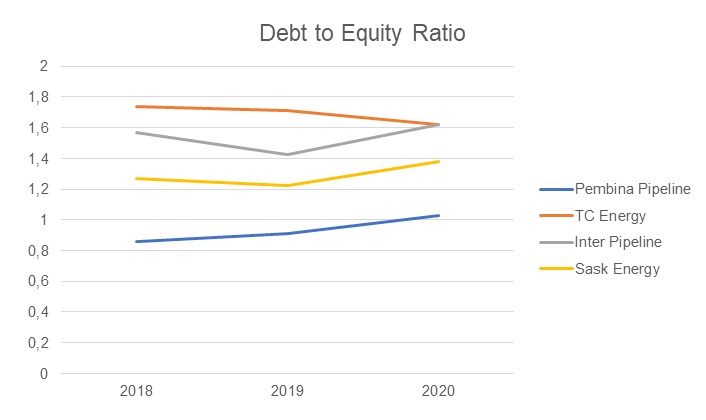
The debt-to-equity ratio is another important metric that provides the opportunity to calculate the company’s potential debt risk. It is generally accepted that the ratio should not exceed the level of 2.0. Otherwise, the company would be facing severe budget challenges that require immediate intervention. The data above demonstrates that no company is at such a risk, yet Inter Pipeline is likely to cross the line in the long run. The overall tendency emphasized the influence of pandemic, increasing the risk for all the enterprises except for TC Energy.
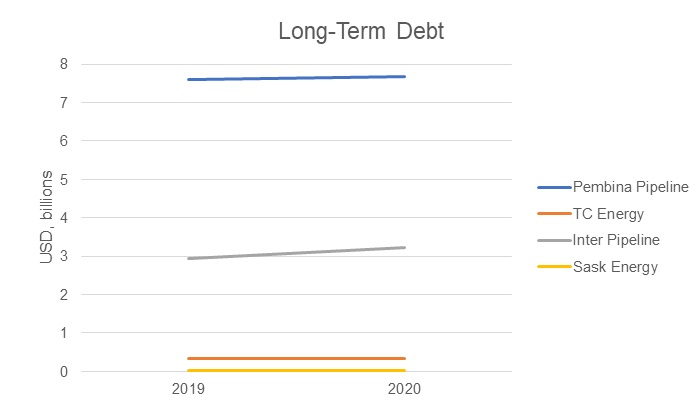
Long-term debt is a part of a company’s balance sheet that investors pay attention to in order to understand its long-terms financial obligations that are to be repaid.
Strengths and Weaknesses based on Metrics
The information available in this context leads to the understanding that selected competitors of Pembina Pipeline have recorded mixed results due to their performances in the product markets. As a company operating in a competitive and dynamic market environment, Pembina Pipeline has performed well in terms of trying to keep the expenses and costs manageable to the extent of registering a high level of profits.
It is worth noting that Pembina Pipeline did not make the greatest sales, however, the percentage of the profits generated can go a long way in covering such deficits. Besides, the company has been able to rely on cost and expense minimization as the ideal strategy that has paved the way for many desirable profits. The fact that the profit margins have been sufficient implies that the management has cut down on the unnecessary expenses that otherwise would have led to the declined sales moving forward.
A formidable weakness of Pembina Pipeline is that it has not been able to make enough sales as compared to some of the leading competitors. Such a situation leaves the company in a vulnerable situation becomes it cannot be competitive and sustainable moving forward with a limited amount of sales. Despite the COVID-19 pandemic, the company has demonstrated that it is yet to capture a sizable market that can propel its activities to a whole new level moving into the unforeseeable future.
Corporate Leadership
Average Number of Years of Experience
Pembina Pipeline is operating in a competitive and dynamic business environment characterized by an increased number of top and well-established competitors looking forward to conquering the same markets. It has to be noted that the executives of this company have been at the helm of leadership for many years, where they have led to competitive, profitable and sustainable undertakings.
The average number of years of experience of executives of this company can be computed by having the sum of the years for every executive divided by their number. The company has seven executives with a combined experience in senior leadership roles that have extended for 79 years (i.e., 19+15+7+11+10+5+12). The implication in that regard is that the average number of years of the executives is 11.29 years. Within the industry, the average number of years of experience of executives is 15 years. At a general level, the average figures tend to fluctuate from one industry to the next in the business world.
Major Metrics
The company has been operating in the corporate world since its inception in 1954 and is headquartered in Calgary, Canada. The market performances of the company and its direct competitors are as follows;
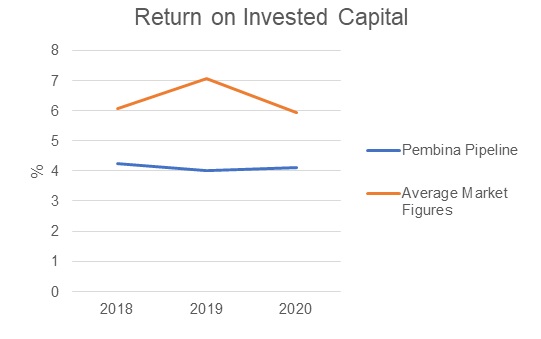
Return on invested capital (ROIC) refers to the framework of assessing how well a given company usually generates cash flows that are relative to the capital that has been invested in its operations. Pembina Pipeline’s annualized return on invested capital (ROIC%) for the year that ended in December 2020 is 4.10%. There has been a fluctuation in this figure as stipulated above, where the 2018 figure declined in 2019 before a slight improvement in 2020. A comparative analysis with the competitors as depicted by the industry average reveals that there have been fluctuations as well, but this company has failed to reach the average figures.
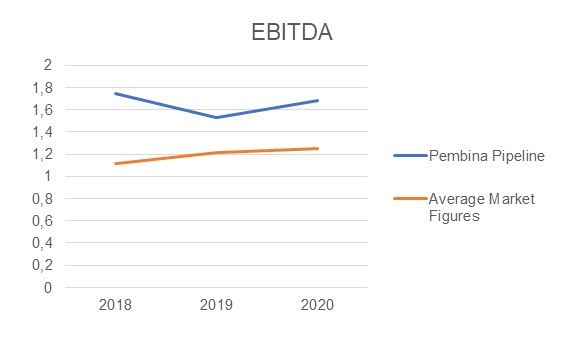
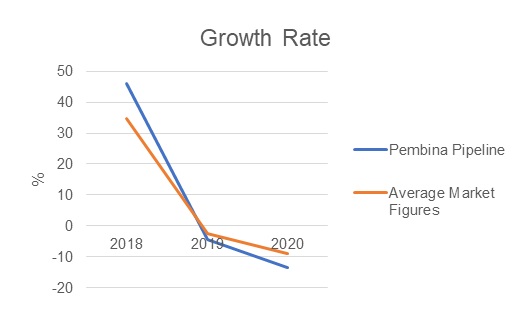
When it comes to the earnings before interest, taxes, depreciation and amortization (EBITDA) for the past three years, it is depicted that there have been fluctuations where 2018 has been the strongest year. The decline experienced in 2019 has been followed by a slight improvement in 2020. Pembina Pipeline has surpassed the average industry figures for all three years. In the case of growth rate, the emphasis can be laid on the changes that are associated with the revenues that have been generated for the covered period. Pembina Pipeline has experienced a situation where there have been declines, having registered formidable values in 2018. The same situation has been reflected in the rest of the industry based on the average figures that have been availed.
Share Price Analysis
Share (stock) analysis refers to the framework that is used by the investors and traders to evaluate and investigate the given trading instrument, investment sector or the entire stock market. Investors/traders tend to make the selling and buying decisions on the basis of the stock analysis information that is at their disposal.
Companies that operate in various industries within the product markets also have the obligation of ensuring that they operate in the stock markets to enhance their positions in the best ways possible. Pembina has its stocks listed in the stock exchange markets, where investors/buyers acquire and sell the shares at any given moment. The information depicted in the table above facilitates the indication that TC Energy’s share price has been higher than those associated with the top competitors that have been listed in this context. Such a situation implies that the demand for the company’s stocks tends to exert pressure on the prices at any given moment.
Pembina Pipeline experienced an increase in the stock price value in 2019, just like TC Energy. Fortunately, no company experienced a decline. 2020 was generally a frustrating year in the corporate world. The coronavirus disease (COVID-19) had disrupted the operations of the various sectors of the economy in Canada and beyond affected markets in various ways. It can be noted that the stock prices of Pembina Pipeline and all the top competitors declined in 2020 when compared to the situation that had been captured in 2019. The implication in such a case is that the investor’s lots massively in terms of the wealth accumulation since the stocks depreciated.
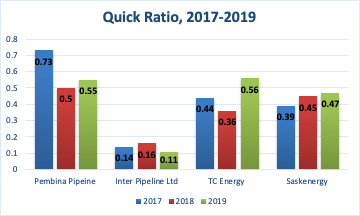
Quick Ratio (Strength)
The quick ratio helps to determine the company’s capacity to pay its current liabilities with its most liquid assets such as cash and cash equivalent without needing to sell its inventory. When the quick ratio is low, this means that the company will be struggling with paying its current liabilities, a ratio of 1 means that the current liabilities and assets are equal, and a ratio greater than one means that the company is able to pay its current liabilities with its most liquid assets without having to sell inventory. This said and as shown in figure (14) (See Appendix C,F,I,L), Pembina is doing relatively well compared with its competitors, although the ratio in Pembina is less than 1, it is still doing well compared to all its competitors. However, this indication does not mean that Pembina is able to pay its current liabilities or has good financial health.
Market Capitalization
Analysis of market capitalization indicates a framework associated with the total dollar market value of the outstanding shares of stock of a given company. It is a framework that is used to facilitate the determination of the worth of a company based on the stock market. It deals with the coverage of the total market value that is associated with all the outstanding shares.
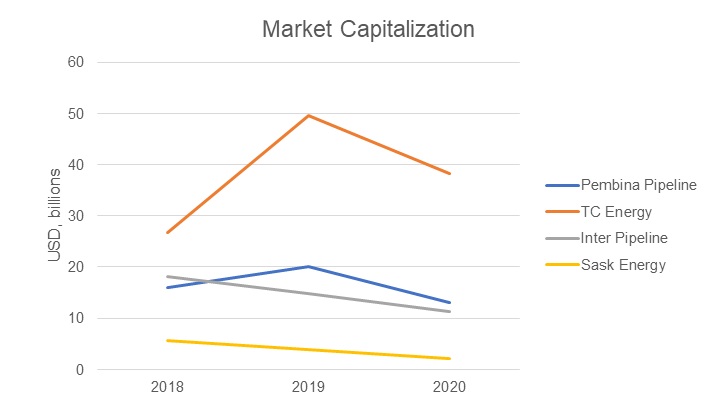
TC Energy is the only company among the selected top competitors of Pembina Pipeline that has registered the highest market capitalization for the past three years. However, there has emerged a situation where all the three competitors of Pembina Pipeline have registered a rather frustrating fiscal year in 2020 where the market capitalization has had its value decline drastically. The implication is that the effects of COVID-19 have been greatly felt in the oil and gas industry within Northern America as a region to the extent where the value of the stocks that various companies avail has declined drastically.
Metrics used to Evaluate the CEOs
Regular and purposeful CEO performance evaluation undertaken by the board of directors is always useful in the elaborate decision-making frameworks that are adopted at any given moment. Various dimensions have to be evaluated by the board to understand that, indeed, the company is being managed in the best ways possible. In this context, the emphasis is laid on the key financial indicators of performances at Pembina Pipeline.
The CEO of Pembina Pipeline can be assessed in terms of the performances based on the figures that have been realized in the corporate obligations that have been undertaken for the past three years. In this context, it has been depicted that the company registered strong performances in 2019 as compared to 2018 in terms of revenues and profitability. The earnings per share (EPS) meant to benefit the investors also improved from $1.76 to $2.00. However, the COVID-19 pandemic paralyzing most economic sectors led to the company’s registered dismal results.
Strengths and Weaknesses in the Value Chain Function
Pembina Pipeline is operating in a competitive and highly dynamic industry characterized by the presence of various companies that are eyeing the same market segments. It is a situation that has tended to undermine the extent to which the company can go when it comes to attaining profitability, competitiveness and sustainability milestones. However, the company’s management has undertaken the stewardship roles very well to ensure that progress is made on various fronts.
The company’s performance in the product markets has met the expectations where the levels of profits generated for the past three years have been sufficient. The same situation has been replicated in the stock market, where the shares’ value has increased based on the prices for the past three years. On the bottom line, the market capitalization of Pembina Pipeline has declined greatly in 2020 when compared to 2018 and 2019. Such a situation can be blamed on the COVID-19 pandemic that has restricted the investors’ activities and strategies in the stock market. The demand for the stocks has declined across the board, and this company has been a casualty in that regard.
Business Strategies
Pembina Pipeline Corporation is one of the leading companies that operate in the Canadian petroleum, natural gas and oil sectors. Presently, this organization has around 1,260 employees while its profits have been increasing steadily. The leaders rely on various business strategies and initiatives to address its challenges and pursue its goals. The four generic strategies offer powerful insights and concepts that can help companies realize their maximum potential. The leaders at Pembina Pipeline always rely on the focus generic strategy to remain competitive in the industry and meet the demands of its customers.
Defining of the Cost Focus Strategy
Cost focus is an improved version of the cost leadership generic strategy and it combines two elements. Specifically, it borrows some of the attributes of the focus strategy and combines them with the cost approach. This new framework guides leaders in a particular company to identify a niche market and improve the promoted initiatives to become a leader in service or product delivery. The company can go further to develop a unique edge that helps attract more customers and encourage them to continue using the delivered products. The-company will offer its products at a competitive or average price while maximizing market share. The involved players will embrace the right mechanisms to lower operational costs (Pembina, 2021). Such measures will reduce operational expenses without affecting the quality and speed of productions. Corporations that pursue such a model find it easier to overcome competition and achieve the targeted business aims.
Narrow Vs. Broad Market Strategy
Considering current Pembina Pipelines’ position in the market, it becomes evident that the company is undergoing a gradual decrease in terms of profit and marketing performance. Undeniably, the majority of such an impact is closely correlated with the external factors that may not be addressed by the enterprise, such as the overall economic crisis catalyzed by the COVID-19 pandemic. Thus, it is imperative for the company to define the scope of its strategic planning, choosing between narrow and broad approaches.
The narrow strategy is primarily focused on the identification of a niche target that secures steady income for the company. Once such a target market is chosen, the company channels its financial investments to it in order to increase the potential outcome. The broad strategy, in its turn, is aimed at defining the framework that encompasses various potential markets in order to create a “safety cushion” for the company. Such a strategy is beneficial in terms of providing options for the market development, yet it may be costly for the enterprise, as it requires allocation of finance in a number of potentially profitable markets.
Considering the case of Pembina Pipeline, it is necessary to define whether such an enterprise is capable of channeling a specific market. Like any industry operating with natural resources, Pembina Pipeline is not capable of modifying the manufacturing cost and changing price, which makes it highly dependent on external factors. As a result, when choosing a narrow strategy, Pembina will not be able to calculate the budget thoroughly enough to expect a positive dynamic. As a result, the company’s best choice would be to work for the broad market while creating an agile framework that allows the manufacturer to shift the primary focus regarding the trends in the chosen markets.
Pembina’s Generic Strategy: Key Discussions and Recommendations
Of the four Porter’s generic strategies, Pembina has identified the cost focus because it resonates with its business objectives and aims. Such an approach integrates broad and narrow aspects to support the delivery of timely results. The focus concept allows this organization to identify the right niche market in Western Canada. It has succeeded in identifying the right regions and areas to meet the demands of its customers (Pembina, 2021). Relying on the recorded experiences and resources, the company has become an expert in providing natural gas and oil to different clients in the selected region. The strategy has continued to make it possible for this organization to meet the demands of more stakeholders.
Additionally, the concept of cost is integrated in the wider generic strategy to deliver competitive edge. When speaking of cost as a major variable in a chosen strategy, the company should decide on the service cost that should assist it in the market. Given the increasing competition rates and cost proposals outlined by rivaling companies, Pembina Pipeline is to employ one of the strategies to fight the low-cost tendency.
The first strategy is to differentiate the offerings, which is beneficial for marketing yet limited in the given business sector. The second strategy encompasses the company’s ability to incorporate low-cost ventures in the framework. Such an endeavor is rather risky for the oil and gas industry because it would be challenging to anticipate the outcomes of such ventures. Finally, the fighting strategy is to become a low-cost provider is considered the most beneficial for Pembina in the modern context. By embracing low-cost competition, the company will be capable of attracting new markets in times of financial ambiguity.
The presence of pipelines and the option of leasing such facilities make it possible for this organization to reduce operational costs. Through such a model, Pembina has designed a superior model for meeting the demands recorded in its niche market (Canadian Energy Research Institute, 2017). It relies on experience and current facilities to deliver oil and natural gas at a reduced cost. The professionals involved consider the best initiatives and approaches to minimize maintenance costs. Such an initiative has made it possible for the company to deliver quality products to its customers. The organization also considers the level of competition in the niche market and implements superior approaches to mitigate possible gaps.
The adoption and implementation of this generic strategy has helped Pembina achieve a number of goals. First, it has become one of the reputable players and service providers in the region. This outcome is possible since most of the customers have their needs met in a timely manner. Second, most of the partners and clients identify it as a trusted brand or business name in the wider sector (University of Oxford, 2019). Third, the use of the generic strategy has made this company a trusted name. With proper improvements and adjustments in accordance with the trends recorded in the sector, chances are high that the company will eventually record additional positive goals and become more competitive (Canadian Energy Research Institute, 2017). Fourth, the established strategy has resulted in additional partnerships with pipeline companies to improve service delivery and meet the demands of more potential clients.
Through the power of the cost focus generic strategy, the leaders are Pembina finds it easier to identify the recorded challenges and address them in a timely manner. More partners find the business model sustainable and capable of delivering positive results. From this analysis, it would be agreeable that this company adopted such a generic business strategy to overcome the challenge of competition, standout in its competitive market, and focus on the best approaches to reduce the costs of doing business (Canadian Energy Research Institute, 2017). Consequently, Pembina has managed to record positive gains while at the same time leaving most of its gas and oil subscribers satisfied.
Unfortunately, the adoption of this strategy has triggered several problems that might affect overall performance. For instance, the company has been unable to differentiate its products and offerings in an effort to meet the demands of more customers. This gap explains why and how most of the direct competitors might take the lead in the future and make Pembina’s business strategy less competitive. Another identifiable challenge is that the adopted strategy does not allow the company to take the concept of research and development seriously in an effort to be prepared for some of the possible challenges in the future (Pembina, 2021). Despite such concerns, this company remains profitable and can make the relevant adjustments to continue recording positive gains.
The best recommendation for Pembina would be to consider a global strategy since all players in the industry appear to follow the same model and there is little to no variation between pipeline companies. It can do so by capitalizing on the concept of cost leadership since it will help lower operational costs while at the same time delivering the right products to the customers (University of Oxford, 2019). This approach can make it possible for Pembina to improve its operations and venture into new markets in different parts of North America. The concept of R&D will support the entire process and eventually deliver the outlined organizational goals.
Works Cited
“Canada Natural Gas Reserves, Production and Consumption Statistics.” Worldometers.info, 2015. Web.
“Canada: Oil Consumption 2019 | Statista”. 2019. Web.
“Daily Natural Gas Price Snapshots – CDNNOVA – Natural Gas Intelligence.” Natural Gas Intelligence, 2020. Web.
“Natural Gas PRICE Today | Natural Gas Spot Price Chart | Live Price of Natural Gas per Ounce | Markets Insider.” Markets Insider, 2021. Web.
Government of Canada. “Oil and Gas Pipeline and Related Structures Construction – 23712 – Summary – Canadian Industry Statistics – Innovation, Science and Economic Development Canada.” Ic.gc.ca, 2019. Web.
Statistics Canada. “Households and the Environment: Energy Use: Table 2 — Type of Main Heating Fuel Used, by Province, 2011.” Statcan.gc.ca, 2011. Web.
Uppal, Sharanjit. “Homeownership, Mortgage Debt and Types of Mortgage Among Canadian Families.” Statcan.gc.ca, Statistics Canada. 2019. Web.