Price, income, and demand for goods are not static variables in today’s business and economic environment. They are always changing, and they tend to influence how individuals and businesses go ahead purchasing given quantities of goods and services which they need to either use or sell. Price elasticity of demand, also known as elasticity of demand, is a measure that was formulated by economist Alfred Marshal.
It enables one to measure the percentage change in quantity demanded that may arise as a result of a one percent change in price, assuming that all other determinants of demand are held at a constant. It is got by dividing the proportional variation in quantity demanded by the proportional variation in price (Frank 2008). When Ed is positive, then it is considered to have inelastic demand, and therefore price changes have a very small or insignificant change in the quantity demanded. But when Ed is greater than one, it is considered to be elastic, and, therefore, any price changes will trigger substantial changes in quantity demanded.
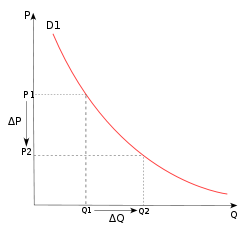
P=Price
Q= Quantity
Ed= Q2-Q1/P1-P2
On the other hand, cross-price elasticity is a situation whereby there are two goods, X and Y, and a change in the price of one of these products will result in a change of quantity demanded of the other product. Cross elasticity can be either positive (like in the case of substitute products such as tea and coffee) or negative (like in the case of automobiles and spare parts) meaning that an increase In price of X will conversely result in a reduction in demand of both or in the case, which they happen to substitute an increase in the price of one will lead to increase in the price of the other.
Goods that do not obey the laws of demand, for example, Veblen and Giffen’s goods, have a positive price elasticity of demand while independent goods may end up having a zero cross elasticity of demand. Therefore, a negative cross elasticity coefficient means that, if the price of good x rises then the demand of the complementary good z will fall and conversely the positive cross elasticity means if the price of good x rises the good z will face more demand.
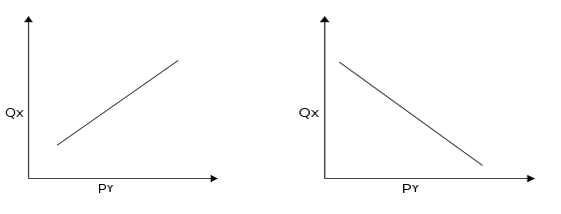
Figure 2 and 3: Graphs representing cross-price elasticity in the case of a substitute and complementary goods respectively.
QX=Quantity
PY=Price
Cross price elasticity= % ∆ QX /% ∆PY.
Income elasticity of demand is a “measure of the change in quantity demanded that may usually arise due to a proportional variation in the real income of an individual; income elasticity of demand is measured by dividing proportional variation in quantity demanded by the proportional variation in real income” (Parkin, Powell & Matthews, 2002). A hypothetical example is a 20 percent increase in a young man’s salary may increase the number of luxury items such as shoes purchased per month.
A negative income elasticity normally arises in the case of inferior goods and therefore a consumer will buy less of these goods as his/her income rises it may be the case when a poor unemployed person wins a lottery worth millions he/she may switch and start consuming goods which are considered to be somewhat high class. On the other hand, positive income elasticity is more likely to be the outcome when taking a look at normal goods.
In summary, a positive coefficient of income elasticity of demand will result in an increase in demand for a given good these are normal goods. While in contrast, a negative coefficient of income elasticity of demand means a rise in income level will result in to decrease in the quantity of demand of a given well, as it is the case when dealing with inferior goods.

I= Real income
QX= Quantity demanded
Income elasticity of demand= % ∆ QX/% ∆I
The coefficient of price elasticity of demand is Ed is most of the time a negative value due to the inverse relationship that exists between price and quantity demanded. Only goods that do not obey the laws of demand may end up with an Ed higher than zero. The coefficient of elasticity usually tells someone the actual degree to which a change in price causes a change in quantity and can either be 0, 1,-1<Ed<0,-∞<Ed=-1 or Ed=-∞.
The coefficient of income elasticity of demand can either be a positive value, zero, or a negative value depending on whether the good is normal, a sticky good, or an inferior good respectively. This coefficient tries to explain, exactly, how much a single percent increment in quantity demanded may be as a result of an increase in real income.
The Coefficient of Cross elasticity explains to a concerned party the magnitude to which the quantity demanded of a product may change when the price of one of the product changes when one good, when is compared to another ceteris paribus. It is mostly when goods are either complementary or substitute products.
Price elasticity of demand, cross elasticity of demand, and income elasticity are very different from each other and very useful to both micro and macroeconomists. Price elasticity takes a look at how a change in prices affects the quantity of consumption, while cross elasticity takes a look at the change in prices of different related goods to affect the actual demand for other goods. Lastly, income elasticity takes a look at how the changes in income end up affecting the quantity of consumption.
Economists use such collect such data and make useful information out of it, which can help them plan and direct national policy. Furthermore, the above can be used to indicate how healthy the economy of a nation. Businessmen and marketers can use such data to effect price changes and stabilize/maximize revenue generation in an economy.
The more the number of substitute products in the market, then the more likely the elasticity, and therefore consumers will have an easier time moving from one product to another, which enables the consumer to purchase more quantity. There is, therefore, a strong substitution effect and therefore if there is an absence of substitute products then switching becomes difficult and therefore demand will be inelastic a good example is tea and coffee when there is a lot of coffee is supermarkets while there is a shortage of tea then it becomes hard for consumers to adopt using the substitute tea because it is not easily available and most probably expensive than coffee.
The higher the percentage of income dedicated to the consumption of goods the higher the elasticity and when certain goods represent a minute portion of income then the result will be irrelevant and demand inelastic when a consumer income increase then he is more likely to purchase designer clothes such as Gucci but if the same consumer is laid off or his salary reduced then he will most probably desist from purchasing luxury items such as designer Gucci clothes and therefore go for a much cheaper option. The longer the consumer time horizon, then the higher the elasticity, and if a consumer has a shorter time horizon, then demand is deemed to become inelastic.
The price of oil around the world is a good example when participants in the oil industry expect prices to peak at $80 per barrel over the next 3 years then, in case these prices peak at $ 120 per barrel, then demand may become inelastic. Therefore if prices increase suddenly in the short run it, becomes like a shock to consumers and therefore demand will become more inelastic, but conversely, if the prices increase gradually in the long run, demand would become more elastic because it is according to consumer expectations.
Businessmen, therefore, are not expected to ignore both high and low levels of elasticity and inelasticity among consumers; this is because, at the end of the day, the revenue streams of businesses will be affected. Therefore, businesses will most likely develop strategies that will maximize revenue. A price increase will reduce the quantity consumed and increase revenues. Therefore, businessmen will adopt strategies that will ensure they are within the elastic zone and mainly the unit elastic zone (Perloff 2008).
For example, businessmen will not price substitute goods such as tea and coffee with prices that are far apart because they may end up selling the one that seems too expensive as compared to the other and consequently making demand more inelastic. Therefore, business executives will price these commodities in such a way to ensure that the demand for either product doesn’t compromise the demand for the other product this is because if the price of coffee is somehow to low then the products being substitutes, means that tea will not be bought therefore the prices of the two substitutes must be set at equilibrium.
While on the other hand, if a consumer/ investor expects the price of real estate condominiums to be around $ 1 million for the next ten years they will therefore be less willing to pay a cent more for them before this time expires consequently the more expensive a condominium during this time, the more inelastic the demand. This, therefore, implies that businessmen supplying them will be required to raise prices gradually until this time horizon expires.
A consumer may dedicate 20% of his/her income to entertainment, but, in case the price of movie tickets rises due to inflation or other considerations, then the demand for such products may become more inelastic. Therefore, business decision-making will be guided by such considerations because businessmen will not willingly jeopardize demand patterns of any product without taking into consideration all factors that contribute to both elasticity and inelasticity knowing the price/quantity sensitive nature of such transactions.
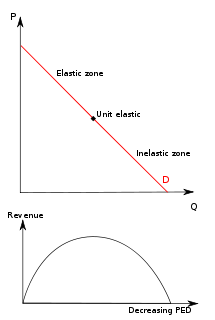
P=Price
Q=quantity
PED= price elasticity of demand.
Perfectly elasticity means that any change in the price of a product no matter how small will, at the end, of it all, cause the demand to drop to zero and, therefore, the total revenue will also become zero. As for perfectly inelastic elasticity changes in price do not in any way affect have the slightest effect on demand levels of the good, and therefore raising price levels will also push revenues up.
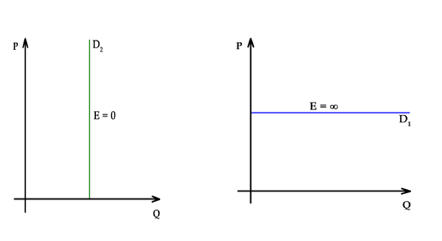
P=Price
Q=Quantity
E=0- Perfectly inelastic demand
E=∞- Perfectly elastic demand.
According to figure 5 above, there exists a relationship between demand and total revenue as price falls I the elastic range total revenue increases consequently, and when price increases in the inelastic range, then total revenue also goes down consequently. Therefore, total revenue will only be maximized at the quantity where the elasticity of demand is Ed= 1. Therefore, the unit elastic zone of this graph is the zone where the parentage change in price and quantity are equal and, therefore, in equilibrium.
The inelastic range is a zone where the percentage change in quantity demanded is less than the percentage change in price and therefore Ed>-1and lastly the elastic range is a zone, where the percentage change in quantity demanded surpasses the percentage change in quantity demanded and therefore Ed <-1 Changes in price are accompanied by implications that affect quantity demanded and revenues generated.
A high degree of elasticity is good for business because it enables revenue streams to rise steadily until the unit elastic range is reached where the highest possible revenues can be realized. Beyond this point, there is the inelastic range where demand is low and revenue streams are negated and this could be threatening to the business. Therefore, revenues will be maximized when the price and quantity demanded are at equilibrium.
References
Frank, R. (2008). Microeconomics and Behavior (7th ed.). New York: McGraw-Hill.
Parkin, M., Powell, M. & Matthews, K. (2002). Economics. Harlow: Addison-Wesley.
Perloff, J. (2008). Microeconomic Theory & Applications with Calculus. Franklin, MO: Pearson.