Introduction
Slick Jim’s Used Cars sells pre-owned cars with the business managed by the owner Jim Slick and five other employees. Although the company is making profits, there is concern about the earnings not meeting the expected levels. One of the reasons identified for lower profitability is the practice of the company to deal with all types and categories of cars, without the correct knowledge on the type/category of car, which provides maximum profit to the company. Besides this, there are other issues like poor bookkeeping resulting in inadequate information to the owner on the total expenses including commission and advertising costs. In order to make the reporting comprehensive with adequate and meaningful information, this report suggests the use of MS Excel to prepare and present various management information report to the owner/manager to make informed business decisions. Various issues in connection with the business of Slick Jim’s Used Cars are discussed herein. The report also produces model input, processing and reports using MS Excel made for the business done during the month of January 2010 by the company.
Profitability for Different Car Categories
An analysis of the profits earned by the company from different categories of cars sold during the month of January indicates the following results.
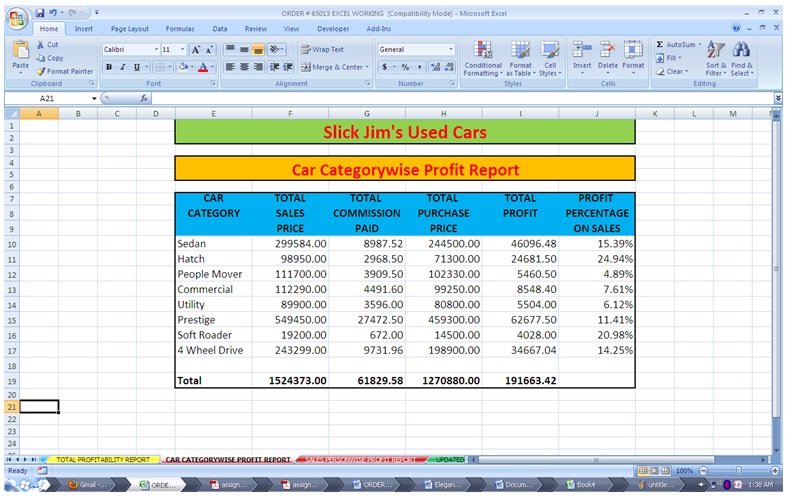
Car Category wise Profitability.
From the table, it may be observed that though a smaller amount of sales is done in the case of the Hatch category of cars this category has given the maximum margin of profit at 22.91% of the sales. In the case of car categories like Commercial, Utility and People Mover the profit margin is very low. Therefore, it is advisable to concentrate on purchasing and selling categories like Hatch, Sedan and Soft Roader instead of investing the money in categories like Commercial and Utility where the margin after payment of commission and advertising costs the profit margin is comparatively lower.
Fast Moving Car Category
The following tables indicate the number of days the different categories of cars stayed in the business from the day they are bought until sold. This information will provide an idea of the category of cars the business has to concentrate on.
Number of Days – Cars Remained in the Business.
From the above table, it is clear that Sedan is the most popular moving used car, as out of the 57 cars dealt with in the month of January 20 of them (About 35%) were Sedan. This category of cars also does not stay for a longer time with the company. The margin (after advertising cost) is not so less as compared to the higher-end cars which not only involve huge capital being locked in them (See purchase cost table below) they also stay for a longer duration with the company. Perhaps it appears that there are not enough customers looking for high-end cars in the used car segment. This substantiates the earlier discussion on reduced dealing of bigger cars.
Purchase Cost and Profitability of Cars.
Discussion on Future Sales
From the analysis of the profitability as related to the purchase cost, it appears that even though the investment in the Prestige category is more, they seem to result in the profitability of 8.42% on sales. However, these cars have on average stayed with the company for a period of 194 days. If we take, the average cost of $ 45,930 (total cost of $ 459,300 divided by a number of cars 10) and calculate the interest cost of 12% for 194 days it comes to $ 2,970, which works out to 5.40% on the average sales cost of $ 54,945. In effect, these cars though high in the volume are not contributing much to the profits of the company. On the other hand, Sedan cars are sold within an average period of 20 days. Therefore, the company should concentrate more on buying and selling the Sedan category, which appears to be fast-moving.
Identification of Issues
From the system of MS Excel, a wide range of information may be made available to the management. For instance, the following reports highlight the performance of the company during the month of January 2010.
- Total Profitability Report (Appendix 2)
- Car Category-wise Profitability Report (Appendix 3)
- Salesperson-wise Profitability Report (Appendix 4)
- Updated Profit for Each Category after advertising Costs (Appendix 5)
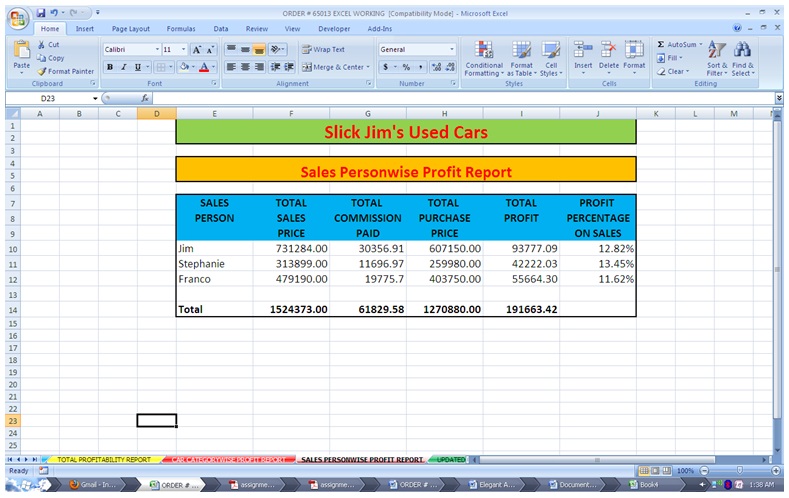
Salesperson wise Sales and Profitability.
From the salesperson-wise profitability report, it is observed that Jim is handling almost 50% of the sales himself. The other salespersons should be pulled to increase their sales figures.
By investing in large cars, which stay with the company there is a clear loss of interest and turnover. With the money blocked in the large high-end cars, a greater number of Sedan cars can be bought and sold to improve the profits for the company.
Conclusion
This report discussed at length the performance of Slick Jim’s Used Car business. From the analysis, it appears that the capital of the company is being blocked in high-end cars where the profit margin is low. It also appears from the data analyzed that the expensive cars stay for a longer time with the company, incurring heavy interest costs. It also becomes known almost the owner/manager Jim Slick handles fifty percent of the sales volume.
Recommendations
The following are the few recommendations this report makes to the business of Jim Slick.
- To look into the possibility of dealing in a maximum of three fast-moving categories of used cars (Immediate)
- To fix sales targets for other salespersons and link the commission with a minimum volume of sales (Based on a discussion with the salesmen and as decided by the owner)
- To implement an effective Management Information System (MIS) using MS Excel as appended to this report (Immediate)
Appendix 1 IPO Charts
Total Commission Calculations.
Commission Calculations Car Category wise.
Salesperson wise Commission Report.
Total Advertisement cost for each Car.
Total Advertisement cost for each Car Category.
Insurance Premium Calculator.
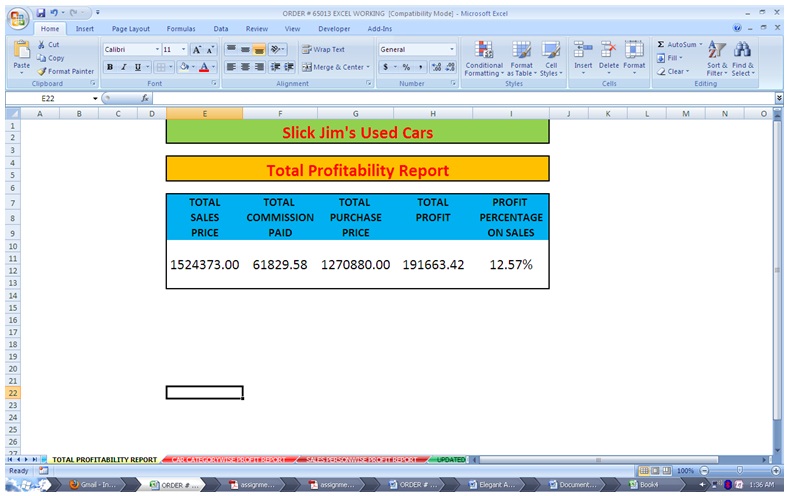
Appendix 2
Total Profitability Report
Appendix 3
Car Category wise Profitability Report
Appendix 4
Salesperson wise Profitability Report
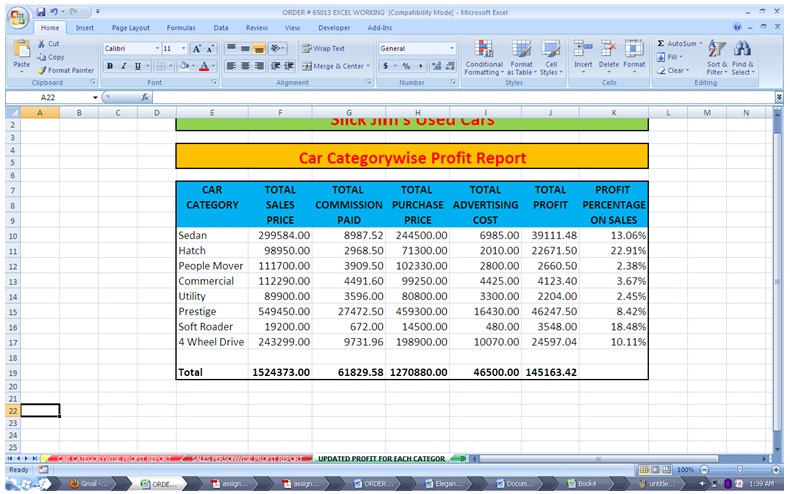
Appendix 5
Car Category wise Profitability Report (Updated for Advertising Costs)