Year to year comparison
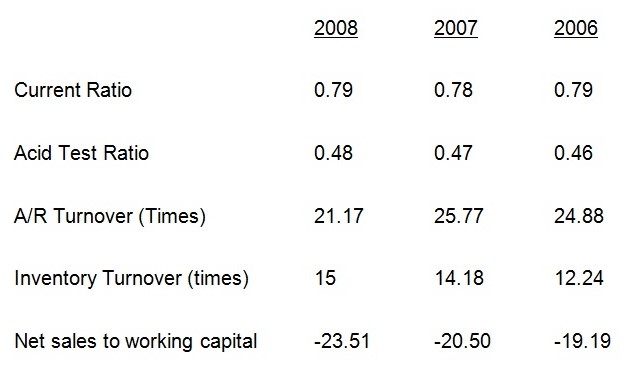
Short Term Liquidity: – Short-term liquidity position of Starbucks Company has been analyzed below. A number of ratios were calculated during the last 3 years for analysis purpose. The current ratio from year 2006 to year 2008 remains almost the same. However this ratio decreases by small margin during 2007. This decrease is due to decrease in investment in debt securities and decrease in accrual expenses. The acid test ratio of the company also depicts the upward trend. Overall short term liquidity as shown by current and acid ratio improves substantially during 2006 and 2008. Receivable turnover ratio remains fluctuate slightly during the past three years. It saw its highest turnover during the years 2008 which result in day sales. Inventory turnover fluctuate widely during this period which remained as high as 4.87 during year 2004 and then drop substantially and again picked up during year 2007 to 3.48. It shows that company improves its performance in terms of converting its inventory into sales resulting in higher sales figure during the year 2008. Overall conversion period shows improvement. Working capital amount is not quite adequate which continual decrease during the past three years. It shows that company is in poor position to finance its short term financial needs. It shows that company is converting its inventory into receivables and receivable into cash quite efficiently.
Capital Structure and Solvency
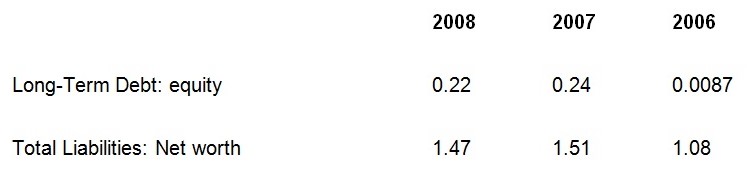
Capital structure of the company show how much of the company assets are financed by the company through debt and how much from equity. The ratio shows that company is increasing its reliance on creditor financing steadily starting from 0.0087 in 2006 to 0.22 times during 2008. At the same time company is building equity finance during the same last five years. This increase in equity finance came mostly from increase in retained earning of the company. The company paid no dividend to its outside shareholders. Instead it has decided to reinvest its annual profit into the business instead of relying on outside financing. The increase in total liabilities seems to be due to equal decrease in current liabilities of the company. This increase in current liabilities of the company, therefore, results in improved current and acid test ratio for the year 2007.
Return on Invested Capital
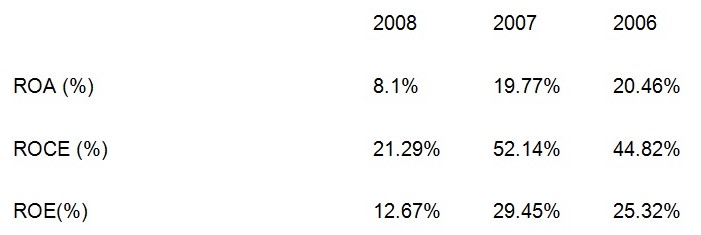
Return on invested capital analysis shows that this return fluctuated widely during the past three years. The company posted very high performance as far as ROA is concerned during the year 2006. This performance is due to high NOPAT during the year because of less operating expenses on account of asset impairment and restructuring charges, coupled with higher NOA turnover. These two expense items increase substantially during 2008 resulting in low NOPAT. Also the company increases the size of its sales force and marketing cost associated with launching of new products. Due to high operating expenses during 2008, company showed a reduced operating profit resulting in reduced ROE. Starbucks ROE during 2007 was highest at 29.45 percent among these three years. This increase is primarily due to high ROA and high spread during that year. NOA turnover fluctuate during these three years under analysis.
Assets Utilization
Asset utilization of the company has been shown in analysis. Sales to cash equivalent varied very widely from as low as 6.77 during 2006 to 107 during 2008. This increase is due to increase in sales of the company during these years couples with company’s policy of investment in debt securities. Sales to account receivable is increasing over the years showing that company is rapidly converting its receivable into cash. Same is the case with inventory. Company is converting its inventory into sales rapidly over these years resulting in higher sales. Sales to fixed asset and other assets show the same increasing trend during the past five years. Company has been quite effective in utilizing its assets quite efficiently as evident from the sales to total asset ratio. Sales to long term liabilities indicate trend of relying more on equity financing. This has been accomplished through retaining the net income within of the company.
Comparative analysis
In overall, the company performance is poor except a few instances such as times interest earned ratio and return on assets. All other ratios are below the industrial average especially the management efficiency is extremely poor since it is far too low from the industrial average. The liquidity of the company is also far below the industrial average while the solvency is too risky for the company.
Ratio Analysis
Liquidity ratios
The graph bellow shows trend of company liquidity for that last three years:
As a result of the company’s increasing current liabilities and dismal performance in 2007, its liquidity suffered greatly. Its current ratio declined to 0.78: from 0.79: in 2006. Although these ratios improved in year 2008 but the performance was same as in year 2006. This current ratio means that for every dollar the company owes in short term liabilities, it has a dollar and 0.79 dollars, 0.78 dollars and 0.79 dollars in current assets for years 2008, 2007 and 2006 respectively. The current ratio indicates that the firm is not financially stable as it is less than the industry average. Current liabilities may or may not include short-term borrowings. Creditors consider current assets as a buffer for current liabilities and hence they prefer a higher ratio. However there is an increase in the ratio. This is due to an increase in investment in debt securities and decrease in accrual expenses. The quick ratio indicates how able the firm is in meeting its financial obligations from the most liquid assets. The Quick Ratio shows that the liquidity position of the firm gone down in terms of its ability to meet short-term obligations. The reason why these are so high is due low investment in debt security which the company then increases steadily in the subsequent years. Working capital amount is quite adequate which increase consistently during the past two years. It shows that company is in good position to finance its short term financial needs This means that so far, so good – the company has enough liquidity although fluctuating.
Long term debt and solvency ratios
Capital structure of the company show how much of the company assets are financed by the company through debt and how much from equity. As to the company’s ability to pay its long term debt, it seems that its assets are sufficient. Its total debt is 22 per cent of its total assets. The chart below shows how debt has measure for the last 3 years as compared to the industrial average.
Moreover, long term debt as a component of total financing or total capital is only 147 percent at 2008. However the exhibit above shows that the company is increasing its reliance on creditor financing steadily from 0.87% to 22% in year 2006 to 2008respectively. At the same time company’s equity finance has decreased during the same last three years. The debt ratio is an indicator of the percentage of assets that have been financed through borrowed capital. It means the firm might be financing its assets using external sources. It measures how much of the debt is available in financing debt capital. This decrease in equity finance came mostly from stock repurchase of the company. Long term ratio has also increased drastically showing that the company is relying mostly on debt as compared to equity. The company capital structure is poorly financed as compared to industrial average.
Profitability ratio
This can be represented in a form of chart as follows:
ROA was very low at 8.1% during 2008 compared to 2007 of 19.77% as compared to industry average.The profits position does not remain the same when comparing with other variables. Here it shows that the company is sacrificing more than its sales revenue by adopting huge debt in their financing. Return on Assets is also used for the same purpose of measuring the overall performance. However to be meaningful to calculate the ROA it should be adjusted for implicit interest which is difficult to estimate and hence makes the process unnecessarily complicated. The figure shows that performance is lower in 2007 than in 2008.
As to the ability of the company to continue showing profitability in the next three years or so, that depends on how fast the US economy will recover from the economic crisis. After all, Starbucks business is strongly dependent on the economy. Therefore it is difficult to say that the performance of the company itself has increased.
Starbucks have been focusing a lot on increasing revenue which can be seen with the increase over the five year period. However profits are not increasing at all. The costs associated with the sales are a lot more that is the cost of sales are increasing in the same line as the sales; therefore the objective of increasing sales to increase profits has definitely not been achieved. The only reason why net income is marginally increasing at a steady rate is due to the increase in interest receivable but that’s not the core activities of the company. Hence this fact should be taken into consideration when developing future strategies as more concern should be given on controlling the costs and increasing efficiency in the quests of making more profits.
However the company is not all gloomy as the return on equity is growing at a good pace which will definitely attract the potential shareholders towards Starbucks. But it should be known that the number of shares are decreasing that is why ROE has significantly in year 2005. The most concerning issue is the decline in the share price. That’s why P/E ratio has significantly dropped. It seems Starbuck will continue to increase its sales but unless it doesn’t control the costs the gross profit will not increase. Return for equity is another thing that is lucrative for shareholders which will be the basis of increasing the share price unless there is some speculation or external factor which will significantly restrict the increase in share price. Therefore shareholders should fear further drop in share price as it’s close to book value. In the next five years it’s highly probable that Starbuck will prove to be profitable and a good source of capital gain (since Starbuck has no history of giving dividends) for the shareholders but keeping the current trend in mind, the share price could further drop below its book value so shareholders should buy the stocks of Starbucks as its likely that the stock price will increase, sooner or later.
Current Industry Environment
SWOT analysis
Strengths:
- The company is able to promote several products in one place.
- They have a high operating margin with less risk to profitability.
- They have a highly experienced management and staff to propel the company to great heights.
- They have many varieties of products.
Weaknesses:
- There are many barriers to enter international market such as china, Africa and some countries in South America due to political reasons.
- The company has problems of licensing.
- They operate in a highly competitive environment.
- They have a fluctuating return on equity as well as a fluctuating revenue growth.
- They rely mainly on debt credit.
- This company has become a global brand by investing in various countries selling diversified products and services thus winning consumer confidence.
Opportunities:
- There is an opportunity of growth by increasing the market share through mergers and acquisition as well as joint ventures.
- There is an opportunity of collaboration with companies in the waking up giants ( India and china) to increase technology in production and reduce cost in production.
- Incorporate new technology so that they can stay ahead of the competitors.
- Launch other products to attract more customers and link with peoples changing lifestyles.
- Introduce online marketing and distribution to attract more customers.
Threats:
- keeping control in family unit
- Debt is growing to the level of total assets this may drive the company out of business.
- There is expensive borrowing due to financial crisis.
- Operating in many countries subjects the company to many rules and regulations.
- There is stiff competition from direct and indirect competitors.
- Expansion through mergers, acquisitions, joint ventures and takeovers may lead to failure.
- The biggest threat Starbucks has at present is from direct competitors since some of them are having highest growth.
Pest analysis
Technological factors: Technological factors have played a big role in the growth of the industry. The company has implemented electronic system and it shows that the company strengthens its technological development at the same time as a marketing strategy in expanding its global market. The company has also employed information technology in coordinating its functional areas of operation such as financial department, marketing department, operations department and human resource departments.
Demographic factors involve a diverse population with different language and diverse culture. They can interact with the different diversity in their customer profile through different level of advertisement that fit different population groups. Demography is also significant because the labor force come from the local population. The population among the American citizens consists of learned people and so the company has an advantage of well qualified and experienced work force.
Political situation:-Politics play a big role in ensuring a stable environment. USA has a stable political environment and this has assisted in maintaining a stable environment which has allowed businesses to thrive. Although the country has a federal system of governance, the general political arena is stable. This has provided an environment that has enabled Starbucks to grow.
Social and cultural trends:-Social and cultural trend define the people mode of line. This is important especially during advertisement, pricing, place of distribution and packaging. Being sensitive to people culture is of benefit especially if it comes to packaging whereby modes of packaging do not offend peoples culture.
Discussion
The strategies as suggested should be based on controlling the costs and operations to make the venture more profitable. By reducing the investments Starbuck will be able to focus on its existing sites. For starters it will be best if Starbuck invests more in advertising, stop its activities relating to breakfast sandwich program and focus on drip coffee so that Starbuck does not lose any more customers but enhance its sales and squeeze out the most profits that is available in the market.
The company has for the last five years focused in increasing revenue through increased marketing force. The organization has complied with all the laws including accounting and auditing standards as provided by relevant authority. However at the beginning of the year 2000 the company experienced a downward trend in profitability and the management tried to make things look good although the act was not illegal but it was not supported by any law. This led the auditor to question reasons for change of policy of accounting. The change of accounting policy was unethical although it complied with generally accepted accounting standards and auditing standards, the change was intended to ensure that the books looked good and healthy.
The organization improved internal control by creating a friendlier communication system that has assisted them to reach the current profitability level which they are enjoying.
References
Davis, H.Z,. and Peles Y.C (1993), measuring equilibrating forces of financial ratios.
Eisen, P. (2003) Accounting the Easy Way; Barron’s Educational Series.
Godfrey, J., Hodgson, A., Holmes, S. and Tarca, A., (2006), Accounting Theory, 6th edition, Milton: John Wiley and Sons.
Industry and Starbucks Ratios. Web.
Largay, James A I and Clyde P. Stickney, (1980); cash flows, ratio analysis and the W.T Grant Bankruptcy, financial analysis journal.