Executive Summary
Dollar General would have to make strategies that must take advantage of industry opportunities, protect the company from industry threats, make use of company’s strengths and avoid or strengthen company’s weaknesses (Byars, 1991).
First, it must establish strategic alliance with related industry players. Doing will more or less lessen strong rivalry of existing players and by establishing strategic alliance since it’s a form of collaborative strategy. It will also neutralize the industry threat of high bargaining power of buyers. An illustration is by having strategic alliance with Procter & Gamble to ensure the delivery and availability of needed products by customers.
The same strategy will take advantage of the industry opportunity and would make it more profitable for the company as the company will have more brands to bind its customers to a more long term relationship. The company’s good liquidity will also made use to increase profitability. Establishing strategic alliance will also correct or put in balance the company’s weakness of highly leverage position.
Additionally, Dollar General is advised to invest on Research and Development Cost to shift to differentiation as a better strategy. By so doing it would avoid the industry threat of strong rivalry among existing players in the industry since this would strengthen its branding strategy and at the same time develops new products needed by the market to create an advantage over competitors.
By focusing R&D on what will make its product unique and different other buyers may be neutralized or at least be warned of the high risks of spending resources that will not produce the expected rewards for more profitability. It will also build customers brand loyalty and without the need to compete basically on price, will make use effectively of its resources being generated from operations and may strengthen eventually is capital structure because of expected higher profitability.
Introduction
Dollar General Corporation, originally founded in 1939 as J.L. Turner and Son, Wholesale, is the largest retailer in the United States by the number of stores, with more than 8,000 stores located in 35 states, primarily in the southern, southwestern and eastern United States, as of February 2, 2008. It serves a broad customer base and offers a focused assortment of everyday items, including basic consumable merchandise and other home, apparel and seasonal products. Majority of its products are priced at $10 or less and approximately 30% of its products are priced at $1 or less. The company also offers a compelling value proposition for its customers based on convenient store locations, easy in and out shopping and quality name brand and private label merchandise at highly competitive everyday low prices. The company believes in the combination of value and convenience which makes the company different from other discount, convenience and drug retailers.
Although founded in 1939 as J.L. Turner and Son, Wholesale, the company was able to open only is first dollar store in 1955, after it was first incorporated as a Kentucky corporation under the name of J.L. Turner and Son , Inc. It latter changed its name to Dollar General Corporation in 1968 and reincorporated as Tennessee corporation in 1998. It rapid expansions were notable in recent years, as evidence by the increasing it its total number of stores from not less that 5,500 as of February 1,2002 to more than 8,000 as of February 2,2007, or an 8.2% compounded annul growth rate (CAGR) in terms of number of stores. At the same period, the company’s net sales increased from $5.3 billion to $9.2 billion or 11.5% CAGR. The increase in revenues could have been driven by the growth in number of stores as well as the increase in store sales growth in units. The fourth quarter of fiscal year 2006 also saw the company announcing its plans to slow its new store sales growth for 2007 and closed approximately 400 stores in order in order to advance its profitability while focusing on improvement of the existing stores.
Macro Environmental Analysis
The significant macro trends in for the past five years from 2003-2008 which are discussed under this sections include the promising trend of the Information Technology (IT) along with the telecommunication industry, the USA demographic shift and the much felt recession in the US economy which came about as result of the financial crisis.
The emerging trend of Internet and telecommunication
Both information Technology and telecommunication industry have shown much changes which can only have to produce undeniable effects in business particularly in keeping the world economies running and how business entities and many people try to interact to each other. These developments are believed have in fact driven business activities globally. This could be evident in terms of number of world internet users which was found by Euromonitor (2008) to have reflected growth rates of 16.3% and 13.6% in 2006 and 2007 respectively. The increase of internet users could be the cause of increase in the value of global online shopping expenditures which manifested growth rate of 25% from 2005 to 2006. The huge increase is clearer when compared with the higher than 0% growth rate of global online shopping expenditure in 2001-2002 as reported by Euromonitor (2008).
Shift in Demographic in the USA
The demographic in the USA has significant effect to the world economy on the mere premise that USA is one of the most powerful countries in the world in terms of size, politics and economies. The increase in the number of Hispanic populations in the United States and the retirement of baby boomer generations are some of notable changes in population structure that will surely affect how business is done in terms of changes in taste and preference as well as choice of what goods and what price to settle as far as the retail industry is concerned. Census.gov (2008) cited the biggest minority group of populations like Hispanics which had increased from 35.6 million in 2000 or which then accounted for 12.6% of the US total populations to about 44.3 million in 2006 or 14.81% of the US total population (Census.gov, 2008). Hispanics share in the number to total population is forecasted to increase in the coming years (Census.gov, 2008).
The demographics would be further affected by baby boomer’s retirement. These baby boomers refer people who were born in the period of where there was a high birth rate between 1946 to 1964 which account for the 30% of the total US populations approximately (Kolosh, 2005).
The increase in the number of elder population will surely affect the US labor market with the related effects of the government social security income (Kolosh, 2005). According to Euromonitor, (2008), people from age 65 and up has grown at 1.8% in 2007 where such growth rate was much higher than 0.8% increase in population under the ages of 15 to 64 years old in the same year. A different growth rate was noted in comparison with prior years particularly when compared with 2002. In other words, a faster growth rate is notable for elder population and this could surely affect the income level of these people. This will in effect has a great influence on the demand for the industry product under the retail industry.
The then much-denied US recession but now has affected many Americans
The financial crisis in the US was believed to have snowballed from the crisis in subprime-mortgage which eventually was found to have cause many speculators around the world to put their investments in the US but only to find latter that so many borrowers were not really qualified to pay resulting to their incapacity to pay their loans and which triggered a loss for many banks connected with the financing of the loans. The problems were more evident in the case of the bankruptcy of Lehman Brothers, one of the biggest investment banks in the US and the financial problem that has affected American Insurance Group (AIG), also one the top US insurance companies. Until recently, the US Congress needed to pass a law about a bailout plan that would have to help solve the problems caused by financial crises. The financial crisis resulted to loss of many job employments that will have an effect of the power of the people to spend and to keep the economy running.
Industry Analysis
This part applies Porter’s Five-Forces Model to determine the industry opportunities and threats. Opportunities are favorable conditions that could increase profitability of the players in the industry while threats are those that could lessen the said profitability for the same players
Threat from new entrants (High)
There is high threat from new entrants in the retail industry because the industry is not basically capital intensive and thus economies of scale could not be easily availed off.
Stores that deal with retail products in form of consumer goods could easily come into the industry. This therefore makes in unfavorable to present industry players because more competition means lower profitability. Although the industry may be expected to grow, the growth could easily be eaten up by entry of new players thus causing profitability to dwindle.
Bargaining power of suppliers (Low)
Bargaining power of suppliers may be considered low because there are numerous buyers or industry players in the retail industry from which these suppliers could sell. Although the industry may purchase a large amount of commodities products from its suppliers, the players may have to deal with s large and reliable suppliers to ensure availability and quality of their goods in store. In the case of Dollar General about 12% of the products it sells come from Procter and Gamble and only 6% is allotted to its next biggest supplier. Given the high number of suppliers including from outside the US, a strong rivalry of suppliers may only be presumed hence they do not have a leverage or power over retail industry players.
Given the size of size of suppliers, there appears to be weak force coming from these suppliers of capital, particularly because of existing rivalry also. This can be considered as industry opportunity since retailers could hope better profitability by exerting pressure on suppliers to bring down prices.
Bargaining power of buyers (High)
Bargaining power of buyers is believed to be high because there many customers and there could be no switching cost at all to another retail stores or products.
Almost every family or individual that uses consumer goods has a wide array of choices from market. This is a threat to the industry as it could leave buyers shifting from one retailer to another.
Threat from substitute products (Low)
Threat from substitute is low because the numbers of substitutes are not high since consumer goods are closely allied with basic needs and wants. Although companies may be using branding strategy, buyers have become wiser since what they really need especially in times of financial crisis is to just prioritize the basic needs.
Rivalry among Existing Firms
Intensity of competition (High)
There is a strong rivalry of among existing firms as would decline in the profitability of the players. This is therefore a threat for players as they compete for the market, they would have to increase cost and thereby reduce their profitability. This is based on the maturity of industry in the Canadian and US markets with expected growth of only 1.9% annually from 2000 to 2005. The rivalry has actually resulted to consolidation from more to few players (Hunger, 2002).
Competitive Analysis
The competitors included as part of this paper is Wal-Mart and Target. The company claims to compete in the deep segment of the US retail industry.Thus its competitors include “dollar stores,” as well as other retailers offering discounted convenience items. The deep segment part of the retailing industry is believed to be characterized by the stores offering lower prices in a convenient and small-store format done on a consistent basis. The company as part of the “dollar store” sector, claims to have a convenience advantage compared with discount supercenters because its prices are comparable with the latter so as to allow the company to compete effectively (Dollar General, 2008)
Wal-Mart is also US-based Company and has its stores in many parts of the US. Wal-Mart may be characterized to have been engaged in bigger markets than Dollar General but its supercenters are in direct competition with the former in terms of lower prices than ordinary retailing. The company’s operations are divided into three major segments: Wal-Mart Stores, Sam’s Club and International with the first constituting the largest segment of its business. Wal-Mart Stores make about more than 60% of its net revenues based on company’s financial data as of fiscal year ended January 31 (MSN, 2008).
Wal-Mart Stores, while being operated under three different formats in the US, also serves its customers through online retail operations under walmart.com. The Sam’s Club segment is run via membership warehouse clubs in the US and also functions through online retail operations called under samclub.com. Compared with the more than 60% for total revenues for Wal-Mart Stores, Sam’s Club accounts for less than 12% of the company net sales for 2008 (MSN, 2008).
Another competitor of Dollar General in the retail industry is Target. Target Corporation operates its retailing business through general merchandise and discount stores under the names Target and Super Target Stores also in the United States.
The company offers everyday and fashionable and differentiated merchandise which is believed to have kept the company’s business also for years after its establishment in US. It credit card operations are considered strategic and important part of core retail business through which the company sales revenues are kept at good levels (MSN,2008).
The Company, like Wal-Mart also operates an online business which is fully integrated under the name Target.com. Its general merchandise stores deal with a wide range of general merchandise and a limited assortment of food items, while its Super Target stores provide a line of food and general merchandise items. Target.com on the other hand makes available to customers a wide range of general merchandise, which includes a number of items located among its stores and complementary assortment in extended sizes and colors (MSN, 2008).
February 2008 records of Target would tell that the company has already more than 1,500 stores and by May 2008, the company had still put into operation additional 26 stores and more than ten (10) general merchandise stores and about 8 Super Target stores (MSN, 2008). Like Wal-Mart, the company must have to face the realities of legal and environmental laws as mentioned earlier.
Internal Analysis
Financial Analysis
Financial analysis is constructed by comparing the overall financial situations of Dollar General and Wal-Mart based on their financial statements as retrieved from their latest 10-K for year ended February 1, 2008 while that of Wal-Mart for the latest year ended March 31, 2008.
General Analysis
Dollar General’s was formerly public traded company but ceased to be so starting in the third quarter of 2007. Hence there is no basis to determine the market price of its stocks in the stock market. Based on filed Form 10-K the company reported a net loss of $12.8 million in 2008 which indicated a negative growth rate when compared with 2007 $137 million in 2007. The sudden turn around from profit to losses on interest rates and losses due to debt retirements. Wal-Mart on the other hand is traded under the ticker symbol “WMT” which sells at $ 53.05 per share (MSN, 2008). Wal-Mart reported in 2008 $12.7 billion net income which increased $11.2 billion in 2007. The sharp increase is largely due continued increase in sales and its lower operating expenses in relation to sales compared to competitors.
Financial Ratios and Analysis

As to profitability Dollar General appears to less profitable compared with Dollar General. While Dollar general had negative profit margin, Wal-Mart has positive 7.8%. Even in terms of return on assets and return on equity, Wal-Mart has performed better.
Return on equity of Dollar General shows many things about the how the company has performed financially in the past two years from 2007 to 2008. From 7.9 in 2007 it suddenly went down to negative 0.47% in 2008, which is an indication of surprise. See Table I in Appendix A.
A deeper analysis of the sudden fall in profits is explained by the losses from interest rates and debt retirements incurred in 2008.
The fall in 2008 in profits is also significant because it was in the last quarter in 2007 that it ceased to be publicly listed. It cannot be asserted that the loss was due to its having ceased as publicly listed since its posted it net income at a positive figure in 2007. It is notable that the company has still reflected increase in sales and operating margin dwindled only a little. This means that the company could still be profitable if it could avoid what has caused its losses in 2008.
As to liquidity, which measures the capacity of a company to meet its currently maturing obligations using the current ratio and the quick asset ratio (Bernstein, 1993; Brigham and Houston, 2002), Dollar General may be asserted to be liquid. To understand liquidity there is a need to understand how to compute these ratios. Current assets divided by current liabilities will produce the current ration while quick assets divided current liabilities will produce the quick ration. Quick assets of the company, which must be the numerator in computing quick ratio, would consist of cash, marketable securities and accounts receivable. Notice that inventory and prepaid expenses are not part of quick assets but are considered current assets. From a decision maker’s view and the use of quick asset ratio would be more much relevant if the intention is to have higher form of measuring liquidity.
To apply the concepts, the quick ratios of Dollar General are 0.26 and 0.14 for the years 2007 and 2008 respective while the current asset ratios for same years are 2.09 and 1.77 respectively.. See Table I in Appendix A. Both ratios have shown decreasing trend and the same must be understandable because of the decline in profitability in 2008. Operations normally generate profits and funds that should make a company liquid. Therefore a loss in operation will constitute loss of funds to meet maturing obligations.
Dollar General’s reported current ratio of 1.77 is higher than 0.81 of Wal-Mart. See Table I in Appendix A. This indicates that Dollar General is more liquid or is faster in generating cash from its operations than Wal-Mart and has better ability of paying its short term obligations.
As to solvency, Dollar General also showed an inferior position in terms of debt by having debt ratio of only 2.20 which is higher than Wal-Mart of 1.53.. See Table I in Appendix A. The lower the debt equity ratios, the better it is for the company since its means less exposure to risks. This means that Wal-Mart has debt obligations in relation to capital investment from owners of less than 1.53 times while Dollar General had more than 2 times in relation to equity investments.
Dollar General’s solvency refers to the company’s long-term capacity to keep up it stability over the long term. Normally measured by the debt to equity ratio, with the formula of having the total debt of the company divided by its total equity, the said measures of solvency may or may not assure investors that the company is not to just to exist in the short term but it must also have a long life to recover long term investments which takes years to produce the needed returns.
To have a good solvency is to have of good capital structure. Given the low profitability for Dollar General which reflected negative return in 2008, its solvency is at risk and if this low profitability will continue solvency will further deteriorate and could even cause its present good liquidity position to suffer.
Value Chain Analysis
Value chain analysis is constructed by comparing primary activities and support activities of Dollar General and Wal-Mart. Wal-Mart was used for comparison with the company on the ground that the former is currently the well-suited competitor and that information about the said competitor could be accessed as a publicly listed company to provide better venue for analysis. The rate given for each activity is basically derived from the companies’ Form-10K as filed with the Securities and Exchange Commission and other reliable sources.
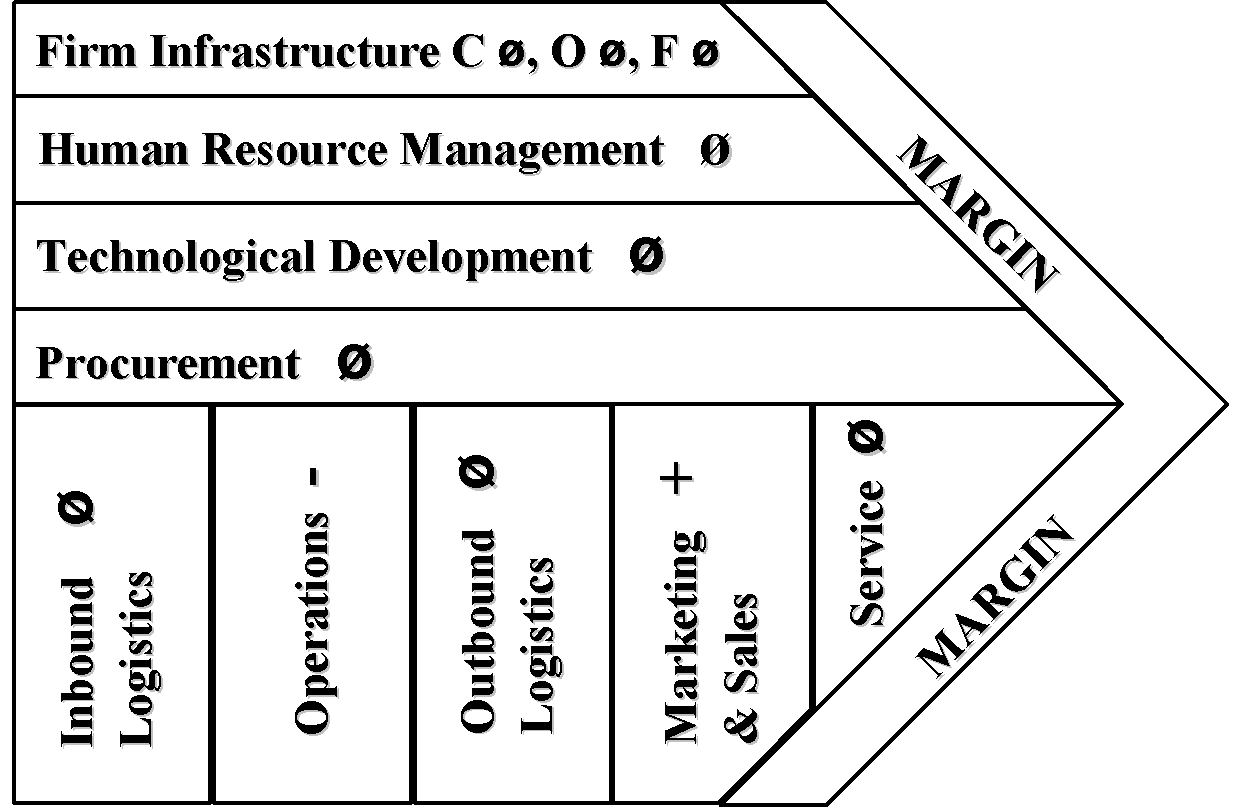
Primary Activities
Inbound Logistic (Negative)
Both companies’ operate different stores from various states of the United States. Dollar General’s currently owned 8,194 stores as of February 2008, while Wal-Mart owns 121 Wal-Mart Stores as of March, 2008. For the merchandise to reach the stores, both companies also employ the use of distribution centers and distribution facilities. Dollar General operates a total of 9 distribution centers wile Wal-Mart operates 24 Sam Club distribution centers and 145 distribution facilities. Of the nine distribution centers, six is owned by Dollar General while the others are owned by third parties. Of the 145 distribution facilities, 113 are owned by Wal-Mart while the remaining 32 are owned by third parties. The distribution centers and facilities ensure the quality and availability of main products for the stores although for both companies deliveries could be done directly to the stores directly from suppliers. Since Wal-Mart appears to have better distribution net work, it could be asserted that Dollar is less superior in this aspect.
Operating Activities (Negative)
Dollar General’s has a total of more than 8,000 stores which are manned by few people. Wal-Mart has not more than even 1/8 of this number. However the latter has bigger stores in the form of supercenters. Dollar General’s average location size is much smaller too compared with Wal-Mart.
The operations of the companies are measure in square foot and as of February 2008, Dollar General had 57.376 million square foot while Wal-Mart had 566,629 million square foot of 566,629 as of March 2008. Since Dollar General has operating income of $246.1 million while that of Wal-Mart amounted to $21,996, it would come out that Dollar General is operating less efficiently than Wal-Mart as $4.29 operating profit per square foot compared with Wal-Mart’s $25.76 operating profit per square foot. It is therefore evident that Wal-Mart is generating more operating income per square feet than Dollar General’s, because of the economies of scale as enjoyed by Wal-Mart. Thus, the negative score of under operating activities for.
Outbound Logistic (Neutral)
Customers are able to pick up their purchase or orders at the nearest stores for both companies. Because of lack of evidence that would show that one is better than the other, it could well be deduced that their standings as far as outbound logistic are neutral.
Marketing & Sales Activities (Negative)
Dollar General’s reported an increase in sales of 4% in 2008 from 2007 which is lower than 9% sales growth in the same period for Wal-Mart. Operating expenses in relation to sales was 25% for Dollar General while it was only 18% for Wal-Mart. Definitely, Wal-Mart is better in comparison.
Service (Neutral)
No after sales service data for both companies could be attained hence neutral activity is assigned.
Support Activities
Firm Infrastructure
Culture (Neutral)
Dollar General and Wal-Mart appear to be hiring their employees from part time and dependent on the location of business, neutral is assigned for the activity.
Organization (Neutral)
The organization of people under at Dollar General is simpler since there are only few people in as store as compared to more personnel in a typical Wal-Mart Store. This paper therefore believes that decision making for both could still be considered neutral in the absence of direct evidence that one is better than the other.
Financial (Neutral)
Dollar General’s is given negative on the basis of lower net profit margin for 2008 as compared with Wal-Mart. Dollar General had a loss for 2008 while Wal-Mart had a positive profit margin for 2008. However, Dollar General is more liquid at current ratio of 1.77 in 2008 as compared with 0.81 current ratio of Wal-Mart. In terms of debt to equity ratio, Wal-Mart is better at 1.53 in 2008 as compared with Dollar General’s ratio of 2.20. Thus, neutral is assigned for the activity.
Human Resource Management (Neutral)
Both Dollar General and Wal-Mart has significant employee turnover every year for their part-time employees. Hence one may not be said to have an advantage over the other.
Technology (Neutral)
Both Dollar General and Wal-Mart are dependent on the use of IT for the faster processing of information. In the absence of significant evidence of one company better than the other, this paper assigns neutral relationship.
Procurement (Negative)
Dollar General may be asserted to have a lower access to cheaper products that could be purchased by volume as compared with Wal-Mart which has established global relationships with its suppliers.
Resource Based View Analysis (VRIO)
Dollar General’s accessibility to customers
Dollar General’s accessibility to customer is considered a competitive parity resource. It is a valuable resource because the company uses this reach customers offering them convenience of having the goods that they usually buy.
Low-Cost Pricing
The company’s claims to be part of deep part of the retail industry because of its survival despite the existence of discount stores and superstores by offering low-price product because it keeps it fixed cost low in relation to competitors. It can be considered however as a competitive advantage since it could not be costly to imitate for companies like Wal-Mart which may have its economies of scale because of extensive distribution network using its strategic distributive facilities all over the US. It is really very hard to compete at prices and this could be contributing to company’s earning negative margin in 2008.
Branding
Dollar General’s use of combination of name brands allows the company to offer value proposition to its customers by using the same in combination of quality private level products. It could build customer loyalty to brand making customers to make frequent repeat orders.
As part of Dollar General’s strategy the company has generate sales growth for many years. However although it could be costly to imitate, Wal-Mart also puts its own brands, thus it could only be considered as comparative parity.
SWOT Summary
This part in effect summarizes the discussions made in the external and internal analysis using the general environment, Porter’s five force, value chain, financial analysis and VRIO analysis.
Strengths
These are conditions or characteristics of the company which could be tapped by the company in its design of its strategies. The following are the company’s strengths.
Market Leader in an Attractive Sector
The Company may be considered to be the largest discount retailer in the United States based on the number of stores. The company has more than 8,000 stores in 35 states as of February 2008. It claims to be the largest player in the US small box deep segment with sales in excess of 1.4 times than its nearest competitor in 2007. It also claims that it is well-positioned to further increase its market share as it continues to execute its business strategy and implement its operational initiatives. It target customer are those seeking value and convenience.
Consistent Sales Growth and Strong Cash Flow Generation
The Company has experienced annual growth in sales revenues for 18 consecutive years. It sales of consumable products constituting about 66% of its net sales are less susceptible to economic pressures such as increased in fuel costs and rise in unemployment. The remaining 1/3 of its net sales are mainly seasonal, basic clothing and home products which cannot be easily affected by trend risk.
Differentiated Value Proposition
The Company has the ability to deliver highly competitive low prices in a convenient location and shopping format provides its customer with a compelling shopping experience that would distinguish it from its competitors from the ordinary discount retailer and drug store retailers.
Minimal Investment capital requirement and short payback period
The company could easily expand because of low capital to start a store where it incurs approximately $250,000 as initial capital including its inventory requirement. This would further strengthen the company’s favorable cash generation activities
Efficient Supply Chain
The company believes that its distribution network is an integral part of its efforts to reduce transportation expense and effectively support it growth. It had made significant investments in technological improvements and upgrades which thereby increased its efficiency and capacity to support its merchandising and operation activities as well as future store growth.
Generally Liquid
The company is generally liquid with current ratio of 1.77 in 2008 and 2.09 in 2007. The company’s capacity strength to weather short-term insolvency could be further used to improve profitability
Weaknesses
The company has also to weak points which it should make stronger or avoid in its design of its strategies so that it could accomplish its objectives.
Low Level of Profitability
The company’s low profitability is evident in is below average return with negative net profit in 2008. If this would continue, it may eventually lose is good liquidity position.
Highly leveraged Position
Its debt to equity ratio may have been low in prior years but in 2008 it has reached a level of above 2.0 which makes the company to risky to expand without infusing additional capital from stockholders.
Opportunities
These are derived basically from Porter’s five forces and the greater macro-environment that may cause decline in the profitability of the company.
Threats
- High Bargaining power of buyers: This could aggravate the company’s low profitability as customers would need to cut their expenditures due economic pressures cause by present recession in the US
- High availability of product substitutes: This could lessen the chance to compete because of low switching cost from customers.
- High rivalry of competitors: As found earlier, this forces existing player to for profits as evidenced by the competition in terms of prices
- Ease of entry by new entrants: Not requiring much capital could actually encourage more to come in easily to the retail industry.
Metrics and Histories
This will discuss e 2-3 internal measures that the CEO or top management team of Dollar general should monitor to guide the company towards success and what has been the history of these metrics in the past 3-5 years.

The key indicators that will be used to measure the success of Dollar. General would include sales growth, above average net margin, above average return on assets and above average return on equity. These metrics and history is constructed using as basis information that could extracted from Dollar General 10-K for the years 2004-2008).
Sales Growth
The company’s sales growth in the earlier three years from 2005 and 2006 indicates a consistent growth until a decline was experienced starting 2007. This increasing trend of sales growth in past could be an indication that prior years strategies produced positive results but not in the last two years of 2007 and 2008. If the company could recall its strategies in the past, it could have applied the same in 2007 and 2008 but the results were then different. It means that changing conditions require change in strategies. Thus this paper has conducted both external and internal analysis. This should be enough to put the company back on track of profitability by taking advantage its industry opportunities.
Positive and Above Average Net Margin
Dollar net margin were almost maintained at 4% for the years 2005 and 2006 until a decline was noted starting in 2007. This means that is net margin is directly related to the sales performance. The company must therefore ensure that it will have increasing revenues over the years. In the nature of things, sales should growth as matter of economic reality because of increasing population. The company should aim for rates even higher than net margin of 4% because, the company may not be recovering its cost of capital. The next metrics which must be tied with net margin and sales are return on assets and return on equity.
Return on Assets and Return on Equity
The company will have to make sure that it will have to earn above its cost of capital by maintaining at least 12% in return on assets and 20% in return on equity as what happened years earlier than 2007 and 2008 before the decline.
Strategy Formulation
The company’s strategies are based on industry opportunities and threat as well as company’s strengths and weakness. The strategies must take advantage of industry opportunities, protect the company from industry threats, make use of company’s strengths and avoid or strengthen company’s weaknesses (Byars, 1991).
Strategy Number 1 – Establish Strategic Alliance with related industry players
Basis: Industry threat of strong rivalry among existing players in the industry. The strong rivalry will more or less be neutralized by establishing strategic alliance since it’s a form of collaborative strategy.
Basis: Industry threat of high bargaining power of buyers. Great number or group of buyers would be more or less focused on group or product that may belong to company that will have made its brand known to its customers because of its tie up with a big and know industry player. This make involved making an alliance with Procter & Gamble.
Basis: Industry opportunity of low availability of product substitutes. The strategy will take advantage of the industry opportunity and would make it more profitable for the company as the company will have more brands to bind its customers to a more long term relationship
Basis: Company strength high liquidity. Establishing alliance requires profitability and other financial strength to attract partners or collaborators in the industry.
Basis: Company weakness of highly leverage position of the company. Making an alliance with a less leverage position could at least minimize the risks and put the company’s financial structure in proper balance.
Strategy Number 2 – Invest on Research and Development Cost to shift to differentiation as a better strategy
Basis: Industry threat of strong rivalry among existing players in the industry. The company could strengthen its branding strategy and at the same time develops new products needed by the market to create an advantage over competitors.
Basis: Industry threat of high bargaining power of buyers. By focusing R&D on what will make its product unique and different other buyers may be neutralized or at least be warned of the high risks of spending resources that will not produce the expected rewards for more profitability.
Basis: Industry opportunity of great availability of product substitutes. By differentiation, branding will be pursue that could build brand loyalty and without the need to compete basically on price.
Basis: Company strengths of high liquidity. The company will make use effectively of its resources being generated from operations.
Basis: Company weakness of highly leverage position of the company. The company may strengthen eventually is capital structure
References
Bernstein (1993) Financial Statement Analysis, IRWIN, Sydney, Australia.
Brigham and Houston (2002) Fundamentals of Financial Management, Thomson South-Western, US.
Byars, L. (1991) Strategic Management, Formulation and Implementation – Concepts and Cases, New York: HarperCollins.
Census.gov. (2008).Hispanic Population of the United States. Web.
Dollar General, 2004-2008 Annual Reports, Form 10-K, Web.
Euromonitor International (2008). Economic Indicators. Global Market Information Database for Texas A&M University-Corpus Christi.
Kolosh, Kenneth. (2005). Preparing for Baby Boomer Retirement. Web.
MSN (2008) Stockprice of Wal-Mart, Web.
MSN (2008b) – Income Statement of Wal. Web.
MSN (2008) – Balance Sheet, Web.
MSN (2008) – Wal-Mart, Company Report, Web.
MSN (2008) – Target Company Report, Web.
Wal-Mart , Form 10-K, 2008. Web.
Appendix