Ratio analysis
Liquidity
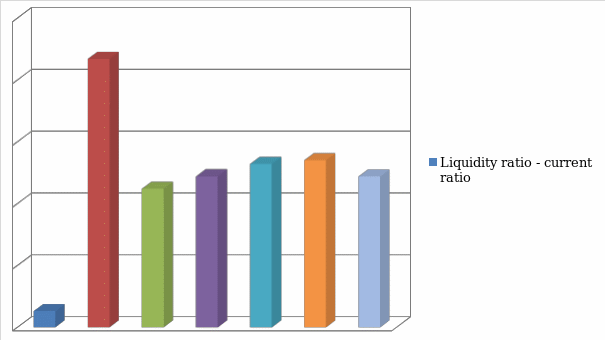
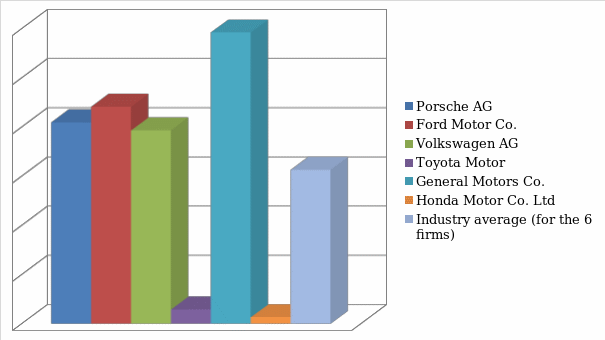
The Porsche AG’s liquidity ratio as measured by current ratio is less than 1 this means that the firm is facing liquidity risk because for a firm to be liquid its current ratio must be more than 1 representing a margin of safety for the creditors where the higher the ratio the more liquid the firm is and the more confident the creditors will be with the firm. The situation implies that the firm was not be able to meet short-term maturity obligations on time as the current liabilities cannot be sufficiently covered by the current assets. The company is underperforming in terms of liquidity as compared with the industry average of the six firms (Porsche included) as well as its five competitors, Ford Motor, Honda Motor, General Motors, Toyota Motor and Volkswagen AG, implying that the company held a greater amount of current liability as compared with most firms in the industry. The graph below indicates that Porsche was the only firm with a lower current ratio. This implies that the firm was not satisfactorily liquid (Yahoofinance.com).
Management ratio
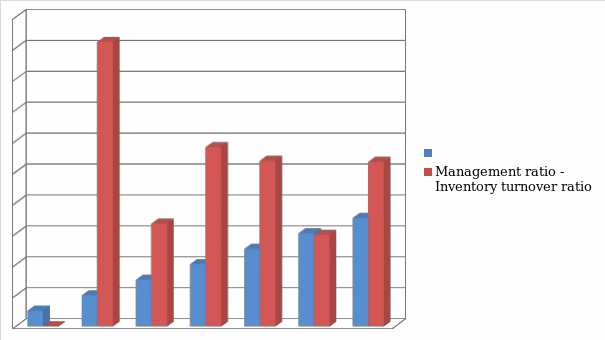
Porsche’s inventory turnover was zero or undefined meaning that the firm did not have any inventory in the year 2009 and 2010 thus there were no sales or even cost of sales. This situation means that the firm was not using its assets to generate sales thus assets were not efficiently managed by the firm. In other words, working capital of the firm was not efficiently managed. Porsche was underperforming in terms of efficiency when compared to other firms in the industry as shown by Graph 2. Therefore, Porsche production efficiency deteriorated since it did not have inventory, and since there was no inventory there were no revenues generated through sales. Finally, the firm’s efficiency of converting stock into sales was very low (Yahoofinance.com).
Profitability ratios
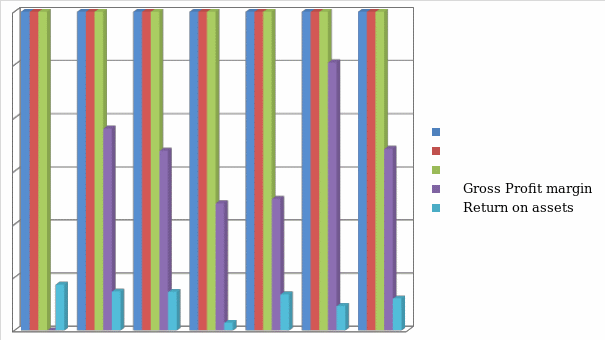
Porsche profitability as measured by Gross Profit Margin (GPM) and Return on Assets (ROA) shows that the profitability of the firm is high as measured by ROA. This implies that Porsche utilized its capital employed efficiently to generate returns to the providers of funds. Based on ROA, Porsche is more efficient than its five competitors because it has a higher ratio, as shown on Graph 3, and it is also performing above the industry average. Since there were no sales Porsche does not have Gross Margin but based on the competitors and the industry performance Porsche may be said to have a good profitability which means the management may be effective in using the capital employed (Yahoofinance.com).
Gearing ratios
As shown on Graph 4, Porsche’s earnings cannot cover current interest charges as measured by coverage ratio this is because the firm incurred a loss in the year 2010 (Porsche.com). This low ratio implies that the firm is using excessive debt and it is not acceptable because the ratio is lower than the acceptable 3. Compared with the industry average and its competitors Porsche together with Ford Motor and Volkswagen AG are the only firms with low coverage ratio, this means that these firms are using a lot of debt to finance their projects. In such a case, then Porsche is at a risk of insolvency due to non-payments of interests accruing from these loans (Yahoofinance.com).
Table 4: Coverage ratio
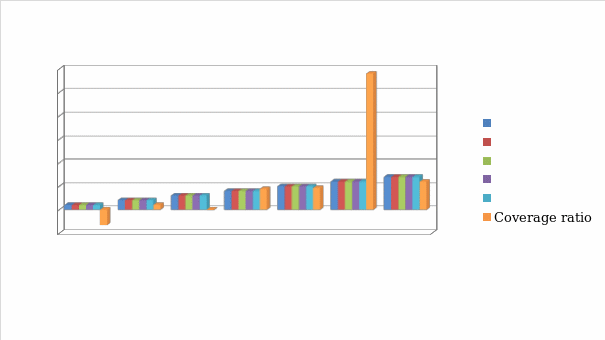
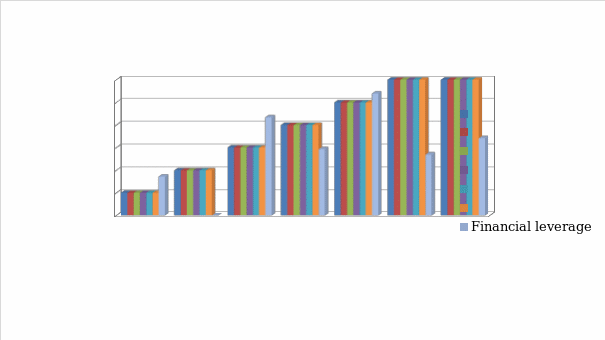
On the other hand, financial leverage is another measure of gearing in which the assets of the firm are compared with the firm’s equity capital; that is ratio measures the proportion at which the firm employs debt financing where a ratio of 2:1 is preferred. Porsche has the financial leverage ratio less than 2 this means that the firm is not using a lot of debt to finance its assets (Porsche.com). Compared to its competitors in the Auto Manufacturers the firm is less geared as shown by Graph 5 therefore it does not have high financial risk (Yahoofinance.com).
Market value ratios
Based on Graph 5 below, Porsche’s investors will take 8.2 years to recover their initial investment in the shares of the firm from the earnings generated from the investment. Compared to the industry average or some of its competitors like Volkswagen AG, Toyota and Honda Motor, the firm has a high payback period (Yahoofinance.com).
Du Pont System
It is expressed as follows:
- ROE= (NI/Sales) x (Sales/TA)x(TA/Equity)
- ROE =(-379,000/ 0) x (0/28,152,000) x (28,152,000/14,555,000)
- ROE = 0
It mainly focuses on Asset Utilization (TATO), Expense Control (PM) and Debt Utilization (Eq. Muilt.) and it mainly indicates how these three factors mix allowing analysts to comprehend the superiority or inferiority of returns by assessing various firms in the same industry (Slideshare.net).
Effects of ratios improvement
In case of share repurchase which reduces the total number of outstanding shares. Once a firm buys back the shares, it frequently cancels the shares or may keep them in its books as treasury shares, and shares outstanding reduces at the same time (Slideshare.net).
The repurchase of shares reduces the total assets in the statement of financial position. Leading to increase in ROA because the assets are decreased and Return on Equity (ROE) rises because the outstanding equity has decreased. Generally, the market will view higher ROE and ROA as positive. The share repurchase also assists to enhance the firms’s Price/Earnings ratio; this ratio is known by many investors and is frequently utilized to measure the firm’s value. At oversimplification of risk in terms of Price/Earnings ratio, the investors frequently feel that lesser is better. Thus, after the repurchase the Price/Earnings ratio reduces as a result of decrease in the outstanding shares (Slideshare.net).
Ratio analysis limitations
Ratios are good measures as they condense accounting information presented by the firms in their annual reports, nevertheless, they have limitations which the user of ratios should put in mind. The limitations include; use of irrelevant information in making future decision, pays no heed to qualitative information such as human resource policies, management quality, experience, and morale of employees. Different users of accounting information will use different terms to depict financial information for example including preference shares in equity or referring to return on capital employed as gross capital employed. Finally, ratios are computed at a specific point in time they are analysed to make decisions and situations may change for example an increase in assets, decline in turnover etc. thus ratios computed at a point in time are only useful in the short run (Universalteacher4u.com).
Qualitative factors
The Porsche AG should consider these factors when assessing a firm’s future performance; some qualitative factors such as competition, regulatory and legal environment, future prospects and what proportion of the company’s business is produced abroad. If the company’s income is tied to only 1 main product, customer or supplier; these factors are relevant when making financial decisions and they are hard to gauge quantitatively (Smallbusinessnotes.com).
Works Cited
Porsche.com. “Porsche”. 2011. Web.
Slideshare.net. “Analysis of financial statements,” 2010, Web.
Smallbusinessnotes.com. “Financial ratios,” 2010, Web.
Universalteacher4u.com. “Ratio Analysis,” 2011. Web.
Yahoofinance.com. “Porsche AG (PAH3.DE),” 2011, Web.
Appendix
Table 1: Financial ratios

