Abstract
This paper gives an analytical report of financial analysis for a potential investor. Financial data for AstraZeneca for three year period from 2008 to 2010 is used. The study is based on a comparative analysis of historical data of the entity. It concentrates on the statistical highlights of the group and ratio analysis (ratios on profitability, liquidity, financial gearing and efficiency). Graphs are used to portray the trend of various variables in the study over the three-year period. The results are interpreted in comparison with ideal situations and recommendations are made to a potential investor based on the findings. An in-depth evaluation of accounting principles used in the preparation of AstraZeneca accounts is carried out. Finally, the performance of the stock for the Group in the market is analyzed.
Statistical highlights
AstraZeneca was formed on “6th April 1999 through the merger of Astra AB of Sweden and Zeneca Group PLC of the UK”. The Group “discovers, develops, manufactures and market prescription medicines for six key areas of healthcare which comprises of the world’s most serious illnesses, that is, oncology, cardiovascular, gastrointestinal, infection, neuroscience, and respiratory and inflammation” (AstraZeneca, 2010, p.2). The Group has an active presence in over 100 countries with an expanding presence in emerging markets including China, Brazil, Mexico and Russia. The emerging-market generated over $5.1 billion in sales revenue in 2010. Further, it employs over 61,000 people with a large percentage that is, 46% in Europe. The financial statements for the group are prepared in accordance with IFRS as adopted by the EU. Revenue earned by the Group can be divided into the six key areas of healthcare. In the past three years – 2008 to 2010 – a large proportion of sales originated from cardiovascular. The area generated $ 9,403 million which is equivalent to 28.26% of the total sales in 210. Geographically, a large proportion of revenue was generated from the US market from 2008 to 2010. In 2010, it generated $13,727 which is 41.26% (AstraZeneca, 2010, pp.2-27). The table below summarizes financial performance for the Group
Summary of financial performance from 2008 to the 2010
Table 1.0 (All the amounts in this study will be in Dollars unless otherwise indicated)
The table above indicates that there was a decline in the rate of growth of profit after tax. This may be attributed to the expiry of patent right in the US market which generates a large proportion of revenue for the group.
Introduction
According to Adams (2006), financial statements as they provide a potential investor with a narrow insight into the strengths and weaknesses of a business. This is because what is reported does not give an in-depth depiction of the performance of an entity. Such a full view of a business is important as it would influence investors’ decisions on whether to continue their association with an entity and in addition, it would give potential investors adequate information that can aid them in decision making. This work will give an analytic report of the financial statements of AstraZeneca for use by a potential investor (Adams, 2006, p.12).
Accounting policies used by the group
As mentioned earlier, the financial statements are prepared in accordance with IFRS as adopted by the EU. As stated in the financial report, the Group makes estimates and assumptions that affect the reported amounts of assets and liabilities. The actual outcome may differ from the estimates. The most critical accounting policies and significant areas of judgment used by the group are as follows (AstraZeneca, 2010, p.92). The main accounting policy used by the company is revenue recognition. Revenue for the Group is recorded at the invoiced amount (excluding inter-company sales and value-added taxes) fewer movements in estimated accruals for rebates and chargeback given to managed-care and other customers and product returns. The Group’s policy is to offer a credit note for all returns and destroy all returned stock in the market. Further, revenue is recognized at the point of delivery.
The second policy is on research and development (R&D). Since the company deals with the discovery of medicines, a lot of money is spent on R&D. The R&D on internal activities to generate these products is charged to profit in the year it was incurred. Besides, the purchase of intellectual property to supplement the R&D is capitalized as an intangible asset. The third is the policy on litigation. Contingent liabilities may arise from day to day operations of the business. The Group’s policy is to disclose and not provide for litigations that have less than 50% probability of crystallizing or where they are unable to make reasonable estimates of the liability. Where a loss has more than 50% probability of occurrence and the amount can be estimated, the loss is absorbed or provided for (AstraZeneca, 2010, p.92).
Another policy is on taxation. Since AstraZeneca is a global company, it is governed by a number of tax policies in various jurisdictions. The Group is often faced with disputes with tax authorities due to transfer pricing audits. The disputes may result in either increase or decrease in tax profits. The policy of the Group is not to recognize the tax benefits unless the tax positions are probable of being sustained. The final policy is on segment reporting. Since the company is involved in single business activity of pharmaceuticals and it does not have multiple operating segments (AstraZeneca, 2010, p.92).
Financial analysis using ratios
According to Vance (2003) financial analysis is the process of evaluating businesses, projects, budgets and other finance-related documents to determine their suitability for investment. Basically, a comprehensive financial analysis is done on an institution’s financial statements to establish if an entity is stable, solvent, liquid, or profitable enough to be invested in (Vance, 2003, p.13). When looking at a specific company, the financial analysts will often focus on statements of income, statements of financial position, cash flow statements and statements of changes inequities (Adams, 2006, p.12). Ratio analysis is a key technique for financial analysis. This section will use ratios to establish the strength and weaknesses of AstraZeneca Group.
Profitability ratios
Various ratios are used to analyze profitability such as gross profit margin, operating profit margin, net profit margin, the return on assets (ROA) ratio, and the return on equity (ROE) ratio (Adams, 2006, p.12). The table below summarizes profitability ratios for AstraZeneca. Computations are based on reported operating profits.
Table 1.1Table of profitability ratios
From the table, the net profit margin increased from 19.40% in 2008 to 24.29% in 2010. This would indicate that the Group was able to generate adequate sales to cover fixed costs and also improved on profitability, this is the strength of the company. On the other hand was unable to manage well its inventory, pricing and production efficiency so as to remain at the same level of profitability. This is shown by the decline in gross profit margin from 82.40% in 2009 to 80.80% in 2010. To a potential investor, this is a weakness as it indicates that the profitability may not be sustainable if the organization is not able to effectively manage the cost of sales. The graph below shows the trend of profitability for the three years.
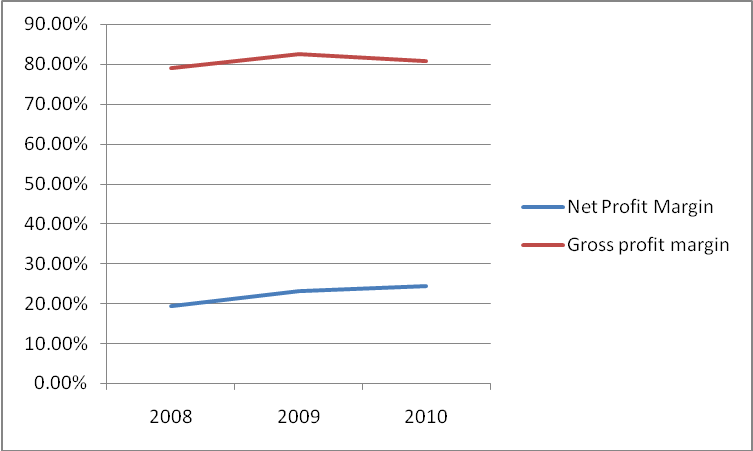
- Horizontal axis represents years
- Vertical axis represents the percentage change
Liquidity ratios
According to Brigham and Houston (2009), analysis of liquidity is necessary as it establishes the ability of an organization to maintain positive cash flow while satisfying immediate obligations, that is, the availability of cash to pay the debt. The computation of these ratios will be based on the cash flows or liquid assets (Brigham and Houston, 2009, p.87). Table 1.2 below gives a summarized computation of the ratios.
Table 1.2
From the table we note that the liquidity ratios have declined from 2008 to 2010. Generally, the liquidity ratios are lower than the ideal rates. The ideal rate for the current ratio is 2:1 while the quick ratio is 1:1. To an investor, low liquidity levels indicate that the Group is not able to adequately meet its current obligations. The graph below shows the trend of liquidity ratios for the three-year period.
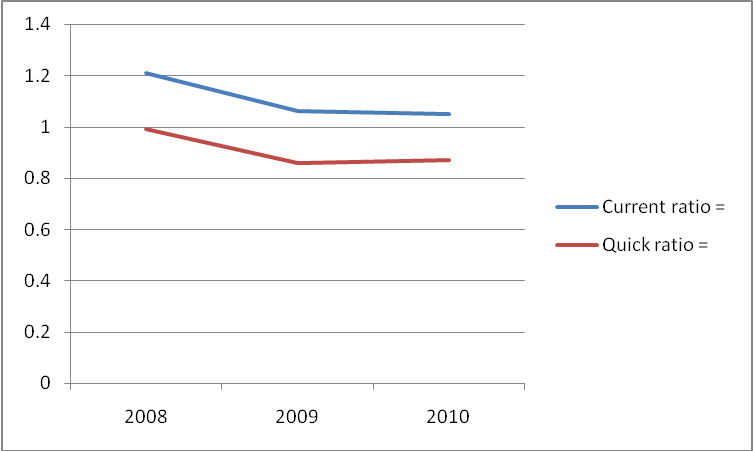
- Horizontal axis represents years
- Vertical axis represents the liquidity ratios
Financial gearing
Financial gearing shows a company’s vulnerability to risk, for example, the degree of protection provided for the business’ debt. Earnings before interest and taxes over interest charges will be computed to show the financial safety of the group. The table below summarizes the computations
Table 1.3
From the computations, the ratio has been erratic over the three year period. An increase in EBIT ratio, from 15.68 in 2009 to 22.23 in 2010, shows that the Group is more able to make interest payments or to take more debt while a decline, from 19.74 in 2008 to 15.68 in 2009 shows that the Group is unable to take more debt. This indicates a reduction in risk to investors as the debt portfolio has declined hence more returns to shareholders. To an investor, the irregular ratio is a weakness as the trend of financial gearing cannot be established with certainty. An investor may not be able to extrapolate the current situation into the future. The graph below shows the trend for the three years.
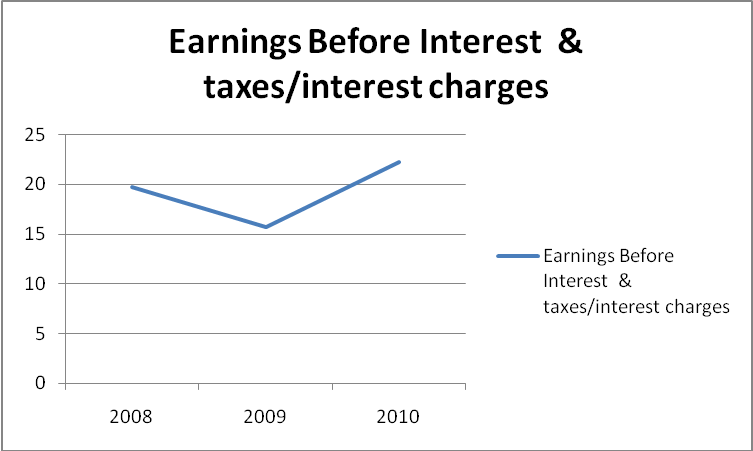
- Vertical axis represents financial gearing ratios
- Horizontal axis represents years
Efficiency ratios
Efficiency ratios provide an indication of how well the Group manages its resources, that is, how well a company employs its assets to generate sales and income. It also shows the level of activity of the corporation as indicated by the turnover ratios (Brigham and Houston, 2009, p.89). The table below summarized efficiency ratios for AstraZeneca.
Table 1.4: Table of efficiency ratios
From the table above, the level of activity for AstraZeneca has remained relatively stable over the three year period. Accounts receivable turnover declined steadily from 4.35 in 2008 to 4.24 in 2010. To a potential investor, it indicates that the level of activity of the Group is declining over the three-year period. This is a bad sign as it depicts the deteriorating level of activity.
Performance of AstraZeneca stock in the market
Vance (2003) states that the price/earnings ratio is commonly used to evaluate the performance of an entity. He further points out that historically, the average P/E ratio for the broad market has been around 15, although it can fluctuate significantly depending on economic and market conditions. A stock with a high price/earnings ratio suggests that investors are expecting higher earnings growth in the future compared to the overall market while a stock with a low price/earnings ratio suggests that investors have more modest expectations for its future growth compared to the market as a whole (Vance, 2003, p.16). The table below summarizes the performance of the stock of the Group in the market.
Table 1.4
From the table, the price/earnings ratio for the group has been declining from 10.9 in 2008 to 7.31 in 2010. These ratios are below the ideal rates. Also, they indicate that investors are likely to get lower returns for their investments. On the contrary, earnings per share and dividends per share have been increasing since 2008. Basic earnings per share were 4.2 in 2008 and it increased to 5.61 in 2010. Similarly, the dividend per share was 2.05 in 2008 and it increased to 2.55 in 2010. In the three-year period, the highest share price was recorded on 14th October 2011 at $53.26 while the lowest was on 3rd September 2008 at $30.24. Share prices have been fluctuating within that range. The graph below shows the trend of performance for the shares.
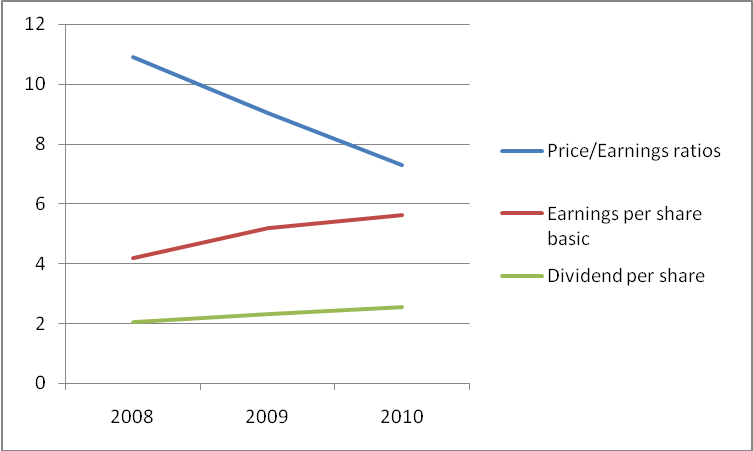
- The vertical axis represents price/earnings ratios and earnings and dividends per share
- Horizontal axis represents the year’s
Conclusion
Financial analysis can be complicated depending on the nature of the company. Comprehensive analysis of financial statements of a company that does not fall into a single industry tends to be more complex than those which fall in one single industry. Businesses of AstraZeneca fall in one industry, therefore, having a simple structure. From the above analysis, the profitability of the organization has generally increased in three-year periods as indicated by the profit margin ratios. The entity has poor liquidity as both the current and quick ratios are low and deteriorating. EBIT ratio has been erratic in the three-year period and therefore cannot give the trend of financial gearing for the Group. Further, the price/earnings ratio has declined from 10.9 to 7.31 over the three-year period. This may paint a bad picture to the potential investors as the return on their investment is declining.
Even though ratio analysis is a vital tool for financial analysis, it has several inherent limitations. For instance, it is not possible to come up with different averages for companies whose businesses cut across several industries. Further, various accounting practices are applied in various companies and it makes it difficult to compare the performance of two companies with different accounting practices. Despite the shortcomings, the results from ratio analysis are heavily relied on in the decision-making process. An investor should consider analyzing the performance of the Group for more years before deciding on whether to inject capital or not. This is because by comparing historical data of the company, internal weaknesses such as poor liquidity, the declining level of efficiency, aberrant financial gearing, among others are evident.
Reference List
Adams, D. (2006) Management accounting for the hospitality, tourism and leisure industries: a strategic approach, 2nd ed. Thomson ISBN-10: 1844801977.
AstraZeneca (2010) Annual report (online), Available from University of Missouri (2011) Financial ratios (online). Web.
Brigham, E. F. and Houston, J., F. (2009) Fundamentals of financial management 12th ed., USA: South-Western Cengage Learning.
Vance, David, E. (2003) Financial analysis and decision making: Tools and techniques to solve, United States: McGraw-Hill books.