The purpose of this report is to examine the performance of a firm and its products and to offer recommendations for performance improvements. The company selected for this report is Titanic Breweries, which produces two products: Titanic Brewery Plum Porter 500ML and Titanic Iceberg 500ML. Product performance will be explored in terms of the sales growth percentages. Additionally, target shopper market segments and core stores will be analysed, after which recommendation for performance improvement are presented.
Review of Product Performance
The product performance of Titanic Breweries can be examined through the sales across the stores in the country. Data collected shows that the product is sparsely distributed with only a few stores in the country selling the product. On average, Titanic Iceberg 500ML sells at £1.61 across all segments while Titanic Brewery Plum Porter 500ML sells at £1.54. The total units for each product are 23,490 and 93,250 for Titanic Iceberg 500ML and Titanic Brewery Plum Porter 500ML respectively. Additionally, the respective sales values are £37,810 and £143,968 across all segments. While the sales figures of the trading period show that the product has its potential, the major concern is the fact that very few distribution channels are available for the company as manifested by only a few stores accepting to sell the product.
However, a sample of stores and the categorization of the type of market can help determine the markets where the combined sales are highest for the two products. The chart below summarizes the sales units across the different markets.
The chart above illustrates that Titanic products perform best in the midmarket, upmarket, and price-sensitive markets for both products. However, it is important to highlight that the chart represents only a small sample of the total stores. Even so, it is apparent those stores heavily represented in the three markets have higher average sales units and prices. The growth in sales for the two products can also be critical indicators of performance as indicated in Table 1 below. Data shows that the sales units for Titanic Brewery Plum Porter 500ML rose from 51,290 units to 93,080, representing 81.5% growth. A similar projection for Titanic Iceberg 500ML has been observed with the sales units rising from 13,650 units to 23,460, which is a 71.9% increase. Therefore, it is possible to determine that the company’s products and brand are developing at an extremely high rate, which should be indicators of great prospects.
Table 1: Growth in sales for Titanic Brewery’s Products
Identification of Target Shopper Segments
The target shopper markets are groups into five categories: young adults, young families, older families, older adults, and pensioners. Table 2 below illustrates some markets are well-represented while others still have room for growth. For example, the best shopper market for both products is the older adults with 135 and 146 for Titanic Brewery Plum Porter and Titanic Iceberg respectively. The least-served market is the young families with 62 and 59 individuals for Titanic Brewery Plum Porter and Titanic Iceberg respectively.
Table 2: Target shopper markets for Titanic Brewery’s Products
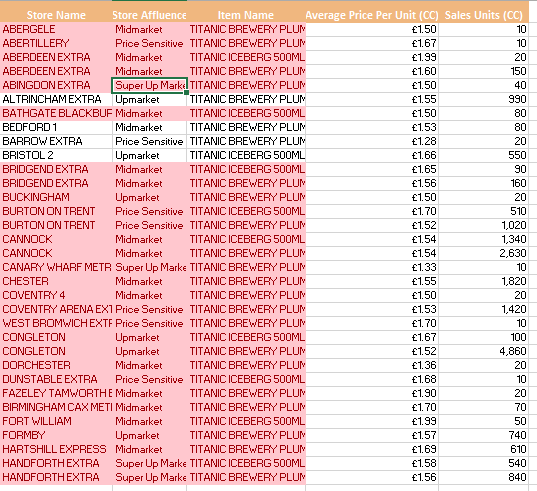
Across all markets, it can be seen that Titanic Brewery Plum Porter attracts more consumers than the Titanic Iceberg apart from the older families and older adults. However, the differences between the two products cannot be effectively represented in the above table. A broader perspective to the types of markets can be adopted to adequately show which markets the products sell well. The screenshot presented in Figure 2 below offers this information regarding alternative categorization of the markets that can be targeted by the company.
As mentioned earlier, the midmarket, upmarket, and price-sensitive markets represent the majority of markets where consumption of Titanic Brewery’s two products is high. However, it is not clear whether it is a matter of position or targeting of the brand, especially because there is a presence in all of them. According to Camilleri (2018), businesses may not be able to satisfy all their customers due to differences in tastes and preferences. Therefore, the target shopper markets presented in Figure 2 should serve as indicators of the company’s targeting and positioning strategies.
Identification of Core Stores
The core stores can also be represented in Figure 2 above because it shows the main stores that sell the company’s brands. The figure represents only a sample compiled from thousands of entries in a spreadsheet. However, the sores that record sales figures of above 1 unit are scattered across the entire data sheet, which means that only a handful of the channels sell the product. The total number of the stores is currently difficult to establish, but the entries shown in Figure 2 above should highlight the most important stores. It is assumed that the core stores represent those that sell above 100 units of each product. Such stores as Congleton sell 4,860 units of Titanic Brewery Plum Porter, but only 100 of the Titanic Iceberg. Such stores can be categorized as a core for one product and non-core for the other. Many stores display the same characteristic in that one product sells more than the other.
Determining the core stores for the product can be a sensitive affair because each of them sells at different prices. In marketing and other literature, prices tend to affect the demand of the total products consumed. According to Sharma, Sinha, and Vandenberg (2017), in other cases, prices are used to control the consumption of certain products, including alcoholic drinks. Additionally, different markets have different purchasing power, which would then neutralize the price effect.
Recommendation for Performance Improvement
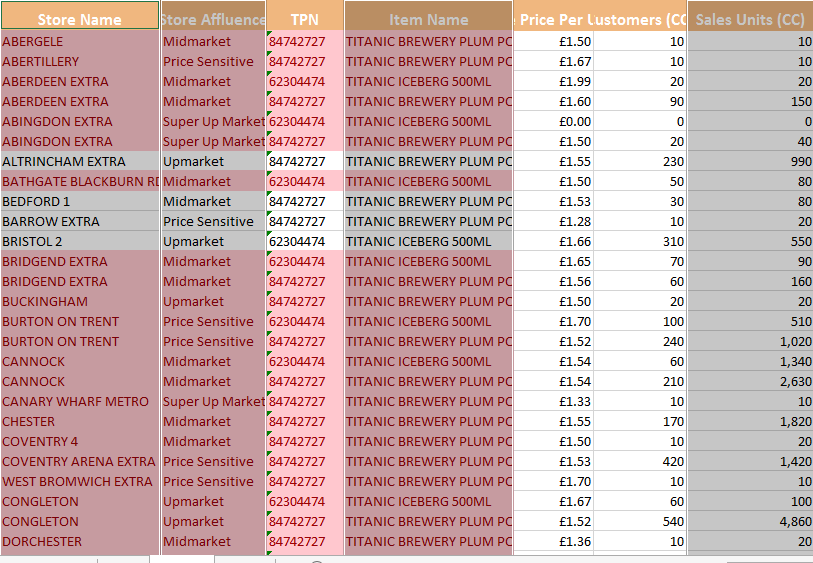
The current performance of the company indicates that there is much room for growth and new markets to be exploited. To boost sales and to enter new markets, price is often the first consideration for many businesses. According to Alkasim, et al. (2018, p. 192), the ability to sell at competitive prices tends to offer the business a sustainable edge. However, this approach goes far beyond the pricing strategies to include other such strategic decisions as cost leadership and operational efficiency. However, examination of the average prices of the company’s products in the different stores reveals that the price does not have as much effect as would be expected on the sales volumes and, therefore, on the market penetration, growth and expansion. A summary of the prices per unit and the number of units for each product sold at the different stores is shown in Figure 3 below.
As shown in the figure above, the price has no discernible relationship with the number of units sold. For example, Canary Wharf Metr sells Titanic Brewery Plum Porter 500ML at an average price of £1.33 and sold only 10 units. Burton on Trent sells the same product at an average price of £1.52 and sold 1,020 units. Therefore, the commendation for performance includes that the company should sustain the current price ranges and find new alternatives for product performance.
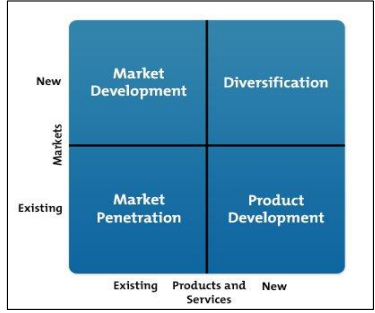
The fact that only a handful of stores across the country sell the company’s products means that market penetration should be the major concern for product performance. Ansoff’s product or market growth matrix presented by Kurniawan, Iswahyudin, and Suciati (2020, p. 73) is the recommended model. The main focus should be on market penetration, a concept that involves an emphasis on stability and low risk through a combination of selling current products in the existing markets. The availability of multiple stores across the country and only a few selling the company’s products means that the firm has not fully exploited the available markets. The most important aspect of this approach is the fact that selling to more markets will see the demand rise, which would ultimate prompt more product. The outcome will be a cycle of growth facilitated by the company’s selling efforts.
In the modern markets, it can be argued that digital media is the best tool for marketers to ensure rapid market growth and penetration. The social media marketing strategy has been defined by Li, Larimo, and Leonidou (2021, p. 53) as an interaction between marketers and customers through social media platforms, which allows the exchange of resources. In other words, online media platforms have become critical tools for marketers because of their massive outreach, interactive nature that allows real-time exchange of information, and their ability to shape consumer behavior. Therefore, social media marketing for Titanic Brewery will facilitate the adoption of the products in the remaining untapped markets, which should result in higher performance in terms of sales volume.
Reference List
Alkasim, S. et al. (2018) ‘The mediating effect of cost leadership on the relationship between market penetration, market development, and firm performance’, Journal of Business and Retail Management Research, 12(3), pp. 190-200.
Camilleri, M. (2018) ‘Market segmentation, targeting and positioning’, In M. Camilleri (ed), Travel Marketing, Tourism Economics and the Airline Product. Cham: Springer, pp. 69-83.
Kurniawan, D., Iswahyudin, M. and Suciati, T. (2020) ‘SWOT analysis and Ansoff matrix in creative food industry business development: A study on creative food business “Komala”’, Indonesia Journal of Social Sciences, 3(2), pp. 69-76.
Li, F., Larimo, J. and Leonidou, L. (2021) ‘Social media marketing strategy: definition, conceptualization, taxonomy, validation, and future agenda’, Journal of the Academy of Marketing Science, 49, pp. 51-70.
Sharma, A., Sinha, K. and Vandenberg, B. (2017) ‘Pricing as a means of controlling alcohol consumption’, British Medical Bulletin, 123, pp. 149-158.