Introduction
Financial statement analysis is a quantifying process of identifying the potential, past and present performances of a company (Gowthorpe 2008). Technically, it outlines the process of accounting and categorises the account titles and the amount of money as well. Thorough and technical financial statements with too many arithmetic calculations and numbers may have a baffling and nerve wrecking effect on investors. However, such financial statements can be turned into a goldmine of information by the conducting of a further comprehensive and precise analysis (Gowthorpe 2008).
In this paper, the author will carry out a detailed financial analysis of two public limited companies for a group of potential investors. The two public entities are Greene King plc and Enterprise Inn plc.
Greene King Plc
Greene King is a public limited company based in the UK. It is the leading pub and brewer in the region. The company has over 3000 managed, leased, franchised, and tenanted pubs, hotels, and brewing ales (Building a more valuable Enterprise 2015). The company operates through three main segments. The first is retail, which deals with management of leased restaurants and pubs. The second is brewing and brand, which is involved with brewing, marketing, and selling of beer. The last one is pub partnering, which involves operation of tenanted and leased pubs.
A SWOT Analysis of Greene King Plc
Strengths
The company’s major strength is in its large domestic market. It also has access to many distribution and sales networks throughout the UK, which allows for easy access to the market. The skilled workforce rivals that of its competitors (Building a more valuable Enterprise 2015).
Weaknesses
Its major weakness is in its cost structure. The company’s retail pricing is exaggerated.
Opportunities
The company has access to unexplored markets. Another opportunity involves new products (Chapman 2011). The company can diversify its beverage sector to meet the needs of children and young adults.
Threats
The firm faces growing competition that has limited its growth. Other threats include constant price changes and increasing government regulations (Building a more valuable Enterprise 2015).
Financial Statements and Analysis
Balance sheet
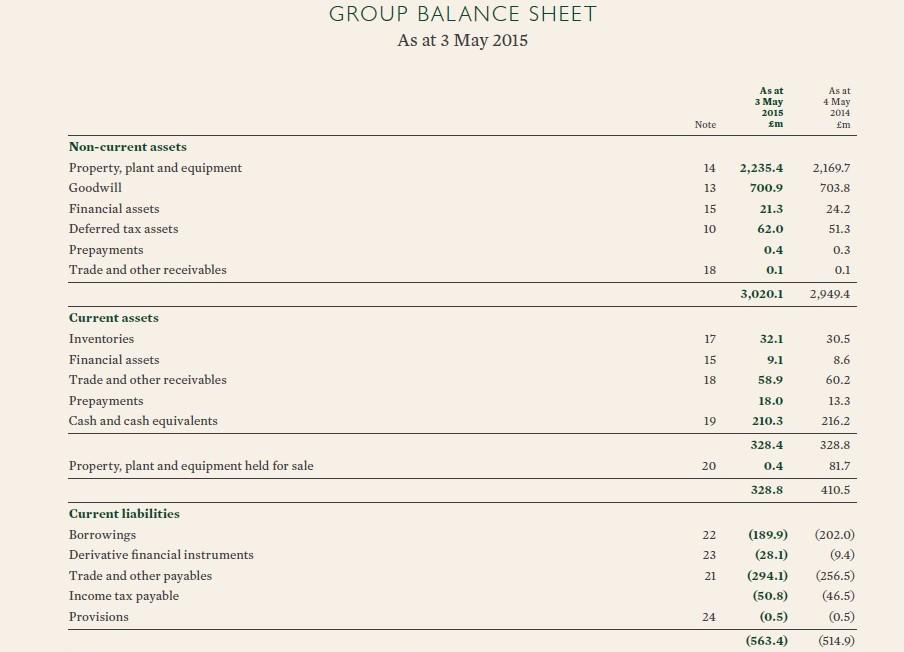
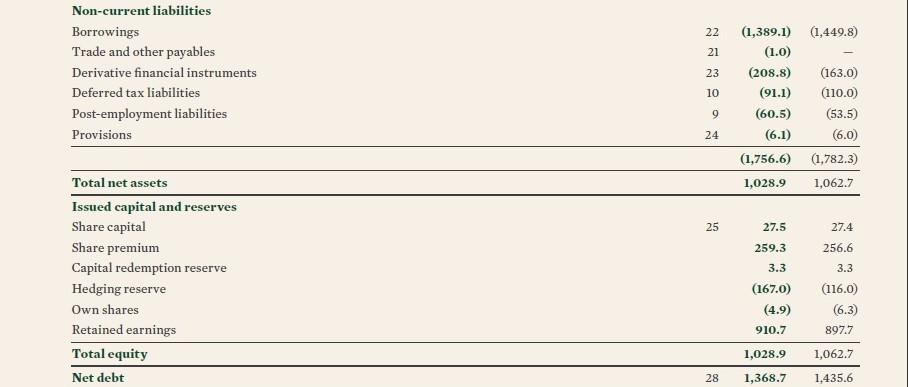
Greene King’s consolidated financial balance sheet covers 2014 and the first quarter of 2015. The balance sheet takes into account the new partnerships that took place in the financial period. There were no mergers or acquisitions during this period. The analysis in this paper is based on the estimates of the period ending 3 May 2015 (see appendix 1). From the balance sheet, it is clear that Greene King has a strong growth trend. It can be attributed to the introduction of new brands in 2014 (Building a more valuable Enterprise 2015). The launch of new pubs and restaurants throughout the UK also boosted the company’s revenues.
Horizontal and Vertical Analysis of Greene King Plc
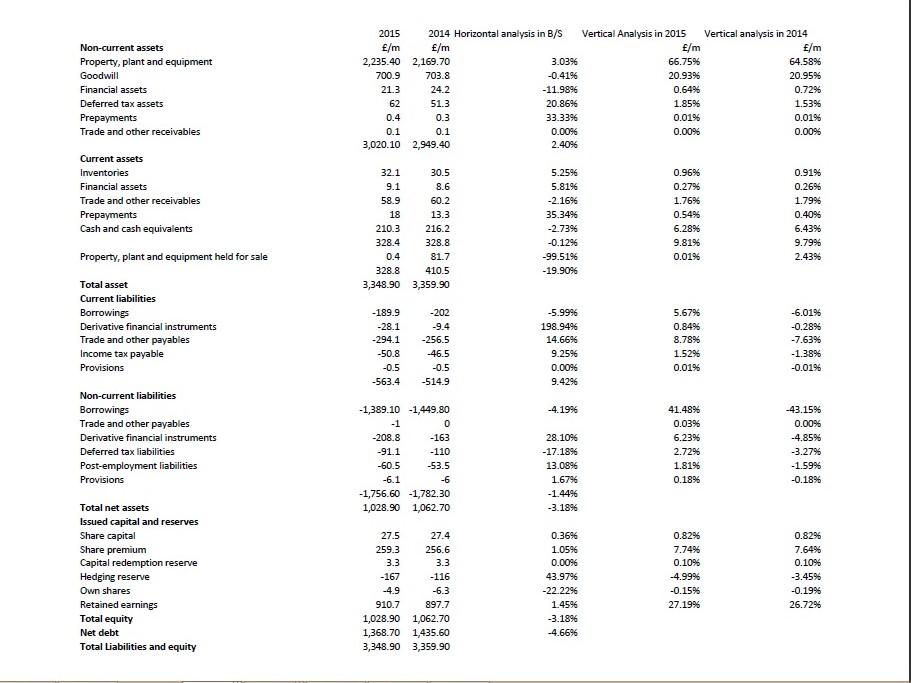
Horizontal analysis focuses on the trends and changes in financial statement over time (see appendix 2). Vertical analysis, on the other hand, shows items as a percentage of a selected item (see appendix 3).
Ratio Analysis for Greene King Plc
Profitability ratios
The ratio measures how much the company retains as earnings out of every dollar of sales (Rist & Pizzica 2014).
Revenue growth ratio
Greene King demonstrates a significant growth in profitability, especially in the last two years. The growth is above 15% on average. The performance is attributed to the increased revenues in the company’s franchised pubs and restaurants, which increased from $5843 in 2014 to $7,064 in 2015 (Building a more valuable Enterprise 2015). From the financial statements, it is evident that Greene King does not directly bear any expenses of the franchised businesses. On the contrary, it enjoys revenues and profits from it.
Net profit margin ratio
The net profit margin in 2015 was 6.79%, while the gross profit margin was 16.16% (Building a more valuable Enterprise 2015). The 9.37% difference was as a result of the heavy non-operating expenses, such as staff training. The company reported a poor net profit margin. It is likely to have been caused by the increase of assets from 45.75% to 47.22% in 2015. Net income did not increase in line with a rise in assets, leading to the poor net profit margin.
ROA ratio
Greene King earns only 2.67% profit from its assets. As such, the company does not use its assets effectively to earn profits (Weygandt, Kimmel & Kieso 2013).
ROE ratio
Greene King’s performance in terms of ROE is wanting. The average for the last 2 years is below 15% with a record low of 8.68% in 2015. ROE decreased from 9.04% in 2014 to 8.68% in 2015 (Building a more valuable Enterprise 2015). It was as a result of increased shareholder’s equity in 2015. The increased share capital may have been from the new partnerships and restaurant takeovers during the year (see appendix 3).
Liquidity ratios
Refer to appendix 4.
Current ratio
The current ratio average for Greene King is below the industry’s average of 1. The performance of the company’s current ratio declined from 0.64 in 2014 to 0.58 in 2015.
Quick Ratio
Greene King’s quick ratio dropped from 0.58% in 2014 to 0.53% in 2015. The ratio for the two year period was below the acceptable average for the industry. As such, the liquidity of the company is questionable.
Debt ratio
Greene King has an average debt ratio of 0.685. During the past 2 years, the ratio remained almost constant. It is an indicator of a balanced capital structure in the company.
Investment ratios
Earnings per share (EPS)
Greene King’s shares are highly valued at 40.9 per share in 2015 (Building a more valuable Enterprise 2015). The average EPS for the company for the past 2 years is 42.55. The figure indicates that in spite of the drop, Greene King was still able to back its shareholders. However, the figure was less than what was paid out in 2014 (see appendix 5).
Price Earning Per Share (P/E)
Price earnings per share for Greene King in 2014 were 19.6/share and 21/share in 2015, which represents a 1.4 rise per share (Building a more valuable Enterprise 2015). The average P/E for the company is 20.3. The upward trend in 2015 may be as a result of the new partnerships that occurred.
Dividend
The dividend per share ratio increased from 28.4 in 2014 to 29.75 in 2015. It represents a 1.35 increase from the previous year. The dividend cover ratio also increased in the given period (Rist & Pizzica 2014).
Sustainability Report
Greene King has the responsibility of conducting an ethical and sustainable business enterprise. Its sustainable business and corporate responsibility initiatives focus on food safety and supply, environment, and responsible retailing (Rist & Pizzica 2014). As per food and supply, Greene King requires all their suppliers to either have a British Retail Consortium (BRC) or Safe Local Supplier Approval (SALSA) accreditation (Rist & Pizzica 2014). A thorough team oversees the company’s energy and waste management division to reduce the impact the company’s operations have on the environment. To achieve sustainability through successful retailing, the company ensures that all alcohol sold is consumed responsibly. The firm’s standards in retailing are ranked as the highest in the industry (Rist & Pizzica 2014). In addition, the management seeks to attract, develop, and retain talent at fair and rewarding terms and conditions
Enterprise Inn Public Limited Company
Enterprise Inn Plc is a pub company based in the UK. It operates both leased and tenanted pubs (Time well spent 2015). The company operates through two major segments. The first is leases and tenancy. It entails income from drinks, rent, and games. The other is the managed subdivision. It entails revenue from food and accommodation. The company has over 5000 properties that are mainly run as leased and tenanted pubs. It has a property estate. The segment has two components. The first is pubs businesses. The other is non-pub undertakings. Its major brands are Diageo, Fosters, and Heineken.
A SWOT Analysis of Enterprise Inns
Strengths
The company’s major strength is in its large domestic market. It is also one of the most popular and recognisable brand in the UK’s pub industry (Time well spent 2015). The company also enjoys reduced labour costs, which lead to low expenditure. Other key strengths include a skilled workforce, monetary assistance, high profits, and increased revenues.
Weaknesses
The company faces competition from well established companies, such as Greene King PLC and Punch Taverns. Its major investment in research and development has also failed to produce tangible results that would place it ahead of its competitors. Other weaknesses include high future loan rates and varying tax structures (Time well spent 2015).
Opportunities
The company’s major opportunity is in the new markets. Its brands are also a hit in many international markets, which are yet to be explored. Other major opportunities include the introduction of new products, acquisitions, and venture capital.
Threats
The major threat to Enterprise Inn’s growth and expansion is in the perception by a section of the public. Many people refer to the company as ‘a group of cheats and cons’. A number of investors are of the view that getting into a lease with the firm will eventually lead to bankruptcy. Other threats to the company include stringent government regulations and rising costs of raw materials (Time well spent 2015).
Financial Statements and Analysis
The group’s financial statements and balance sheet are largely used in the analysis carried out in this paper (see appendices 6 and 7). The balance sheet takes into account all the mergers and acquisitions of the company during 2014/2015.
Horizontal and vertical analysis
(See appendix 8)
Ratio analysis of Enterprise Inns plc
Profitability ratios
Enterprise Inn has seen significant reduction in growth during the two year period. The company’s net profitability fell from 22% in 2014 to 19% in 2015. Additionally, the big difference between its gross profit margin and its net profit margin indicates that there were heavy operating expenses during this period. The company’s high gross profit ratio may be as a result of the competitive advantage the company enjoys over its rivals in the areas of brand, quality, and design. The good economies of scale it enjoys allows it greater bargaining power and better credit terms against its vendors (Weygandt, Kimmel & Kieso 2013). From the return on assets ratio (ROA), Enterprise Inn earns a 17% profit from its assets. As such, it is clear that the company makes effective use of its assets to earn profits. The firm also has an impressive return on equity ratio. The average for the last 2 years is above 30%, which is better than the industry’s average. The major drivers behind this performance are increase in revenue and a balanced capital structure (see appendix 9).
Liquidity ratio
In the past two years, the current ratio average for Enterprise Inn was above 1. In the pub and beverages industry, such a ratio indicates a healthy performance (Rist & Pizzica 2014). It also reflects an effective management of working capital by the company. During the two year period, the firm recorded a quick ratio of 1.46 in 2014 and 1.22 in 2015. The average for the two years is above 1, which is an indicator of good liquidity (see appendix 10).
Market value ratio
The earnings per share (EPS) in 2015 are fairly high at $5.39/share. Compared to the previous year, the figure represents an improving trend for the company. The price per earning (P/E) ratio also rose from 17.25/share in 2014 to 17.60/share in 2015 (Time well spent 2015). As such, there was a rise of 0.35/share during the same period. The book value per share rose by 0.21 in 2015. The figure shows that the market shares for Enterprise Inn are growing as a result of the management’s maintenance of good cash flows, market strategies, and stakeholders’ equity (see appendix 11).
Sustainability Report
Enterprise Inn takes its responsibility to run a sustainable business seriously. The company’s sustainability is based on four major pillars. They include community, environment, people, and responsible retailing. As per the community pillar, Enterprise Inn offers amenities and employment to a sizable number of local communities. As such, it helps people meet their needs (Time well spent 2015). By conducting group wide employee engagement survey, the company is able to identify key drivers to engage with its people. The move allows for sustainability. Proof of age and proper drink labelling is one of the major ways through which the company achieves responsible retailing (Time well spent 2015).The firm refers to these pillars to ensure that a real and sustainable difference is made to both the community and the business itself (Time well spent 2015).
Conclusion
Based on the above analysis, it is clear that both Greene King and Enterprise Inn are fierce competitors. However, it is evident that Greene King is performing much better than Enterprise Inn. The former shows better sales growth, impressive profitability trend, and a strong balance sheet. Its market value of the shares and other equity ratios are also better than those of Enterprise Inn. Additionally, Enterprise Inns profitability is decreasing and underperforming compared to its competitors in the industry. Sales and net income costs for Enterprise Inn are also decreasing, while the costs of operations and short term debt are increasing. Such factors may contribute to a poor performance for the company in 2016. Furthermore, the inconsistencies in Enterprise Inn’s ratios and overall business performance over the years make it an unsuitable investment company. As such, I would strongly advise the investor to invest in Greene King Plc.
References
Building a more valuable Enterprise: Enterprise Inns plc annual report and accounts for the year ended 30 September 2015 2015, Web.
Chapman, J 2011, Simple tools and techniques for enterprise risk management, 2nd edn, Wiley, New York.
Gowthorpe, C 2008, Financial analysis, Cima, Oxford.
Rist, M & Pizzica, A 2014, Financial ratios for executives: how to assess company strength, fix problems, and make better decisions, Apress, New York.
Time well spent: annual report 2015 2015, Web.
Weygandt, J, Kimmel, P & Kieso, D 2013, Accounting principles, 11th edn, John Wiley & Sons, Hoboken.
Appendix
Appendix 1: Balance for Greene King plc as at 3 May 2015


Appendix 2: Horizontal and vertical analysis for Greene King


