Executive Summary
Wrestling is a most popular sport all over the world. The world wrestling federation is widely known as WWF (World Wrestling Federation which has later shaped as World Wrestling Entertainment Inc (WWE)) is the key market leader in this industry. But because of some strategic mistakes WWF faces various dilemmas. The case study demonstrates the causes and the possible way to overcome this situation. With a view to capturing the market share, WWF has some opportunities and strength which is more attractive than its threats and weaknesses. Thus WWF considering some strategies to best fit with its current alarming situation. Various types of analysis like SWOT, BCG, EFEM, IFEM, SPACE, QSPM etc are being used in this study to way out the highest possible strategy which best fir with its well being.
Introduction
Wrestling with popularity and fascination to young generation, became a famous entertainment source for worldwide in 1980’s to 1990s. One of the famous wrestling industries is World Wrestling Federation (WWF). But the popularity is going down because of overdispersion in wrestling industry. The television industry of U.S. was concerning about the success of WWF and WCF (World Championship Wrestling), which were a sign of threat to them. These industries are still produced over $1 billion in revenues with 35 million viewers in the US market. Besides them, extra 7 million subscribers are watching wrestling from their homes by paying $30 dollar every year. Not only in the US market, but also in worldwide wrestling are getting priorities as entertainment show to people. For the beneficiaries of other people outside US, WWF is viewed in 120 countries and also translated into 11 languages. The success is not built in a day, the success story of WWF is main concern for the study.
Organizational Background
World Wrestling Federation, now popular by the name of World Wrestling Entertainment Inc., is an integrated entertainment company featured by a portfolio of specialized business. It is a public traded company with a privately controlled media, with television, internet, and live events and also sports entertainment with the dealers of professional wrestling. This business is creating and delivering original content of WWF brand, with a market entertainment leader for more than 25 years and has a great recognition of global entertainment in present days. The major sources of revenue of this company are:
- Integrated Media.
- Professional Wrestlers dealers.
- Sports entertainment.
- Film.
- Music.
- Product licensing.
- Direct product sales.
The headquarters of WWE’s are in Stamford with other offices in Los Angeles, New York, London and Toronto. Now, WWE is promoted under three important brands, which are Raw, SmackDown, and ECW.
In the historical overview, the founder of Titan Sports, Inc. Vincent Kennedy McMahon was purchased Capital Wrestling Corporation. The viewpoint of wrestling was a popular sports rather than an entertainment show. The show was being threats to others, when McMahon was telecasting WWF television in United States. He also began to sell video tapes by video distribution company. It is now popular not only popular wrestling business nationwide, but also generates revenues from advertising, television deals and video tape sales in the world market.
Strategic Analysis
The main strategy of WWF is straightforward in developing compelling content of Wrestlers, which is driven in television ratings, pay- per- view buys, live event attendance, and other business initiatives. It is also capitalising operating leverages in distribution of intellectual property through media and distribution platforms.
Identifying Vision, Mission, Objectives and Strategies
Vision
WWF is stated its vision, as where it wants to see them in the future. They want to be branded merchandise sales and business initiatives in the market of entertainment. They are also believing in giving support in programming and products to continue n the competitive market.
Mission
According to the mission statement of WWE, which is capturing the purpose and intention of their business in the market. They are seeking the market of global entertainment, which is adjusted not only with the viewers, but also unique fans with passionate emotion in all media platforms to drive their brand successfully.
Objectives
The main objectives of WWF are discussed below:
- Determining and approving Corporate goals based on evaluation.
- Preferring to invests in long term incentives plan.
- Obtaining advice from legal and assistance advisors for the betterment of company.
- Making regular reports to Board of Directors with terms of business.
- Reviewing performance to judge with it past and forecasted future.
- Gaining maximum revenues from the sports and entertainment sectors of business.
Strategies
The main strategy of WWE is to capitalize operation leverage and expanding it in the promotional activities of WWE brand in the domestic and international markets. The proper use of Internet in advertising and entertainment platforms is also a successful strategic decision taken by the company. They are continuously developing new programming and sports entertainment to hold the core competencies of the business. They also use strategies of pursuing initiatives, expand in global market, use valuable library of wrestling contents and explore in film entertainment.
Developing Vision and Mission Statement
According to vision and mission statement of WWE, they should developing or altering their vision and mission statement in terms of capturing the global market, and also US market of entertainment.
In the development of vision of WWE, it has to improve brand in merchandising and sales of professional wrestling business, films, sports entertainment, video tapes business to capture the US and international market.
For further development of WWE company, it also has to improve or develop its mission statement of the company. They have to focus on the viewers and also the fans, who are emotionally attached with the entertainment programming of WWE. With the successful brand, they can attain the whole entertainment market and can make hard for rivals to enter and compete in sports entertainment market.
Identifying External Opportunities and Threats
World Wrestling Federation has some opportunities as it is now the market leader. These opportunities are:
In the regional market, there are strong demands for the wrestling matches. Still people all over America consider this pseudo sport as an unique source of entertainment. Thus, WWF has the opportunity to use this demand and to create newer dimensions of the sports.
In most the countries wrestling is becoming more popular sports and most of the people of the world know WWF as synonymous as wrestling. This popularity will help WWF to capture new markets and extend its operation. There are some threats also. These are:
The effect of wrestling on the society may be a threat for WWF. It has been found through research that the children who are watching the WWF wrestling show aggressive behaviors and as childrens are very likely to copy anything, many organizations strongly oppose the wrestling shows which can be a threat to WWF.
The extensive competition from World Championship Wrestling (WCW) headed by Ted Turner is a threat for WWF also. In many ways WCW keep pressure on the operations of WWF and tried to get some key players of WWF like “Bret Hart”. Ted turners television and many other networks capture some subscribers of WWF and thus WCW keeps trying to get superiority over WWF.
Constructing Competitive Profile Matrix (CPM)
In strategic management Competitive profile matrix (CPM) is constructed for the identification of some key factors which will help the industry to act as the success attaining elements for the organization and termed as “Success factors”. This is an essential tool for assessing the companies of the industry from the view of success attaining power and to evaluate these factors according to their potentials to bring success. For example high market share of a industry and cost leadership strategy both can be the success factor for an industry but these two do have not the same potential to bring actual success. The advantage CPM has is that it has no boundary of constraints, all the potential success factors are assembled here whether it is external or internal. (The Competitive Profile Matrix (CPM))
In this matrix the competitors at the industry are given ratings and the success factors are given weights. After that the success factor weights are multiplied by the ratings and the result is the weighted score. The company which has better weighted score is treated as the better competitive power gainer.
The Competitive Profile matrix for Wrestling industry has been drawn below:
(Here the ratings are given in a way the 1= major weakness, 2= minor weakness, 3= minor strength, 4= major strength)
From the above matrix the clear competitive superiority of WWF over WCW is shown.
Constructing External Factor Evaluation (EFE) Matrix
External factor evaluation matrix is the tool used to indicate the key external opportunities and threats. External factors are those which have effect the all companies industrywide. These factors are common to all but all companies do not have the opportunities and threats equally. For example the demand for mobile phone sets is common to all mobile set producers and the effect of inflation is also affect all companies. The External factor evaluation matrix consists of some external opportunities and threats which will affect the firm and the industry. Then the weight to each factor will have to assign.
The range of weight is 0.00 to 1.00. The weight means the importance of the factor for the success. The total weights must be equal to 1. After that each external factors will have to give ratings. Ratings mean the level of effectiveness to respond against a factor. There are 4 ratings, 1 stands for poor response, 2 stands for average, 3 stands for above average and 4 stands for superiority. Finally each weights are multiplied by the ratings and summation of these weighted scores reflects the EFE score for the organization.
Below the EFE matrix has been drawn for WWF:
Identifying Internal Strengths and Weaknesses
There are some internal strengths of WWF. Firstly the market share. WWF has the highest market share within the industry and always keep this market share high. This attainment of good market share is a strength because whenever the industry rises the profit margin of WWF also increases.
Secondly, The loyal audiences of WWF are also a strength for WWF. WWF has some critical audience who enjoys only the WWF show.
Thirdly, WWF is accepted worldwide. All most all countries have more or less experience with WWF wrestling and in some countries the heroes of WWF are also much popular than any local celebrities.
Fourthly, there are many famous heroes like “Bret Hart” and “Steve Austine”. These heroes work as promotional tools for WWF and many audiences like these heroes so much that they witnessed an entire show only to see the hero.
Finally, the show quality of WWF is worked as a way to attract the typical audiences. Many audiences prefer WWF for the friendly and transparent quality of show.
Besides, WWF has some weakness also. Recently it has witnessed an unstable financial condition which affects it’s show quality and prsue some heroes to leave WWF.
Another weakness is lack of own network to broadcast only its shows. Many wrestling companies have their own television network where they show only their programs. But WWF has to hire other networks to express their program.
Constructing Internal Factor Evaluation (IFE)
This Internal factor evaluation matrix (IFE) is the presentation of the firm’s internal strengths and weaknesses which identifies a company’s major strength and weaknesses which designs the strategies for the assessment within one single scale and to get the whole scenario. The matrix is designed with the major internal strengths and weaknesses as the factors. Then they are given weights. The weights range from 0.00 to 1.00. Here the weight reflects how important the factor is to sustain in the industry. Then the rating is being given ranged from 1 to 4 where 4 is major strength, 3 is minor strength, 2 minor weakness and 1 stand for major strength. After that the ratings are multiplied by the weights and thus the weighted score for all factors is summarized which indicates the total weight score for the organization.
Developing Methods
In the development of various methods for WEE, there are number of various methods that can be used, like SWOT analysis, SPACE Matrix, BCG Matrix, IE Matrix, Grand Strategy and QSPM Matrix. These methods would be useful in terms of developing market opportunities, building internal power, improving weak points and stability in competitive market in entertainment and sports business of wrestling.
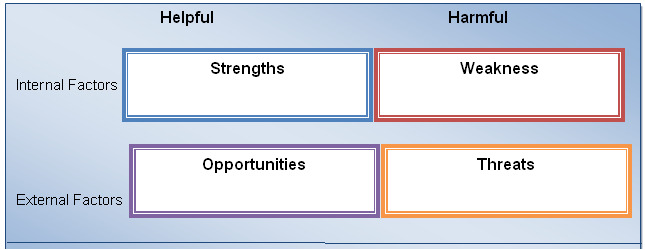
SWOT Analysis
SWOT analysis is most common methods used in generating strengths of business, altering weaknesses, identifying opportunities and protecting from competing threats in market. (PHILIP KOTLER)The following diagram would present best way to show SWOT Analysis:
Strengths
Major strengths of WWE Inc. are defined below:
- Highest market share in the business of sports and entertainment;
- Highest profit margin earned in recent years;
- Leading position in the entertainment market;
- Spreading its business of entertainment worldwide;
- Promoted brand by professional wrestlers;
- Attracting high level of viewers.
Weakness
With some strengths, WWE has some weaknesses also, which are:
- Facing unstable financial conditions;
- Lack of having own networks to broadcasts their sports entertainment show;
- Depending on other entertainment networks.
Opportunities
In the external market conditions, the opportunities of WWE Inc. are given:
- Being market leaders in the sports entertainment show;
- Strong demand of wrestling entertainment show in regional and international market;
- Unique source of entertainment considered by viewers of US market;
- Capturing new markets regionally and globally.
Threats
Considering the external market, there are some threats, which has to be faced by WWE Inc., which are:
- Bad effect of restling in society is hampering business of WWE;
- Opposed by many organizations of WWE wrestling shows;
- Losing key players by competitors, like WCW;
- Lack of capturing network from competitors.
Strategic Position and Action Evaluation (SPACE) Matrix
The strategic position and Action Evaluation matrix is a tool to indicate the nature of a firm. There are four quadrants in the framework representing the aggressiveness, conservativeness, defensiveness and competitiveness. This analysis is done for the professional market analysis of a firm. There are two axes. The y axis has Competitive advantages in its negative quadrant and industry strength in positive quadrant. In the X axis the positive side reflects financial strength and the negative quadrant represents environmental stability. (The Strategic Position and Action Evaluation (SPACE) Matrix)
There are six steps to build a SPACE matrix these are:
- Select a set of variables to define financial strength (FS), competitive advantage (CA), environmental stability (ES), and industry strength (IS).
- Assign a numerical value ranging from +1 (worst) to +6 (best) to each of the variables that make up the FS and IS dimensions. Assign a numerical value ranging from -1 (best) to -6 (worst) to each of the variables that make up the ES and CA dimensions.
- Compute an average score for FS, CA, IS, and ES by summing the values given to the variables of each dimension and dividing by the number of variables included in the respective dimension.
- Plot the average scores for FS, IS, ES, and CA on the appropriate axis in the SPACE Matrix.
- Add the two scores on the x-axis and plot the resultant point on X. Add the two scores on the y-axis and plot the resultant point on Y. Plot the intersection of the new XY point.
- Draw a directional vector from the origin of the SPACE Matrix through the new intersection point. This vector reveals the type of strategies recommended for the organization: aggressive, competitive, defensive, or conservative.
Here the SPACE matrix for WWF has been drawn:
Variables of financial strength:
Variables of competitive advantage:
Variables of Industry strength:
Variables of Environmental stability:
Score of x axis: (+5-3) = +2
Score of Y axis: (+4-5) = -1
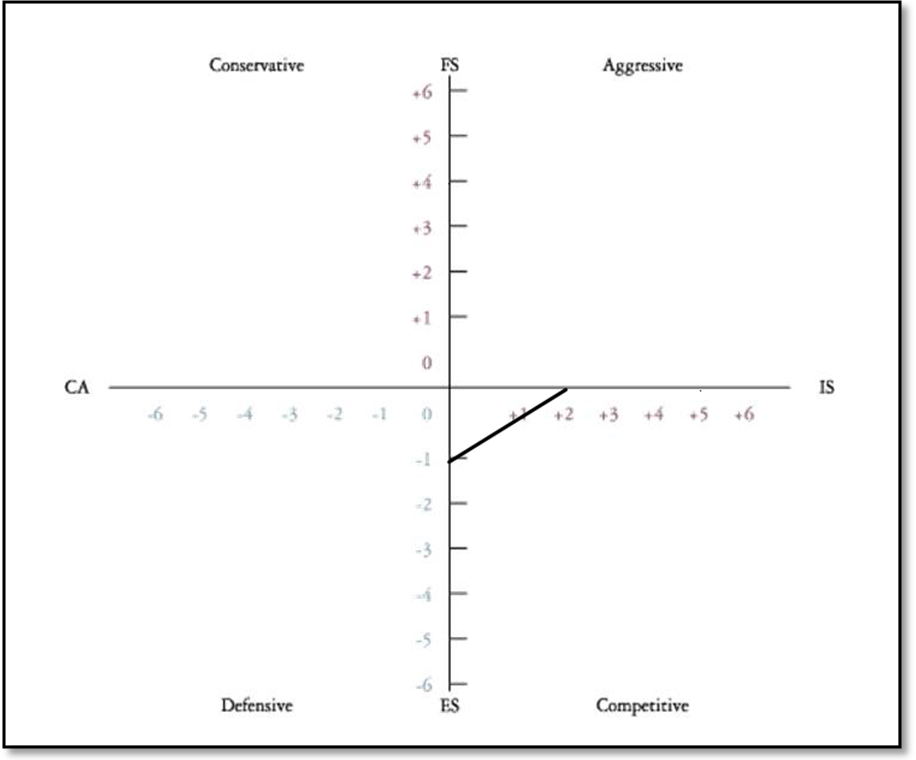
Here the straight line is done by adding +2 and -1. This straight line represents the competitive nature of the WWF.
Boston Consulting Group (BCG) Matrix
Boston Consulting Group (BCG) Matrix is a strategic portfolio planning, where the business units can be classified into four groups based on market growth and market share comparing with competitors. This is helpful to determine the business positions for determining profitability. The following figure will show four specific groups of BCG Matrix. (Kotler, P.)
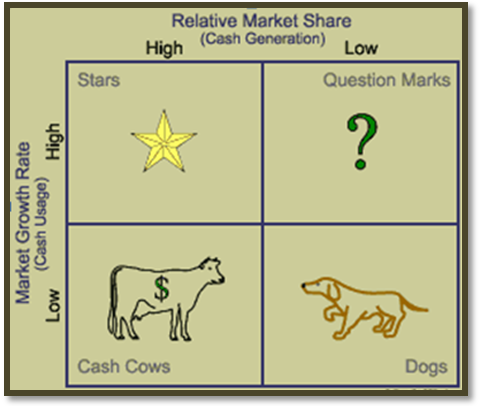
The four groups of BCG Matrix are:
- Cash Cow: Organisation, who is in the lowest market growth rate, but relatively high in market share. It is generating maximum profit from its business, but lack behind in capturing market and growing in customers mind.
- Dogs: With low market share and market growth, these organizations have in lowest level in the market.
- Question Marks: The organization, who are in low market share, but high in market growth rate. These organizations have opportunities in market, but having small profit from its business.
- Stars: This organization is in highest position in market growth rate and market share. This is optimum level that an organization can reach.
After analyzing different methods, like SWOT analysis, it can be identified very easily that, on which groups of business stand for WEE Inc. by BCG Matrix. With a high market share and high profit margin, WWE Inc. is being to be in the “stars”. But the competition of market is also high.
Internal External (IE) Matrix
The internal external matrix is a tool used in strategic management to analyze the position in the industry of a firm and its internal working condition. It is the outcome of the External Factor evaluation matrix and the internal Factor evaluation matrix. These two are combined in a single matrix. The outcome of the IE matrix is the combined external and internal factors affect on the firm. IE matrix is a nine cell matrix. In the Y axis the score of EFE matrix is being plotted and on X axis the IFE score is being plotted. The total weighted score of the EFE and IFE matrix is represented by one horizontal and one vertical straight line. These two lines are meet in a point that indicates the necessary strategy. (Internal-External (IE) Matrix)
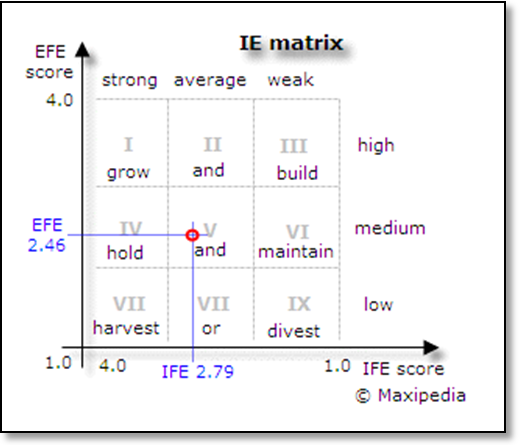
The above matrix is an example of IE matrix. Here the EFE is 2.46 and the IFE score is 2.79. The two lines representing the EFE and IFE meet at a point that exists in medium and average representing cell. That is the strategy is medium and average.
Now the IE matrix for WWF is drawn below:
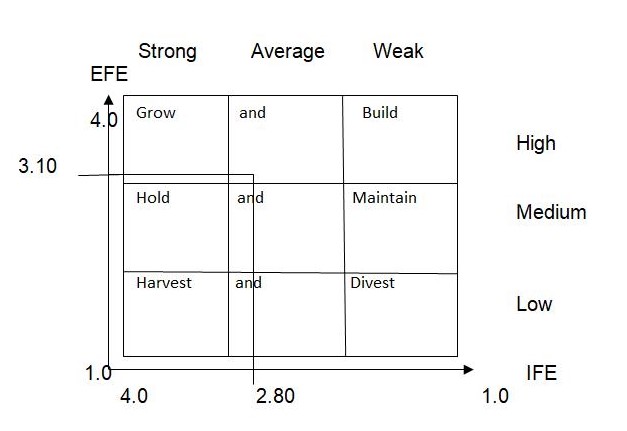
Here the EFE and the IFE are 3.10 and 2.80 respectively. The horizontal and vertical straight lines representing each of the values meet at a point which indicates that WWF has high internal and external position within the industry which represents average success for WWF.
Grand Strategy Matrix
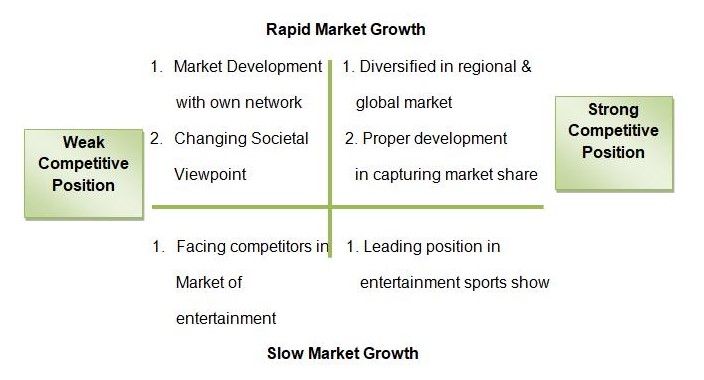
Grand strategy matrix will represent the strong and weak competitive position of according to relative market growth by organizational various success or failure factors. (Grand Strategy Matrix)
The following figure will show the matrix of Grand Strategy of WWE:
Quantitative Strategic Planning Matrix (QSPM) (Meredith E. David)
The quantitative Strategic Planning matrix (QSPM) is a management strategy tool used to identify the best strategy for a firm using the various matrix and analysis.It uses the SWOT analysis, BCG matrix, EFE matrix, IFE matrix and many other strategic management tools. All these tools are combined here to attain the best strategy. There are three steps in this strategy. Firstly, the overall strategic management analysis has been done to find out the key strategic factors> in this step the EFE and IFE matrix has to be prepared.
The second step consists of the formulation of a strategy using BCG Atrix, SPACE matrix and SWOT analysis. These tools establish the way to select another alternative strategy also.
In the second step the alternative strategy is being selected and the factors for the QSPM matrix are listed, given weight and the attractiveness score (AS) is been given to the factors. After it the total attractiveness score (TAS) has been calculated for each strategy. After summation of these Total attractiveness scores the better strategy can be selected. (Quantitative Strategic Planning Matrix (QSPM))
Here the QSPM is being shown for WWF below. There are two alternative strategies. Alternative 1 says that WWF should expand the international markets and Alternative 2 says that WWF should keep up their top wrestlers.
(Attractiveness Score: 1 = not acceptable; 2 = possibly acceptable; 3 = probably acceptable; 4 = most acceptable; 0 = not relevant)
From the above matrix the highest score is for alternative 1 which is expansion in the international markets.
Recommendations
In this part, WWE Inc. have to present specific strategies, long term objectives, comparing the actual and specific strategies, implemented strategies, forecasted ratios, and projected financial statements.Then annual objectives and strategies are reviewed and evaluated by strategic implementation.
Recommendations for Specific Strategies and Long term Objectives
For WWE Inc., some specific strategies can be taken by the company, which should be useful in terms of altering threats and weakness of company.Some strategies are developed:
- Developing own network media to broadcasts their own show to the viewers properly
- Changing societal viewpoint, with the positive impact of wrestling and other entertainment shows
- Holding top wrestlers from the competitive organization of entertainment show, by various motivation
- Attracting international market more deeply with customers attention in the brand of WWE.
Comparing Recommended Strategies with Actual Strategies
A comparison table is given below to show the differences between existing and forecasted strategies:
Implementation of Specific Strategies
To implement the recommended strategies, WWE has to take some action plans, which are:
- WWE can easily broadcast their own television network with the existing brand value of the company
- The viewpoint of societies can changed by proper promotional tools, like advertising, media, or to banned the telecast for children to motivate or change the attitudes of societies towards them
- By proper motivation and contribution demanded by top wrestlers have to be fulfilled to keep them with WWE Inc.
- The promotional strategies in international market should be taken more effectively to attract and expand viewers’ globally.
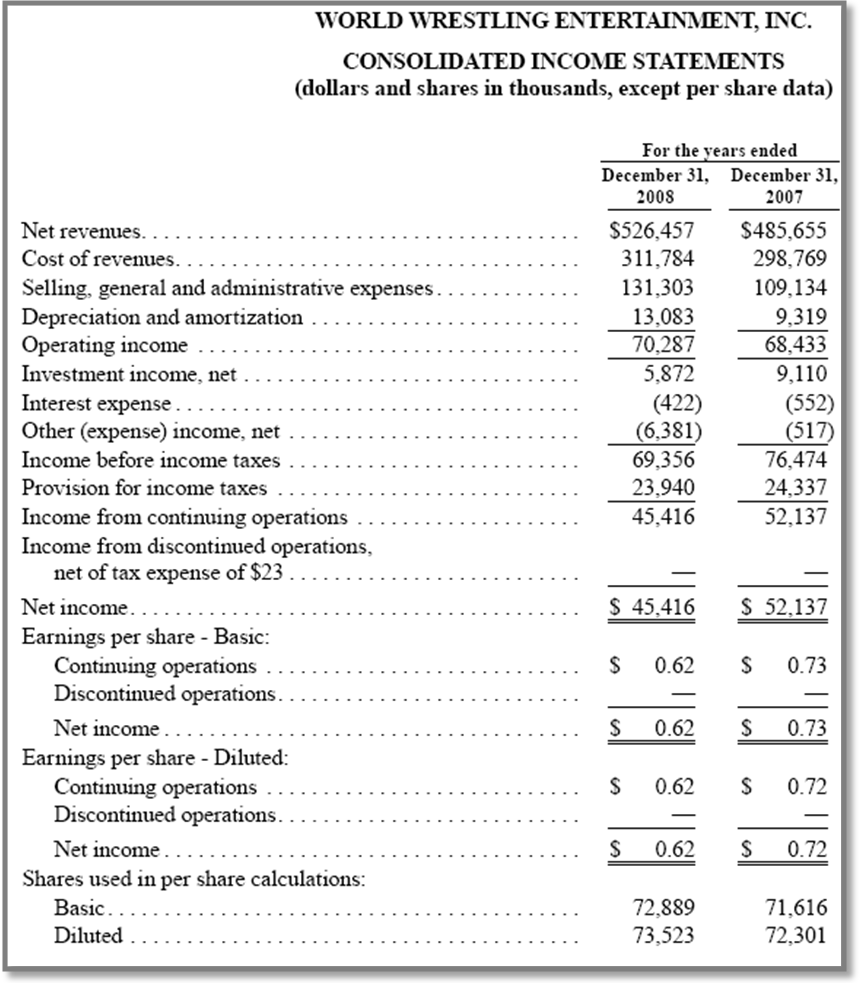
Preparing Forecasted Ratios (Scott Besley)
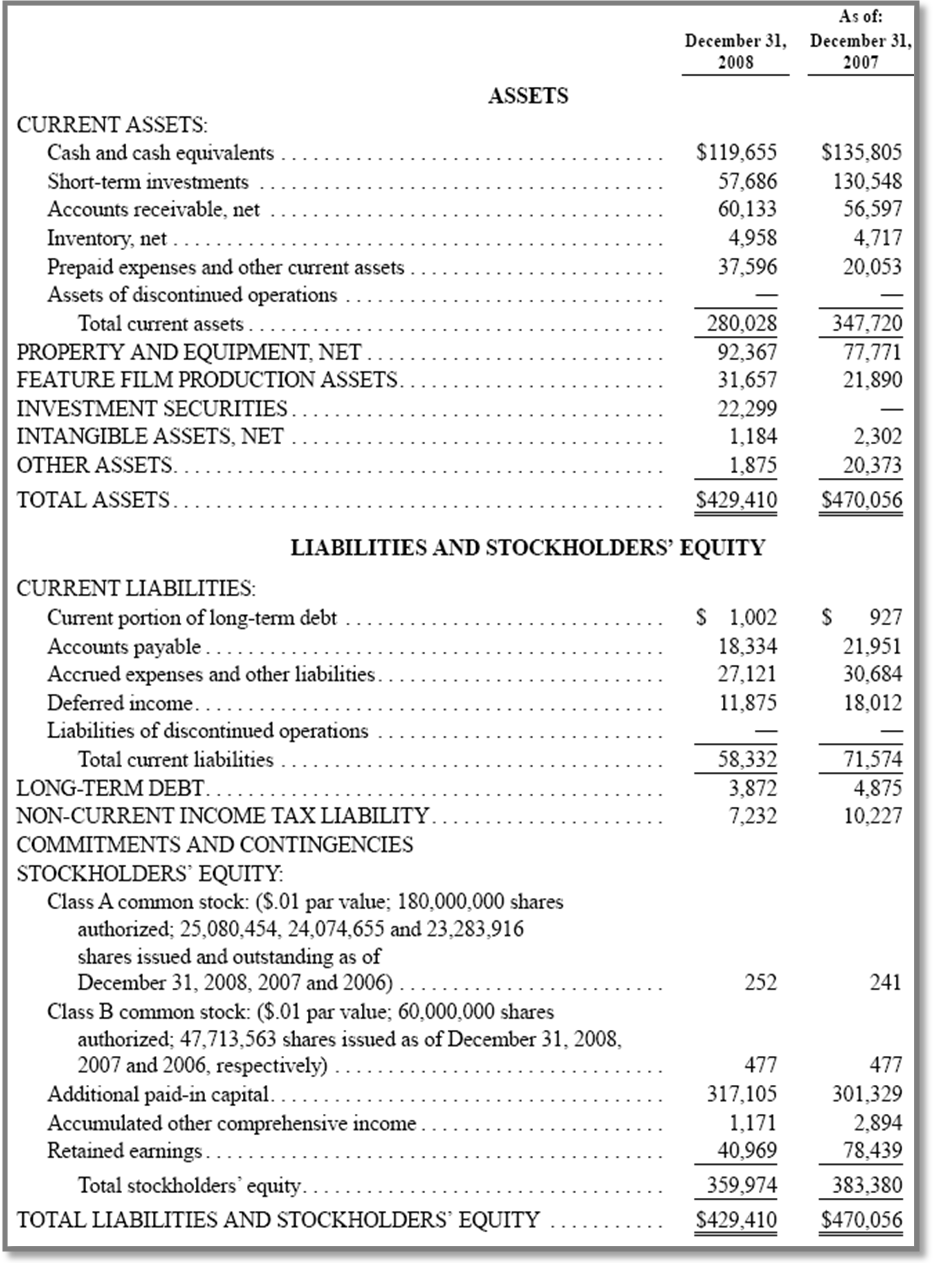
There are some common and important ratios are used in every organization to measure the performances according to future performance or results. For WWE Inc., some ratios are used and discussed in below, which are used dollars in thousands: (World Wrestling Entertainment Annual Report)
Liquidity Analysis Ratio
Liquidity ratio shows the relationship of WWE’s cash and other current assets to its current liabilities.
Current Ratio
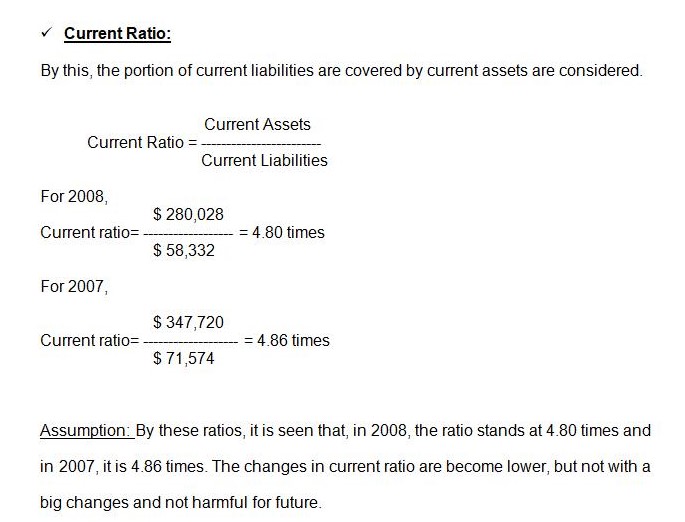
Assumption: By these ratios, it is seen that, in 2008, the ratio stands at 4.80 times and in 2007, it is 4.86 times. The changes in current ratio are become lower, but not with a big changes and not harmful for future.
Quick Ratio:
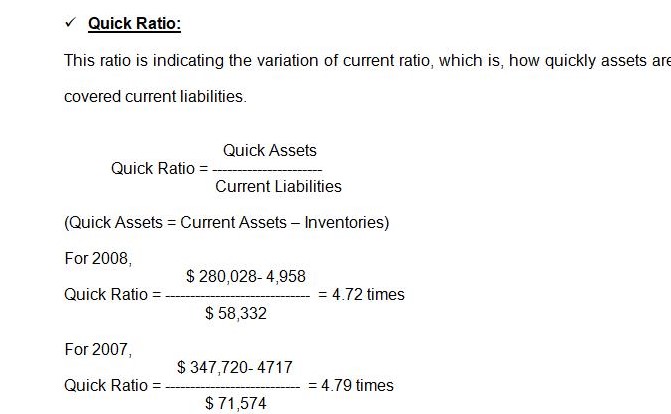
Assumption: In these two years’ quick ratio, the ratios are relatively high, which means that, WWE has more liquid assets on hand. So, the quick ratio is not appropriate.
Net Working Capital Ratio:
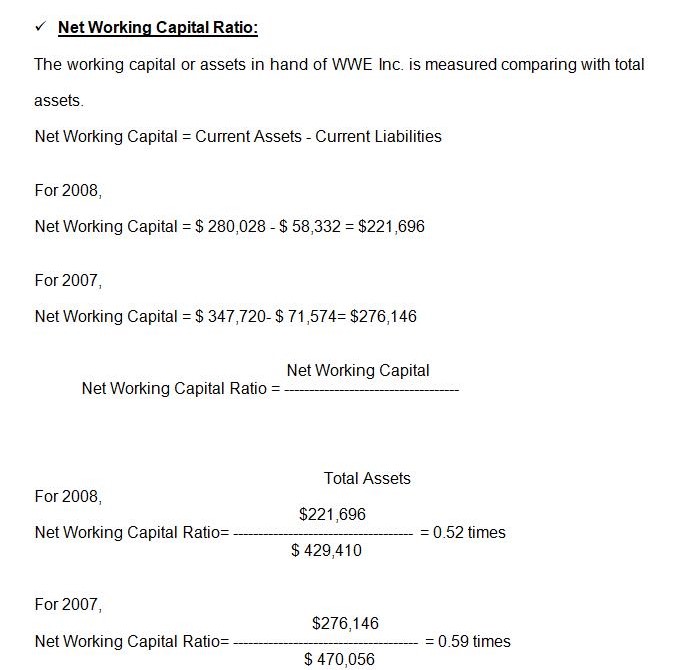
Assumption: Here, Networking capital ratios of both years are above 0.50, which is proven that, WWE Inc. has proper control in Net Working Capital Ratio.
Profitability Analysis Ratios
These ratios are showing the effect of liquidity, asset management, and debt management on operating results of WWE Inc.
- Return on Assets (ROA):
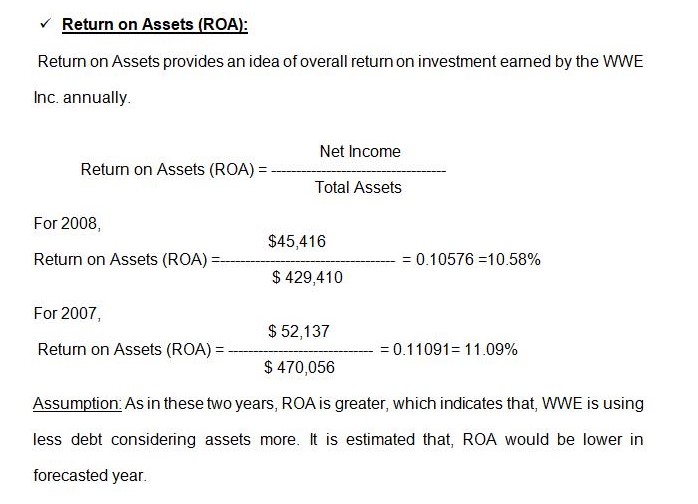
Assumption: As in these two years, ROA is greater, which indicates that, WWE is using less debt considering assets more. It is estimated that, ROA would be lower in forecasted year.
- Return on Equity (ROE):
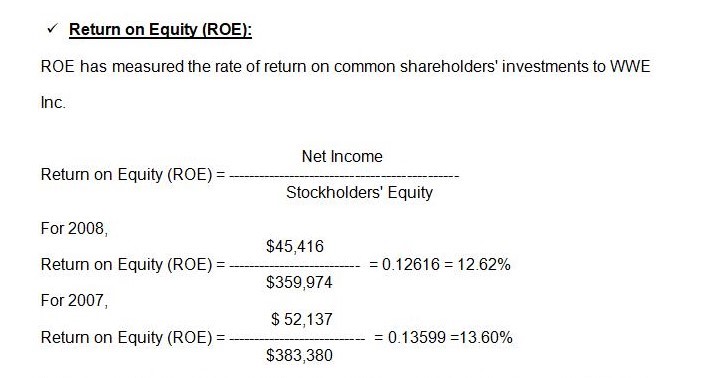
Assumption: The Company is using less debt in these two years, and also using net income to the common shareholders’ equity, presented by ROE, which is good for WWE Inc.
- Profit Margin:
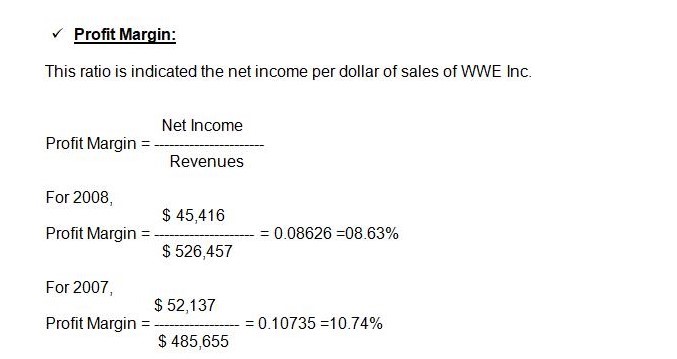
Assumption: The ratios of Profit Margin in these two years are almost same, which indicates the revenues are generating relatively low in later period.
Activity Analysis Ratios
These ratios are measuring the effectiveness of managing assets of the Company.
- Assets Turnover Ratio:
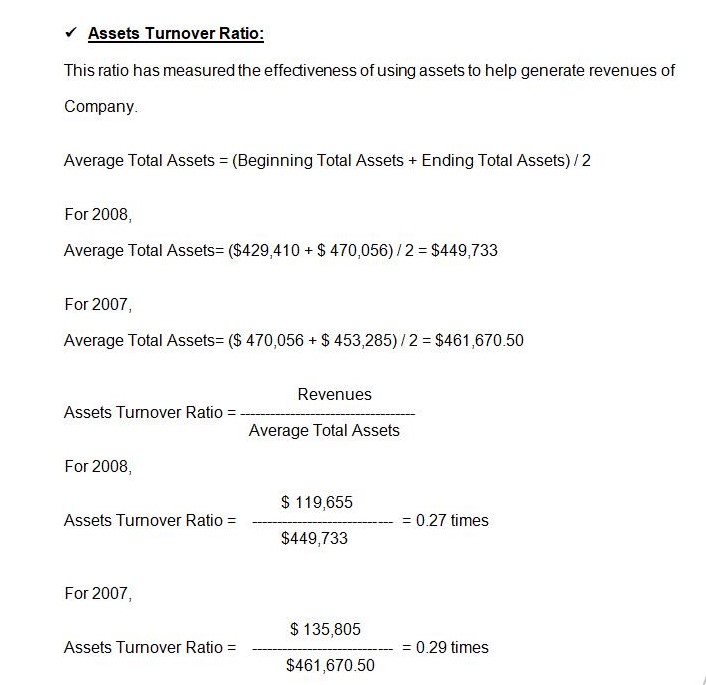
Assumption: The effectiveness of asset turnover is decreasing every period, shown by measuring the ratios of 2008 and 2007 and the ratios are too small to measure the effectiveness of assets. So, WWE Inc. should improve its Asset Turnover Ratio for forecasted year.
- Accounts Receivable Turnover Ratio:
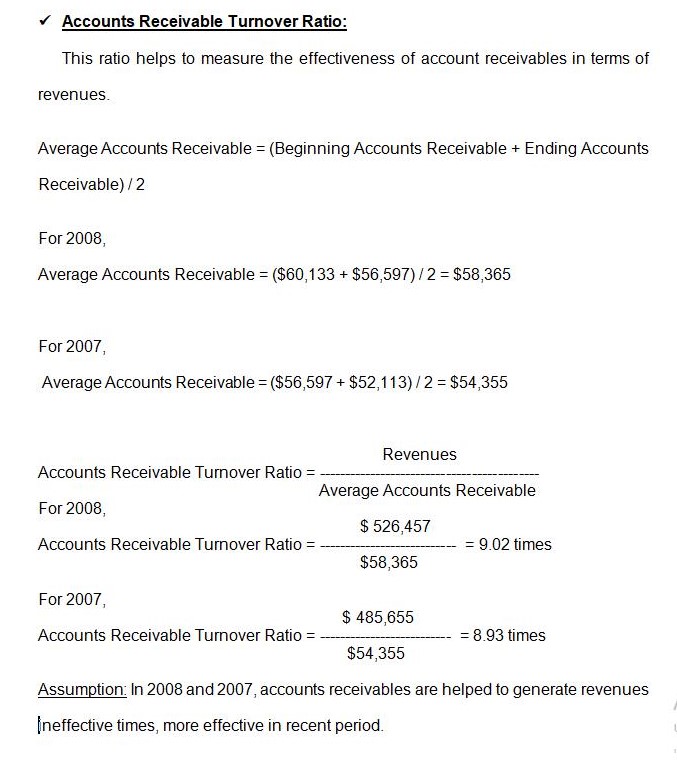
Assumption: In 2008 and 2007, accounts receivables are helped to generate revenues ineffective times, more effective in recent period.
- Inventory Turnover Ratio:
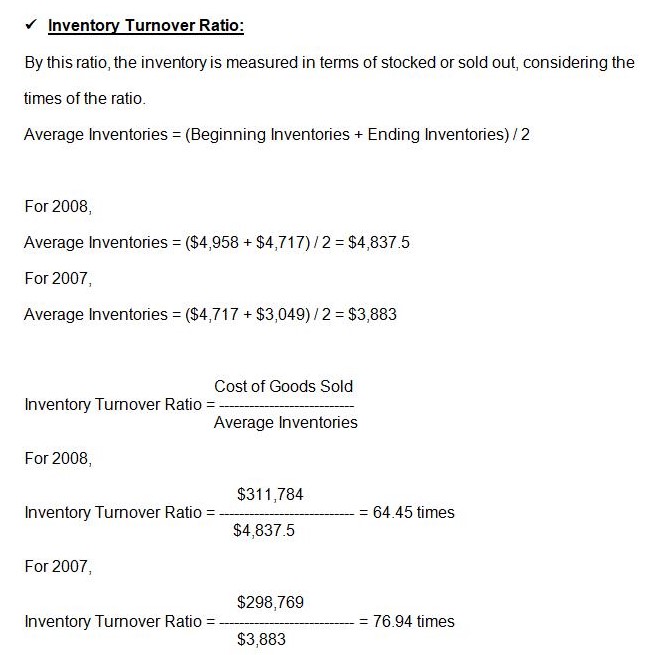
Assumption: By these ratios, it is estimated that, the goods are sold out or used over 64 times and more times in these recent two years in terms of inventories in hand by WWE Inc., which is forecasted that, Inventory Turnover Ratio is more than average.
Capital Structure Analysis Ratios
These ratios are indicating the capital management of shareholders in terms of liabilities and interests of the Company.
- Debt to Equity Ratio:
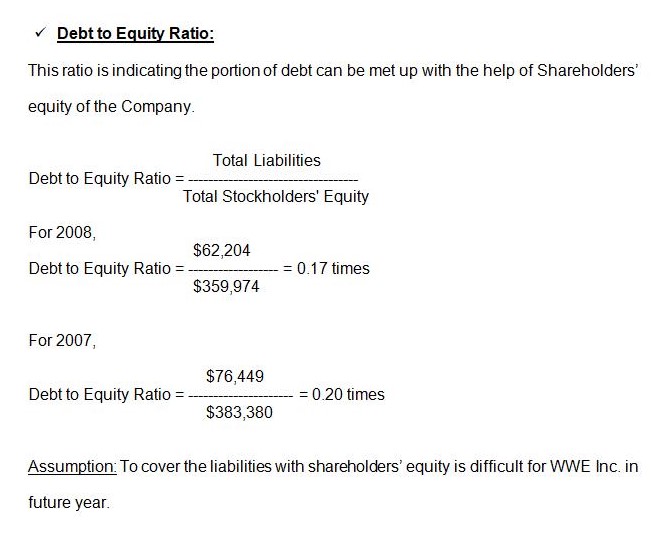
Assumption: To cover the liabilities with shareholders’ equity is difficult for WWE Inc. in future year.
- Interest Coverage Ratio:
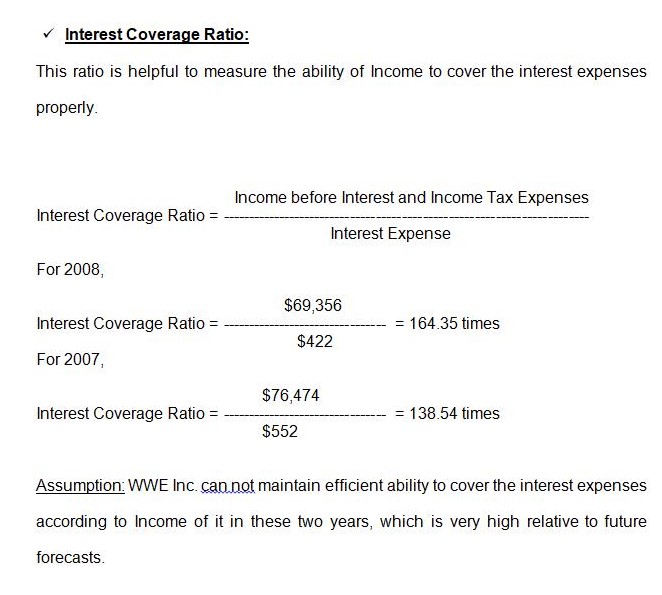
Assumption: WWE Inc. can not maintain efficient ability to cover the interest expenses according to Income of it in these two years, which is very high relative to future forecasts.
Capital Market Analysis Ratios
These ratios are helping to analyze the market conditions of capital according to price of stock, book value of stock, dividend, and dividend payout by the Company.
- Price Earnings (PE) Ratio:
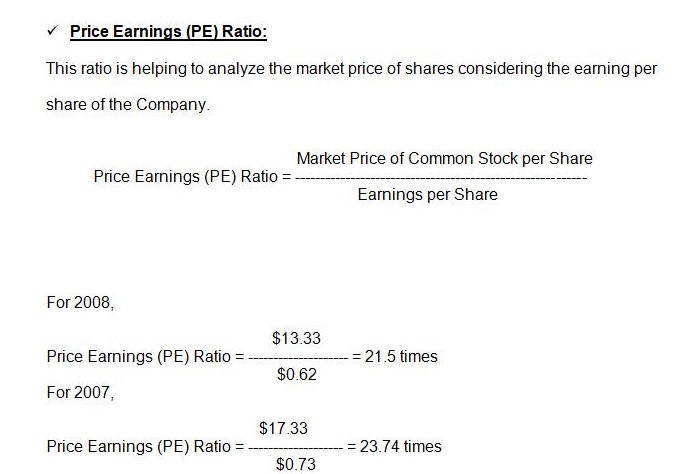
Assumption: Price earning ratio is more in recent year, which indicates that, WWE Inc. has the effective and higher market price of stocks to cover the earning per share.
- Market to Book Ratio:
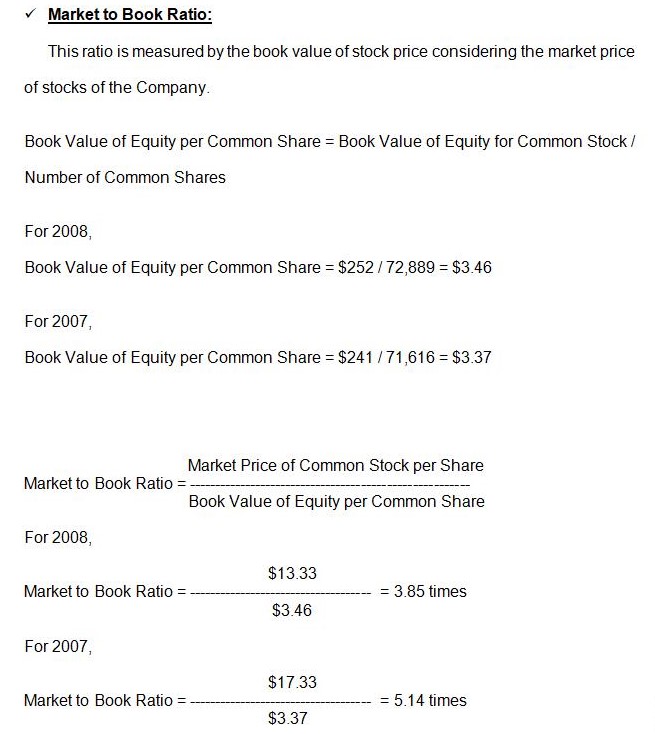
Assumption: The Company has the ability to cover the book value of stocks according to market price in the market.
Preparing Projected Financial Statements
To prepare Projected Financial Statements of WWE Inc., first it is important to know the financial statements of the Company.
For preparing projected financial statements, first WWE Inc. has to develop a growth rate, which indicates times to increase proportionately with factors. [ growth rate= (1+g)n ]
Table 1:Projected Net Income (dollars and shares in thousands, except per share data).
Table 2:Projected Balance Sheet (dollars and shares in thousands, except per share data).
Presenting Agenda for Actions
To take actions for the development of new strategic decisions, WWE has to prepare an agenda, which is given below with a help of lists:
- Preparing Goals and Objectives for Strategies.
- Describing Outcomes of each strategy.
- Calculating Cost Effectiveness of each strategy.
- Planning activities to achieve Goals of Strategies.
- Including Detailed Description of Strategic Plan.
- Implementing Strategic Plan.
Recommendations for Specific Annual Objectives
In this part, WWE Inc. has to be analytical in terms of meeting its annual objectives. In this objective part, the corporate goals are determined to invest in long term projects or plans. These goals must be known to Board of Directors by reviewing their performances of current period and forecast of future period. By these, WWE Inc. can generate maximum revenues from sports and entertainment show to viewers and fans.
Recommendation for Proceeduring Strategic Review and Evaluation
In strategic review and evaluation of WWE Inc., there are some steps to be followed, which are:
- To know the familiarities of the strategic decisions according to shareholders and other governing bodies of WWE Inc.
- To build up the knowledge of the brand of WWE Inc. in International market.
- To grow familiarities of strategic development and policies in global and regional market.
- To build capacity to perform strategies properly.
Conclusion
According to the studies, it is known that, the WWE Inc. is a popular entertainment and sports business in global and regional market. Although it is a successful company with a leading position, WWE Inc. has some worries about further development of business. For these reasons, some methods are developed to focus on the problems regarding its business. The problems can be solved by developing strategic decisions to become successful in market share and profit generation.This study is appropriate for these steps to be done.
References
- Cleveland State University, Grand Strategy Matrix.
- Kotler, Philip, Kevin Lane Keller, Marketing Management. New Jersey: Pearson Prentice Hall, 2006.
- QSPM Quantitative Strategic Planning Matrix. 2009. Web.
- Maxi-Pedia, Internal-External (IE) Matrix. 2009. Web.
- Meredith E. David, Forest R. David,Fred R. David. The Quantitative Strategic Planning Matrix (Qspm) Applied To A Retail Computer Store. 2009.
- Nábrádi, Prof. Dr. András. Faculty of Ag. economics and Rural Development. 2009.
- Scott Besley, Eugene F. Brigham. Essentials of Managerial Finance. Thomson South Western, 2006-2007.
- SANTOS, The Competitive Profile Matrix (CPM) 2009.
- School of Management AU, The Strategic Position and Action Evaluation (SPACE) Matrix. 2009.
- World Wrestling Entertainment Inc. Annual Report, 2008.
- World Wrestling Entertainment Inc., Company Profile. 2009. Web.