Introduction
Monitor PLC deals in the manufacturing of the electronic components for sale to the audio-visual industry. Most of its components are sold to companies like Sony, Panasonic and Samsung among others. The company is listed the stock exchange and so its securities are traded there. This paper provides a report analysis of the performance of the company based on the four year financial reports provided. It also provided a discussion of the financial ratios of the company and the role they play in measuring the financial performance. The company is also compared with its close competitors in the industry. The financial performance is assessed using profitability ratios, liquidity ratios, efficiency, investment and gearing ratios.
Financial performance report presented to The Board of Directors
The following financial performance indicators are used as the parameters for assessing the financial performance of the company:
Profitability ratios
According to Belkaoui (1992), profitability ratios evaluate the firm’s earnings with respect to a given level of sales, a certain level of assets, the owner’s investment, or share value. For Monitor PLC, the level of profitability will be assessed using the following profitability ratios:
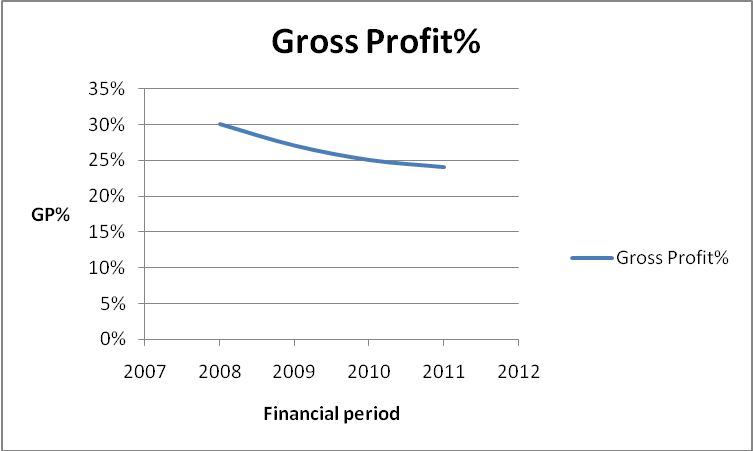
Gross profit margin = Gross profit x 100
Sales:
For this company, the GP margin shows a decline between 2008 to 2011 financial periods. The ratio in 2008, the ratio was 30%, 27% in 2009, 25% in 2010 and 24% in 2011. This would mean that the cost of sales for Monitor PLC has been increasing between 2008 and 2011 financial periods making the gross profit to decrease. The ratio generally indicates the efficiency with which the management produces each unit of a product by controlling the cost of sales. The trend is represented by the following curve
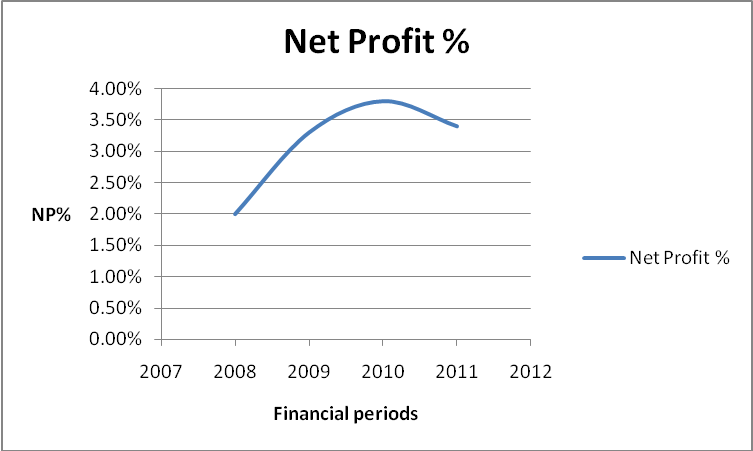
Net profit margin = Profit after tax x100
Sales:
This ratio indicates the ability of the firm to control financing expenses in particular interest expense. Net profit is calculated by deducting the expenses from the gross profit. For Monitor PLC, the net profit margin has not shown a smooth trend between 2008 and 2011 financial period. The ratio was 2.0%, 3.3%, 3.8% and 3.4 % respectively in 2008, 2009, 2010 and 2011. The ratio increased from 2008 to 2010 and then declined in 2011. This shows that the company expenses increased in 2011 thus reducing the net profit margin. The trend can be summarised by the following curve:
Return on equity = net profit x 100
Equity:
This ratio indicates the return of profitability on one shilling of equity capital contributed by shareholders (Berry, Jarvis & Jarvis, 2005). For Monitor PLC, this ratio has recorded an increase between 2008 and 2011. The ratio was 3.0% in 2008, 4.2% in 2009, 4.5% in 2010 and 5.0% in 2011. The highest increase was recorded between 2008 and 2009 and the lowest between 2009 and 2010. This shows that the return on the shareholders’ funds increased in the periods covered by the financial statements for the ears above.
Return on capital employed (ROCE) = net profit x 100
Net assets (capital employed):
This ratio shows the efficiency and productivity of the firm’s net assets or capital investment. For Monitor PLC, ROCE has recorded a decrease between 2008 and 2011. For these fours financial years respectively, the rate recorded was 3.4%, 3.2%, 3.0% and 2.7%. This could be attributed to the decrease in the net profit in relation to the amount of capital invested in the firm.
Liquidity ratios
Liquidity refers to an enterprise’s ability to meet its short-term obligations as and when they fall due. Liquidity ratios are used to assess the adequacy of a firm’s working capital (Bernstein and Wild, 1999). For Monitor PLC, the liquidity level will be measured using the following ratios:
Current ratio
According to Bernard and Stober (1989), this ratio indicates the number of times the current liabilities can be paid from current assets before these assets are exhausted. It is recommended that the ratio be at least 2.0 i.e. the current assets must be at least twice as high as current liabilities. The ratio is computed as follows:
Current ratio = Current assets
Current liabilities:
For Monitor PLC, the current ratios for the four years are above the recommended level. That is, they are above 2.0. For financial year 2008, the ratio was 3.4, 3.5 in 2009, 3.6 in 2010 and 3.7 in 2011. This indicates that the firm’s liquidity remained sound during the four years and increased year after year.
Quick ratio
The liquidity soundness of Monitor PLC could be assessed using a more refined ratio than the current ratio called the Quick ratio. This ratio uses the more liquid current assets to measure the liquidity of the firm. It is calculated as follows:
Quick/acid test ratio = current assets- stock
Current liabilities:
For Monitor PLC, Quick ratio was 2.30, 2.10, 1.90 and 1.40 in 2008, 2009, 2010 and 2011 respectively. The recommended level of Quick ratio is 1.0. Although quick ratio for Monitor PLC declined from 2008 through 2011, it remained above the recommended level. The firm is therefore able to pay for its current liabilities using the most liquid current assets excluding inventories.
Cash ratio
Efficiency ratios:
These ratios are also called activity ratios or the turnover ratios. They measure the efficiency with which the firm makes use of the assets or resources at its disposal to generate sales revenue. For Monitor PLC, the following ratios are used to measure efficiency:
- Stock/inventory turnover in days
The ratio indicates the number of days the stock was held in the warehouse before being sold. The ratio is calculated as follows:
- Inventory turnover in days = 360 Days x average stock
Cost of sales
For Monitor PLC, the inventory turnover in day was 65 days, 69 days, 80 days and 89 days in 2008, 2009, 2010 and 2011 respectively. It is clear from the data that the period increased in the between 2008 and 2011. This shows that the stock movement was faster in 2008 than 2011. There was much stock in the warehouse at a corresponding period in 2011 than in 2008.
Debtors Collection Period
This refers to the credit period that was granted to the debtors on the period within which they were to pay their dues to the firm. For Monitor PLC, the period the debtors’ collection period for the four years respectively (2008 to 2011) are 75 days, 86 days, 94 and 98 days. This shows that the situation is worsening as the year tends to 2011. The ratio is calculated as follows:
- Debtors or average collection period = 360 Days
- Debtor’s turnover
Where debtors turnover is computed as follows:
- Debtors turnover = Annual credit sales
- Average debtor
Creditors Payment Period
This ratio indicates the credit period granted by suppliers (Beaver, 1966). The higher the period the better is the firm. Monitor PLC creditors’ payment periods for the four years (2008 to 2011) respectively are 45 years, 47 years, 46 years and 37 years. It seems that the creditor’s payment period for the company is quite short compared to the debtors’ payment period. This should raise an alarm to the management since the firm will be at the risk of liquidity shortages. The ratio is computed as follows:
Fixed asset productivity
This ratio measures the amount of sales revenue that is generated by the utilization of one shilling of fixed assets.
- Fixed assets productivity = Annual sales
Total assets
For Monitor PLC, the ratios for 2008, 2009, 2010 and 2011 respectively are 1.95, 1.46, 1.32 and 1.39. The productivity of fixed assets declined between 2008 and 2010 but rose slightly in 2011. The higher the ratio, the higher the productivity, and the higher is the efficiency of the firm.
Investment ratios
These are also known as market or valuation ratios. These ratios are used to assess whether it is economically viable to invest in a company. To analyse the situation in Monitor PLC, the following investment ratios will be considered:
- Earnings per share (EPS)
This ratio indicates the earnings power of the firm i.e. how much earnings or profits are attributed to every share held by an investor. The higher the ratio, the better is the firm. The ratio is calculated as follows:
- EPS = profit after interest, tax and preferred dividend
No. of ordinary shares issued
For Monitor PLC, the ratios for the four years (2008 to 2011) respectively are €0.8, €0.98, €1.08 and €0.91. The earnings per share increased between 2008 and 2010 and then declined slightly in 2011. The value of this ratio depends on the level of profit made by the firm in a given financial year.
- Price/Earnings ratio (P/E ratio)
The ratio is calculated as follows: P/E ratio = MPS
EPS
The MPS is the price at which a new share can be bought. EPS is the annual income from each share. Hence, P/E ratio indicates the number of years it will take to recover MPS from the annual EPS of the firm. For Monitor PLC, for the four years, the ratio was 14.62, 13.20, 14.31 and 17.80 respectively. For this ratio, the situation is considered favorable when the ratio is maintained at a low level.
Dividend cover
According to According to Correia and colleagues (2007), the ratio shows the number of times that the dividend can be paid from current year earnings. The higher the ratio the better is the performance of the firm. Monitor PLC dividend cover for 2008, 2009, 2010 and 2011 was 2.0, 2.9, 4.7 and 3.1 respectively. The ratio is calculated as follows:
Dividend cover = EPS
DPS
Other ratios may include Dividend yield, Average share price and Interest cover. The dividend cover increased the declined in 2011. Dividend yield and interest cover decreased throughout the period.
Conclusion
Although this company is performing well in terms of some ratios, there seem to a problem with the trend. Most of the ratios including the liquidity ratios are falling according to the trend. The company could face liquidity issues in future if the trend continues. This is a problem that needs to be investigated since it is a forerunner to bankruptcy. According to the business sector norm, the quick ratio for 2010 and 2011 were below 2.0 which was the one applicable in the sector. Although the firm is performing better in most of the ratios compared to its competitor especially the liquidity ratios, there is still need to improve.
Recommendations
The company needs to improve in most of its ratios like the quick ratio. Compared to the current ratio, this ratio is showing a steady decline throughout the period. This could be done through increasing the creditors payment period and reduce the debtors collection period.
The use of financial ratios analysis in assessing the performance of the business.
Financial ratio analysis uses the accounting information that is contained in the financial statements and reports to assess the performance of the firm. The process of financial analysis using ratios basically evaluates the relationship between component parts of financial statements to obtain a better understanding of a firm’s performance. The ratios are usually expressed as percentages, fraction or a stated comparison between two amounts. If the ratio is computed between two unrelated amounts, then it will be meaningless since there is no correlation between the components used. It is important to know that the computation of a ratio does not add any information not existing in the data under study. A meaningful ratio is only computed only when there is a significant relationship between two amounts in the financial statements. The ratio is also useless in assessing the performance of the firm unless it is compared with the same ratio over a given period of time or a similar ratio for a different company in a different or the same industry. The ratios are usually concerned with components that have significant relationships but their interpretation requires much investigation into the data used. They are not substitutes for sound thinking but only aid to analysis and interpretation of the financial information. They guide the management in decision making.
The financial ratios are used in the following ways:
First, the ratios are used for evaluating the ability of the firm to meet its short term financial obligations when their payment dates fall due. The liquidity ratios like current ratio, quick ratio and cash ratio are used in this case. They indicate the liquidity level of the firm. If the firm’s liquidity level is low, the firm will not be able to pay for its current liabilities from the current assets. The firm is at the risk of becoming bankrupt and necessary measures need to be taken.
Secondly, the ratios are used to evaluate the performance of the firm over the period covered by the financial statements. For instance, if the liquidity ratios are computed, the management of the firm will be able to tell whether the firm has performed well in that period or not, by checking whether the ratios are have reached the recommended level. If the debtors’ collection and the creditors’ payment period for a certain year are computed, the firm will tell whether the firm is on track or not. If the firm has more debtors’ payment period and less creditors’ payment period, this raises a treat to the firm’s liquidity. If otherwise, the company has therefore performed well.
Thirdly, the ratios are used for comparison of the performance of the firm which is usually done in two ways: first there is cross sectional analysis where the performance of the firm in question is compared with that of individual competitive firms that are in the same industry (BarNiv, 1990). The second way of comparison is trend or time series analysis where the firm’s performance for different periods is evaluated. This helps the management of the firm to know whether the firm is retrogressing or progressing in growth.
Fourthly, the ratio analysis is used for predicting the future performance of the firm. The management predicts the future performance of the firm for the purpose of future planning. They need to have data about what might happen to the firm in the future.
Fifthly, the ratios are used to establish the efficiency of assets utilization to generate sales revenue (Basu, 1983). The ratios used in this case may include fixed asset productivity ratio or the asset turnover ratios. The ratio determines the sales revenue that is generated from the utilization of one shilling worth of an asset.
Sixthly, the ratios are used to establish the extent which the assets of the firm have been financed by fixed charge capital. For example, the Equity ratio determines the extent to which the assets are financed by the owners of the firm. This also determines the creditworthiness of the firm.
Financial ratios are very applicable in measuring the performance of the firm. However, they are criticized because of their limitations. There are some factors that limit the application of financial ratios. These factors are discussed below.
Factors limiting the application of financial ratios in measuring the firm’s performance.
The first limitation of ratio analysis is that ratios are computed at a specific point in time. This means that the decision made by the firm may not be reliable because it does not reflect what has happened in the firm during the rest of the period (Bragg, 2002). There are many things that may take place in the firm that may cause disruptions in the firm. For instance, the debtors may encounter short-term problems with settling their dues. As a result the liquidity ratios will reflect that the firm is facing liquidity shortages. The decision that the management will make as a result will be wrong.
The ratio analysis also ignores the effect of inflation in performance which is a factor affecting businesses on daily basis. Inflation is rise in price level of almost all items in an economy (Bragg, 2003). This would affect ratio analysis in the sense that it causes the cost of sales to increase. As a result the ratios associates with sales, profit and cost of sales might mislead planners and decision makers.
The other limitation is that the comparison is made even between firms with different sizes and technology. This would also mislead decision makers since the size of the firm and technology embraced makes a big difference in performance. The firm may have a small profit margin but makes huge sales and therefore enjoys economies of scale (Bodie, Kane & Marcus, 2006). If this is compared to a small firm that has a high profit margin, then the decision made will be erroneous.
The ratio analysis also engages the use of historical data contained in financial statements which may not be relevant indecision making. The decisions reached will be unreliable because the data used is old.
According to Banz (1981), the policies that are used by the firm to calculate depreciation are also a hindrance to ratio analysis. This is because different policies come up with different figures which will result in different net profit figures for the company. If the companies compared uses different accounting policies, then it will be wrong to use such data to assess the performance of the company.
To avoid these problems, the data used to calculate ratios need to be investigated further before the making any decision. According to Brickely (1983), the management and financial analysts should try as much as possible to use the current data in ratio analysis and decision making. They can also use ratios that are most reliable in decision making.
Reference List
Banz, R., 1981. The Relationship Between Return and Market Value of Common Stocks. Journal of Financial Economics, 9 (March): 3-18.
BarNiv, R., 1990. Accounting Procedures, Market Data, Cash-Flow Figures, and Insolvency Classification: The Case of the Insurance Industry. The Accounting Review, 65 (July): 578-604.
Basu, S., 1983. The Relationship Between Earnings’ Yield, Market Value and Return for NYSE Common Stocks: Further Evidence. Journal of Financial Economics, 12: 129-156.
Beaver, W.H., 1966. Financial Ratios as Predictors of Failure: Empirical Research in Accounting. Selected Studies, Supplement to Journal of Accounting Research, 3: 71-111.
Belkaoui, A. R., 1992. Value Added Reporting: Lessons For the United States. New York: Greenwood Publishing Group.
Bernard, V.L., and Stober, J., 1989. The Nature and Amount of Information in Cash Flows and Accruals. The Accounting Review, 64(October): 624-651, 289.
Bernstein, LA, Wild, J., 1999. Analysis of Financial Statements, 5th Edition. New York: McGraw-Hill Professional.
Berry, A., Jarvis, P., & Jarvis, R., 2005. Accounting in a business context. London: Routledge.
Bodie, Z., Kane, A., & Marcus, J., 2006. Essentials of Investments (5th Ed. Irwin: Boston Beer Company.
Bragg, S. M., 2002. Business ratios and formulas: a comprehensive guide. New York: McGraw-Hill Professional.
Bragg, S. M., 2003. The new CFO financial leadership manual. London: Wiley.
Brickely, J., 1983. Shareholder Wealth Information Signaling and the Specially Designated Dividend. Journal of Financial Economics, 12: 187-210.
Correia, C., Flynn, D., Uliana, E and Wormald, M., 2007. Financial Management. South African: Juta and Company Ltd.