Introduction
Performance evaluation of a company is one of the most important analyses for investors and other stake holders interested in the affairs of the company. Saudi Arabia Fertilizer Company is one of the largest corporations in Saudi Arabia which is in the business of manufacture and distribution of fertilizer manufacturing and distributing oil and gas. It distributes Urea, ammonia, sulphiric acid and melamine. The company has its headquarters in South Arabia. And its head office is situated in Saudi Arabia. The company is listed in Saudi Arabia Stock exchange and it is code 2020. The company was formed in south Arabia and became the first company in the country to be involved in petro chemical industry. It was owned by the government before it was sold partly to the public in 1965. It has become one of the leading manufacture and distributor of fertilizer not only in Middle East but world wide. The company currently has my Mohammed H Al-Ohaili, Mr. Abdulaziz S. Al Anbar, Mr. Ibrahim M. Al Saif, Mr. Abdulah A Al-Assaf, Mr. Naser Al All Sayyari as directors of the company. The company is owned by the public organizations and SABIC at the rate 42.9%, 11.8% and 45.3%. The company has many subsidiaries including Arabian industries, industrial fiber company, national chemical fertilizer company and many others.
Purpose of Study
The main purpose of this study is to identify the performance of Saudi Arabia Fertilizer Company for potential and existing investors who will wish to put their money in Saudi Arabia stock exchange. The other purpose is to identify how currently the company is performing in the market compared with other companies from outside Saudi Arabia during this period of financial crisis. It will also assist in developing the most appropriate performance evaluation framework for companies listed in stock exchanges. Lastly it will assist the student to grow professionally by understanding how performance, evaluation of a company is carried out.
Methodology and Sources of Data
The methodology in evaluating this company will involve searching materials through internet and books. I will use books with materials on how evaluation is carried out. There are many books in areas of finance which will assist me carry out ratio analysis and company evaluation. Books will offer me general information about the topic and that will assist me to complete this project. However, internet will play the most crucial part by providing the required financial statements and reports for the company. Through the internet I will collect the relevant materials that show company evaluation. I will do funnel checking through the internet so that I can be able to get the required financial statements.
The analysis of this report will take there dimensions, first I will carry out ratio and trend analysis by calculating the ratios and historical financial reports of the company that is from 2006 to the year 2008. Then I will carry out break even analysis degree of operating leverage, cost of capital and the type of financing available.
From The income statement and balance sheet adapted from Taib Research, shows that there was an improvement in the operations of the company income grew there was also growth in assets of the company. Every thing was an upward trend regardless of the current financial crisis that has engulfed the world. The improvement in the net profit in the past three years is due to the improvement in sales revenue and this can be seen from assets turn over.
Scope and Limitations
The scope of this study covers a period of three years from the year 2006 to the year 2008. The scope follows the data obtained from research and organization and this data is analyzed using ratio analysis, breakeven analysis and other investment analysis tools. This study focuses only on evaluating financial performance of the company which is necessary in assisting the existing or potential investor. However, this study assumes that other factors like financial crisis in other countries, reputation of the company are irrelevant to decision making. The study will be used as a supplementary framework that will be used in analyzing financial performance of the company.
Production And Cost Analysis
Nature Of Product Line And Underlying Technology
The company in question trades in oil gas and fertilizers. The fertilizer that is manufactured by this company includes urea ammonia, sulphiric acid and melamine. It is listed in the stock exchange and it is a pioneer in Middle East in the industry of fertilizer manufacturing. The company has adapted technology full scale and they have invested heavily in technology. This has made their production process easier and quick thus increasing productivity.iin area of oil and gas, the company has embrace modern technology in production and distribution of gasses.
Product capacity and production volume
The company has a capacity of producing and serving not only the neighboring country but many countries. There production capacity includes bio-diesel, gas, ethanol, transportation fuels, fertilizers; they are the main suppliers of fertilizer in south Asia, East and West Africa, Brazil and other Latin American countries. This company is one of the most expanded companies of Saudi Arabia. Because of the technology they have embraced they are capable of producing large volumes of products that will be distributed worldwide.
Breakeven Analysis
Break –even analysis focuses on the measurement of the breakeven point. Before we attempt ant calculations, it is necessary to make certain assumptions about the behavior of costs and revenues. Thus, we assume that costs and revenue patterns have been reliably determined and that they are linear over the range of output which is being analyzed. These assumptions also implies that costs may be resolved without difficult into fixed and variable costs; that fixed costs will remain constant, that variable costs will vary proportionally with volume of output; and that all other factors will remain constant, that is, that selling price will remain unchanged, that the methods and efficient of production will not be altered and the volume is the only factor affecting costs. It is because these assumptions are difficult to maintain in a ‘real life’ situation that breakeven analysis cannot pretend to be anything but a rough guide. Its real value to management lies in the fact that it highlights the relationships between the factors affecting profit, allowing management to make certain assumptions about these factors and seeing the likely effects of changes in these assumptions. Hence, breakeven analysis is useful as a management decision model.
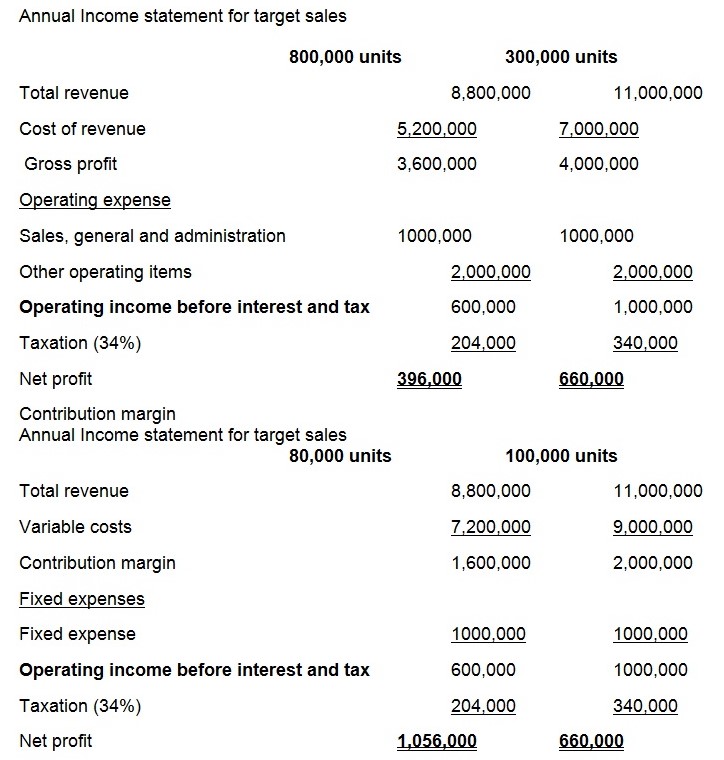
At Break-even, the cost of production is equivalent to the sales revenue. In this case the fixed costs 1000,000. The unit revenue is 110 while unit variable costs are materials 90 per unit. Therefore, breakeven analysis will be as:
When they want to sell at 110 the break-even will as follows:
- Breakeven point = fixed cost
- Contribution margin per unit
- Fixed cost = 1000,000
- Contribution per unit = selling price- variable cost
- Contribution = 110-90= 20
- Therefore breakeven point = 1000,000
- 20
- = 50,000 units
Degree of operating leverage
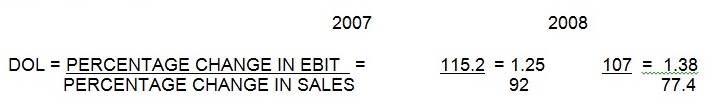
The degree of operating leverage for the company will be calculated as percentage change before interest and tax and percentage change in sales. Percentage change in sales was 92% from year 2006 to 2007 while it was 77.4 % from year 2007 to 2008 percentage change in earnings before interest and tax was 1115.2% from year 2006 to 2007 and it was 107% for year 2007 to the year 2008. Therefore the degree of operating leverage is calculated as follows”
Financial Ration and Trend Analysis
Liquidity Ratio
Liquidity ratios measure the firm’s ability to pay its bills over the short run without undue stress. The three liquidity ratios focus on current assets and current liabilities. The average quick ratio for Saudi Arabia fertilizer co. between 2005 and 2008 is 3.5:1 and the current ratio is 4:1. The quick ratio measures the immediate ability to pay financial obligations. Inventories are normally the least liquid of a firm’s current assets, which is why they are the current assets on which losses are most likely to occur in a bankruptcy. Therefore, a measure of the firm’s ability to pay off short-term obligations without relying on the sale of inventories is important. The quick ratio has been above 2:1, thus, providing a three-year quick ratio average of 3.5. The company’s results of its quick ratio show a similar analysis as the current ratio; both show an improvement in Saudi Arabia fertilizer co. liquidity from 2006 to 2008. The quick ratio results show that Saudi Arabia fertilizer co. may have enough resources that can be liquidated to cover short-term obligations. Saudi Arabia fertilizer co. Corporation has maintained a current ratio greater than industry average. The current ratio from the perspective of a shareholder is that a high current ratio could mean that the company has a lot of money tied up in nonproductive assets or perhaps it is due to large cash holdings, which might well become target of employees with fraud mind. This is why shareholders might not want a high current ratio. Thus, in a worst case scenario, Saudi Arabia fertilizer co. would have just enough resources that could have been liquidated to cover short-term obligations. The current ratio has been gradually increasing over the three year period. Current ratio means that for every dollar the company owes in short term liabilities, it has more $ 4 on average in current assets. This means that so far, so good – the company has enough liquidity. Still, before concluding that Saudi Arabia fertilizer co. can meet all its debt obligations based on the current ratio and the quick ratio, cash ratio must also be observed. Between the current ratio, the quick ratio and cash ratio the cash ratio is a better way to assess the company’s ability to meet obligations. Unlike the current ratio and the quick ratio excludes non cash items because it is often the least liquid current asset and most likely will be sold under its book value if the company is faced with financial distress.
Activity Ratios
Asset management ratios measure how efficient Saudi Arabia fertilizer co. was with the utilization of its assets. More specifically, the ratios show how the firm used its assets to generate revenue. The financial data shows that the asset turnover ratio for the three years to be fairly consistent. Saudi Arabia fertilizer co. asset turnover ratio indicates that during the three years the company produced $0.27, 0.47 and 0.54 for every dollar invested in assets in 2006, 2007 and 2008. By knowing Saudi Arabia fertilizer co.’ asset turnover ratio, it provides an insight into its pricing strategy. A company with a low asset turnover signifies that they have a high profit margin, and a company with a high asset turnover tends to have a low profit margin. The inventory turnover ratio measures how much was sold off, or turned over in the course of one year. However, activity with regard to inventory shows a haphazard performance with improvements being interchanged with poor performance. Saudi Arabia fertilizer co. turned over their inventory in 2006, 2007 and 2008 at 2.8,3.7 and 3.1 times. As shown by the inventory turnover ratio, the number of times that stock was turned to sales improved to 3.7 times in 2007, then 3.1 times in 2008. It means that the efficiency with which the firm is utilizing its stock to generate sales revenue is high and improving overtime.
The accounts turnover has been relatively consistent between 2006 and 2007 but growing. The rate at which the company converts debtors/receivable into cash in 2008 is times 5.6 which are higher than the figure of 2006 and 2007 of times 2.8 and 4.6 respectively. It means that the efficiency with which the firm is utilizing its debtors to generate cash is improved. Sales to account receivable is increasing over the three years showing that company is rapidly converting its receivable into cash.
Leverage ratios
Leverage ratios measure the company’s long-run ability to meet its obligations. The average total debt ratio for the three years is 25.33%. This means that Saudi Arabia fertilizer co. has $0.2533 in debt for every $1 in asset. Saudi Arabia fertilizer co. three year average debt ratio of 25.33% is due to the cost associated with short-term and long-term debt, liabilities, accounts payables, wages, accrued liabilities, and other long-term liabilities. Saudi Arabia fertilizer co. debt ratio has been decreasing in the past three years; this is a good sign of financial stability. The total debt to total assets ratio is measured by adding short term debt to long term debt and dividing it by total assets. The average long term debt to equity ratio for the three years is 15.70%. Debt ratios also show the company’s overall financial situation. The total debt to total assets ratio has also been increase in the three-year period. This measures how much of Saudi Arabia fertilizer co’s assets have been financed by debt; it determines a company’s financial risk. As to the company’s ability to pay its long term debt, it seems that its assets are sufficient.
Capital structure of the company show how much of the company assets are financed by the company through debt and how much from equity. Long term debt as a component of financing is only 10.92per cent at 2008. However the exhibit above shows that the company is reducing its reliance on creditor financing steadily from 22.43% to 13.74% in year 2006 to 2007respectively. This decrease in debt finance came mostly from repayment of the company. Long term ratio has also reduced drastically showing that the company is relying mostly on debt as compared to equity. The company capital structure is poorly financed as compared to industrial average. The chart below shows how debt has measure for the last 3 years as compared to the industrial average:-
Profitability Ratios
Profitability ratios measure how efficiently the company manages its operations and how efficiently it uses its assets. The average three year gross profit margin is 66.08 % this measures the profitability at the most basic level. The only thing is that the gross profit margin does not take into account taxes and the expenses needed to facilitate operations. Unlike the gross profit margin, the net profit margin does provide this information and is often a more accurate estimate of the company’s profitability. Net profit margin for Saudi Arabia fertilizer co. Corp. has been stable between 2006 and 2008. The three year net profit margin average is approximately 55.82% This signifies that the company generated about $0.5582 in profit for every dollar made from sales. The operating profit margin over the past three years is 40%. The gross profit margin was almost double the industry’s ratio and the net profit margin was the same at its industry average ratio. These are good indicates about how Saudi Arabia fertilizer co. is doing financially compared to other companies in its industry.
Return on equity (ROE) measures how stockholders of the company performed during the year. The average ROE during 2006 and 2008 was 37.2%. This means that for every dollar invested the company generated $0.37 in profit. The Return on Equity is calculated using the DuPont method. The DuPont analysis breaks down the return on equity into three parts: operating efficiency, asset use efficiency, and financial leverage. The operating efficiency measure net profit margin, the asset use efficiency measures total asset turnover, and the financial leverage measures equity multiplier.
- ROE = (Net Profit Margin) * (Total Asset Turnover) * (Financial Leverage)
- ROE = (Net Income/Sales) * (Sales/Assets) * (Assets/Equity)
Saudi Arabia fertilizer co.’ return on equity in 2008 is good because it is higher than the average of its industry’s ROE.. This is a good indication that Saudi Arabia fertilizer co. has a good financial leverage coefficient since its return on equity is higher than average which makes it a better investment than other companies in its industry. Also, since Saudi Arabia fertilizer co.’ ROE is continually increasing this indicates that it is maintaining a high return on equity which will continue to make it a better investment. Return on assets was also ion the higher side because it was more that 17.51 for the two years.
In general there is an upward trend in the profitability rations for this company. It looks profitable for any investor to put his or her money.
Growth
There is an increase in profitability of the company regardless the worsening situation of the global economy was eventually reflected into the price of Saudi Arabia Fertilizer Company as they traded in the stock exchanges.
This increase resulted to an increase in price earning ratio to 5.63 times in the year 2008 January. This and other factors such as earnings yield, dividend yield made the company’s total investment return to its shareholders for the period ending June 30, 2008 to be positive. However, the market estimated that Saudi Arabia earnings per ordinary share in the next fiscal year, June 30, 2009, is actually higher than their estimate of current years because of the trading. The current price earning is estimate of fiscal year ending 2008 is 14.86 times.
Capital Investment and Financing
Analysis of Capital Expenditure
The company is one of the larges fertilizer producer in he world not only in middle east. It is estimated that in future it will remain one of the largest distributor of fertilizer in the world. Based on this the company invested $ 630 million for expansion into new projects. The company also entered into joint ventures with other companies in order to increase their products. This projects that the company has entered into are very expensive and they involve huge capital investment
The average rate of return on investment
The average return on investment for this company can be estimated using DuPont analysis carried above. From this analysis return on investment for the year 2008 is estimated to be 50.6 %(refer return on equity). This is a higher return and any investor with such a share will not be willing to sell the share because the return in 50% on the growth investment.
Short Term Vs Long Term Sources Of Financing
This company has both long-term and short-term financing. Short term financing in this company include account payable and other liabilities while long term financing includes long term debts. This two form of debts consists of at most 20% of the total financing for the organizations operations. The company also has common stock which forms the large part of financing for this company. From the financial statement it can be noted that the share capital over common equity was in the verge of growing although earnings per share was also increasing. In case the company wants to carry out further investments they have at their disposal long term debts and common equity to go for to invest for any project. It can be noted with the kind of financial performance even international venture capitalist will be willing to put their money in this company.
Debt ratios
The debt ratios calculated above indicated that the company is reducing reliance on debt. For example long term debt was on a downward trend as compared to equity. Total debt to total assets was also decreasing at a faster rate. These two debts have reduced to the point of 20.18 % on the higher side.
New common stock issue
The company has room to issue new share capital into the market. However between the year 2007 and 2008 the company issued share capital equivalent to 500 million Saudi Arabia 500 million. This was a new injection of capital that improved the liquidity of the company. The number of shares issued was 50 million and it was 25 % of the existing shareholding. This increased the number of share being traded in the market but did not affect the value being traded in the company.
Dividend policy
The company has been issuing dividend to their shareholders because of good performance the company enjoys. This has made the shares of the company very attractive to majority people as at January 2008 dividends yield was 7.52 % an indication that the company’s dividend policy was among the best in the market. The company has a policy of paying dividends annually and this has been a since 1998. However, the company last accounting period they issued dividend per share of 7.6 which yielded dividend yield of 5.4
Sources and Uses Of Funds
Sources of funds for this company can be issue of new shares to the market debenture of loan capital.
Cost of capital estimation
In estimating the cost of capital for this company one will use weighted average cost of capital which consists of cost of debt and cost of equity? in estimating cost of equity CAPM will be used. CAPM is a model for pricing an individual’s security or a portfolio. The investor has a higher rate of risk since he invests in the form of assets. An asset or portfolio may be in the form of bonds, stocks, options, warrants, real estates and all its other forms. The investor posses a higher rate of return more assets into it. In this kind of model, investors were risk averse. Given two asset with the same expected return, it is expected that they rather choose the less risky one. Investors can lower their risks by holding non-diversifiable risk portfolio. Diversification allows the same portfolio return with reduced risks. By using the formula we will know how much risks we put in investing:
- Individual security’s / beta = Market’s securities (portfolio)
- Reward-to-risk ratio Reward-to-risk ratio
The model assumes that an expected return, investors would likely prefer lower risk than higher risks. Given a certain level of risk will prefer higher returns to lower ones. Investors are not allowed to accept lower returns for higher risk. The model assumes that all investors agree about the risk and possible returns of all assets. The model also assumes that there is no taxes or transaction costs.
In this case our Beta is 1.1 the market portfolio rate is 10% and risk free rate is 6% therefore the cost of equity will be as follows Ke = rf + Beta (Rm – Rf) = 6 + 1.1 (10-6) = 10.4%
Assuming the effective cost of debt is 5.2% then the cost of capital will be calculated as follows:
Evaluation of stock price performance in the market
Par value:-From the financial statements available from Tain Research, the shares are 200 million with value of two billion. This means that the share has a par value of 10. This can be confirmed by the issued shares in the year 2008. They issued 50 million shares which had a par value of 500 million.
Book value:-The book value of this company can be estimated by considering the net worth of the company and the number of issued shares.
- Book value = net worth
- No of shares
- The net worthy of the company is 7566730000 and the number of shares is 200 million
- Book value = 7566730000 = 37.83
- 200
Market value:-The market value currently was trading at 101 in the second January 2009. These shares are over valued compared to the book value.
EPS:-Earnings per share is the total earnings of the company divide by the number of shares and in this company in the year 2006, 2007 and 2008 earnings per share was as follows:
DPS:-The current dividends issued to the company shareholders were 7.6 per share at the time with a dividend yield of 5.4 percent. However the dividend yield is 7.52
P/E:-The price earning ratio of the company currently stands at 7.3 % however in October it was 9.24 and the decrease is associated with the financial crisis currently affecting the world.
Summary and Conclusions
Therefore the operating efficiency is high and increasing and this is influencing the value of ROE. Therefore, improvements and innovations are sought on the technological side for Saudi Arabia fertilizer co. in order to catch up with the competitors.
I feel myself highly motivated after reviewing such a vibrant growth in the industry and I will definitely recommend myself to invest on Saudi Arabia fertilizer company stock, because the company’s brand are too strong to sale out easily and the company is making tremendous growth in its every sector and segment.
Another reason for this recommendation is that the availability of stock and quality of products also attracts me a lot for starting business with this company. In short the company’s capital management is quite efficient to cope with the modern world trends by introducing innovations in the products of the company.
References
Davis, H.Z,. and Y.C Peles , Measuring Equilibrating Forces Of Financial Ratios , The Accounting Review (1993)
Eisen, P.; (2003;)Accounting the Easy Way; Barron’s Educational Series
Henderson, S., Peirson, G. and Herbohn, K., (2008), Issues in Financial Accounting, 13th edition, Frenchs Forest: Pearson Education Australia.
Largay, James A III and Clyde P. Stickney, cash flows, ratio analysis and the W.T Grant Bankruptcy, Financial Analysis Journal (1980)