Abstract
The unemployment rate is normally subject to diverse economic factors that prevail in the varied economic environment. In this case, the purpose of the study was to ascertain the influence of inflation rate, gross domestic product, mortgage rate, and income growth rate on the unemployment rate in the United States. Exploratory data analysis using scatter plot and correlation analysis indicated that the unemployment rate has a moderate relationship with the mortgage and a weak relationship with the gross domestic product, the inflation rate, and the income growth rate.
Multiple regression analysis indicates that gross domestic product, inflation rate, income growth rate, and mortgage rate collectively explain 11.7% of the variation in the unemployment rate. Moreover, multiple regression analysis shows that gross domestic product, inflation rate, income growth rate, and mortgage rate are statistically significant predictors of the unemployment rate in the United States (R2 = 0.117, p = 0.001).
However, these findings have some limitations as the study used data collected in the United States from 1776 to 2012. Thus, future research should include other countries and use recent data to enhance the external validity of the findings.
Introduction
Globally, unemployment is a significant economic issue that has marked effects on economic development, for it influences the utilization of human capital. Developed countries have a low unemployment rate than in developing countries because they have many job opportunities to maximize their human capital (Tunah, 2010). In essence, the unemployment rate is an economic indicator that is subject to many economic factors that exist in diverse economies.
According to Aurangzeb and Asif (2013), economic growth has a positive relationship with the employment rate and a negative relationship with the unemployment rate. Therefore, in predicting the influence of income growth rate, inflation rate, mortgage rate, and gross domestic product on the unemployment rate, the following research questions are applicable:-
- What is the effect of the gross domestic product on the unemployment rate in the United States?
- What is the effect of the inflation rate on the unemployment rate in the United States?
- What is the effect of income growth rate on the unemployment rate in the United States?
- What is the effect of the mortgage rate on the unemployment rate in the United States
- What is the collective effect of the gross domestic product, the inflation rate, the income growth rate, and the mortgage rate on the unemployment rate in the United States?
Data Set
The data set for analysis, which is in the MS Excel format, was obtained from the Federal Reserve website.
Given that the data set has numerous variables, the study selected five variables, which are relevant and appropriate to this topic and stated research questions. The selected variables for the study are inflation rate, unemployment rate, gross domestic product, mortgage rate, and income growth rate. All these variables have a continuous scale of measurement; hence, enabling their quantitative analysis using regression analysis.
Regression analysis requires quantitative data because it determines the degree of relationships between the dependent and the independent variables (Field, 2013). Thus, the inflation rate, the gross domestic product, mortgage rate, and income growth rate are independent variables (predictors), whereas the employment rate is the dependent variable (criterion variable).
Data Analysis
The study will use exploratory data analysis in ascertaining the relationship between the dependent variable (the unemployment rate) and the independent variables (gross domestic product, inflation rate, income growth rate, and mortgage rate). In this case, the study will use correlation analysis in exploring data and ascertaining the strength of the relationship between the dependent variable and the independent variables. According to Healey (2013), the correlation coefficients provide the basis of choosing variables for regression analysis. In regression analysis, independent variables, which have a significant relationship with the dependent variable, will be selected and included in the regression model. In contrast, independent variables, which do not have a significant relationship with the dependent, will be eliminated from the regression model.
Results
Relationship between the unemployment rate and GDP growth
Scatter plot
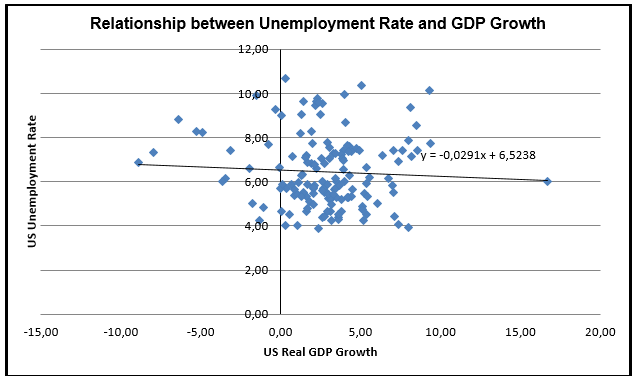
The scatter plot demonstrates that the unemployment rate and GDP growth in the United States have some relationship. The trend line in the scatter plot illustrates that there is a negative relationship between the unemployment rate and GDP growth in the United States for the last three decades, from 1976 to 2012.

Correlation Analysis
Correlation analysis shows that the unemployment rate and GDP growth rate have a very weak negative correlation, which is statistically insignificant (r = -0.059, p = 0.476).
Table 1.
Regression Analysis
The model summary shows GDP and unemployment have a very weak relationship (R = 0.059). The R-square indicates that GDP growth explains 0.4% of the variation in the unemployment rate and is it statistically insignificant (R2 = 0.004, p = 0.476).
Table 2.
The ANOVA table (Table 3) reveals that the regression model predicting the relationship between the unemployment rate and GDP is not statistically significant, F(1,144) = 0.511, p = 0.476).
Table 3.
The coefficient table (Table 4) shows that a unit increase in the GDP growth rate results in a decrease in the unemployment rate by 0.029 (p = 0.476).
Regression equation: Unemployment rate = 6.524 – 0.029(GDP growth rate).
Table 4.
Therefore, the regression test fails to reject the null hypothesis that gross domestic product has no statistically significant effect on the unemployment rate in the United States (R2 = 0.004, p = 0.476). This finding is in line with that of a study done in Pakistan, which shows that GDP is not a statistically significant predictor of unemployment (Umair, & Ullah, 2013)
The relationship between the inflation rate and the unemployment rate
Scatter Plot
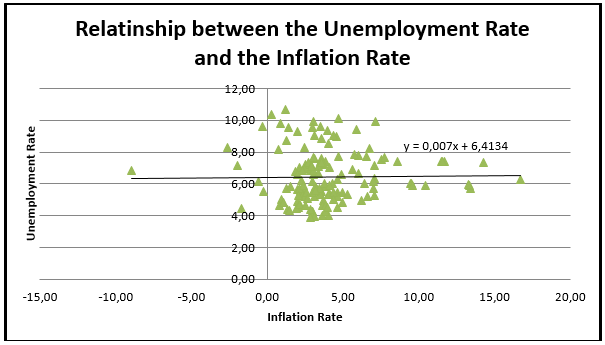
The scatter plot depicts that the unemployment rate and the inflation rate have no relationship. The trend line shows that unemployment and the inflation rate have a very negligible positive relationship.

Correlation
The correlation coefficient reveals that the unemployment rate and inflation rate have a very weak positive correlation, which is statistically insignificant.
Table 5.
Regression
The regression summary table (Table 6) depicts that there is a very weak relationship between the unemployment rate and the inflation rate. R-square coefficient shows that inflation rate explains 0% of the variation in the unemployment rate (R2 = 0.14, p = 0.865).
Table 7.
From the ANOVA table (Table 7), the regression model is not statistically significant in predicting the influence of the inflation rate on the unemployment rate, F(1,144) = 0.029, p = 0.865).
Table 8.
The coefficient table (Table 9) indicates that a unit increase in the inflation rate results in an increase in the unemployment rate by 0.007 (p = 0.865).
Regression equation: Unemployment rate = 6.413 + 0.007(inflation rate).
Table 9.
Hence, the regression test fails to reject the hypothesis that the inflation rate has no statistically significant effect on the unemployment rate in the United States (R2 = 0.14, p = 0.865). A study done in Romania shows that the relationship between unemployment and inflation is highly variable because it depends on the age groups of individuals assessed (Florea, 2014).
The association between the unemployment rate and the income growth rate
Scatter Plot
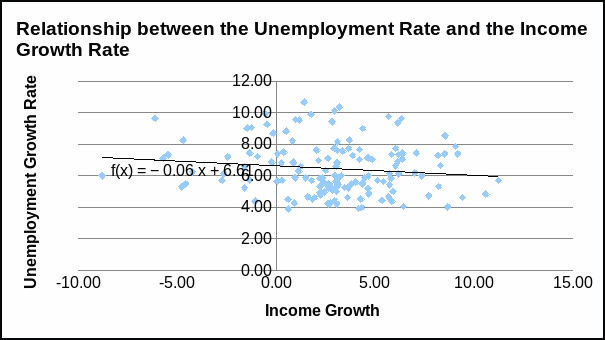
The scatter plot depicts that there is a considerable association between the income growth rate and the unemployment rate. Fundamentally, the trend line indicates that the unemployment rate and the income growth rate have negative relationships for the last three decades in the United States.

Correlation
Correlation analysis reveals that the unemployment rate and the income growth rate have a very weak negative correlation, which is statistically insignificant (r = -0.129, p = 0.121).
Table 10.
Regression
The regression analysis shows that income growth has a weak influence on the unemployment rate (R = 0.129). R-square reveals that income growth explains 1.7% of the variation in the unemployment rate, but it is not statistically significant (R2 = 0.017, p = 0.121).
Table 11.
The ANOVA table (Table 12) indicates that the regression model is not statistically significant in predicting the influence of the growth income on the unemployment rate, F(1,144) = 2.433, p = 0.121).
Table 12.
The coefficients of income growth reveal that a unit increase income growth causes a decrease in the unemployment rate by 0.06, which is statistically significant (p = 0.016).
Regression equation: Unemployment = 6.614 – 0.016(income growth).
Table 13.
Thus, the regression test fails to reject the null hypothesis that income growth rate has no statistically significant effect on the unemployment rate in the United States (R2 = 0.017, p = 0.121).
The relationship between mortgage rate and the unemployment rate
Scatter Plot
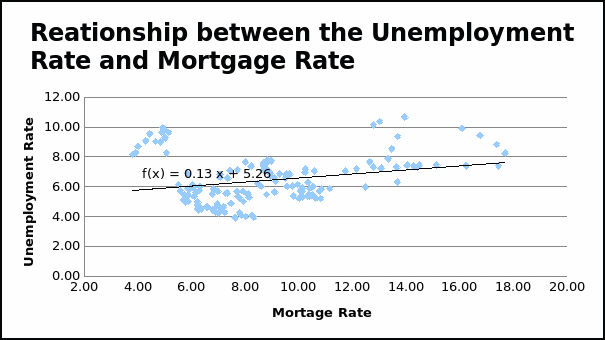
The scatter plot illustrates that there is apparent relationship between the mortgage rate and the unemployment rate. Evidently, the trend line shows that there is a strong positive relationship between the mortgage and the unemployment rate.

Correlation
Correlation analysis reveals that there is a strong relationship between the unemployment rate and the mortgage rate, which is statistically significant (r = 0.261, p = 0.001).
Table 14.
Regression
The model summary table below (Table 15) shows that the mortgage rate and the unemployment rate have strong relationship (R = 0.261). R-square indicates that the mortgage rate explains 6.8% of the variation in the unemployment rate (R2 = 0.261, p = 0.001).
Table 15.
The ANOVA analysis reveals that the regression model is statistically significant in predicting the influence of the mortgage rate on the unemployment rate, F(1,144) = 10.5.3, p = 0.001).
Table 16.
The regression coefficients indicate that a unit increase in the mortgage rate results in an increase of unemployment by 0.135 (p = 0.001).
Table 17.
Therefore, the regression test rejects the null hypothesis that mortgage rate has statistically significant effect on the unemployment rate in the United States (R2 = 0.261, p = 0.001).
The Collective Effect Independent Variables
Multiple Regression Analysis
Multiple regression analysis shows that gross domestic product, inflation rate, income growth rate, and mortgage rate have moderate relationship with the unemployment rate (R = 0.343). R-square coefficient shows that gross domestic product, inflation rate, income growth rate, and mortgage rate collectively explain 11.7% of the variation in the unemployment rate (R2 = 0.117, p = 0.001).
Table 18.
Stepwise analysis of different variables indicates that the regression model comprising gross domestic product, inflation rate, income growth rate, and mortgage rate on the unemployment rate as predictors of the unemployment rate has the lowest significance value. In this view, the regression model depicts that the collective influence of gross domestic product, inflation rate, income growth rate, and mortgage rate on the unemployment rate is statistically significant (p = 0.001).
Table 19.
The regression coefficients shows that the mortgage rate (p = 0.000), the income growth (p = 0.040), and the inflation rate (p = 0.47) are statistically significant predictors of the unemployment rate in the United States (p < 0.05). However, the regression analysis reveal that the GDP growth is a statistically insignificant predictor of the unemployment rate in the United States (p = 0.896).
Regression equation: The unemployment rate = 5.342 + 1.93(mortgage) -0.085(income growth) + 0.006(GDP growth) – 0.092(inflation rate).
Table 20.
Hence, the multiple regression analysis rejects the null hypothesis that gross domestic product, inflation rate, income growth rate, and mortgage rate have no statistically significant effect on the unemployment rate in the United States (R2 = 0.117, p = 0.001). These findings are similar to the findings of Aurangzeb and Asif (2013), which show that gross domestic product, inflation rate, and income growth rate are predictors of the unemployment rate.
Limitations of the Study
One of the limitations of the study is that the data used cover the past three decades, and thus, it might not reflect the current economic indicators in the dynamic world. Future research should overcome this limitation by using the recent data, which reflects the current economic environment. Another limitation is that the study only examined the data collected in the United States. Future research should overcome this limitation by collecting data from diverse countries.
Conclusion
The purpose of the study was to establish the collective influence of income growth rate, gross domestic product, mortgage rate, and inflation rate on the unemployment rate in the United States. Multiple regression analysis reveals that gross domestic product, inflation rate, income growth rate, and mortgage rate have statistically significant effect on the unemployment rate (R2 = 0.117, p = 0.001). Essentially, gross domestic product, inflation rate, income growth rate, and mortgage rate collectively explain 11.7% of the variation in the unemployment rate. To enhance the validity of the findings, the study recommends the use of the recent data and the inclusion of data obtained from diverse countries.
References
Aurangzeb, C., & Asif, K. (2013). Factors effecting unemployment: A cross country analysis. International Journal of Academic Research in Business and Social Sciences, 3(1), 220-230.
Field, A. (2013). Discovering statistics using IBM SPSS statistics. London: SAGE Publication.
Florea, O. (2014). Relationship between inflation and unemployment in Romania, age group 20-24 years. Practical Application of Science, 1(3), 198-203.
Healey, F. (2013). The essentials of statistics: A tool for social research. Belmont. Wadsworth Cengage Learning.
Tunah, H. (2010). The Analysis of Unemployment in Turkey: Some Empirical Evidence Using Co-integration Test. European Journal of Social Sciences, 18(1), 18-38.
Umair, M., & Ullah, R. (2013). Impact of GDP and Inflation on Unemployment Rate: A Study of Pakistan Economy in 2000-2010. International Review of Management and Business Research, 2(2), 388-400.

