Executive Summary
Westfarmers Limited is one of the leading companies in Australia and a major retailer in the country, headquartered in Perth, Western Australia. The company is regarded as the number one private employer in Australia, with a total of two hundred thousand employees across the country. The company realized a net profit of $1.05 billion in the year 2006, making a record history since its establishment. As a way of expanding its operations and potential, Westfarmers acquired Coles Group in 2007 at a cost of A$22 billion, making it the highest take-over in the history of Australian corporate market. Throughout its history, the company has tremendously grown to reputable levels, in terms of performance and a key player on Australia’s Stock Exchange (EzineMark: Westfarmers Limited 2010). It has a wide range of business operations, which include but not limited to supermarkets, office supplies, home improvement and department stores. Other areas are coal mining, chemicals, insurance, industrial and safety products, energy, and fertilizers (Wesfarmers: Reports 2012). Principally, the company’s driving objective is to satisfy its shareholders through profitable returns, from its business operations.
Introduction
Westfarmers has a long business history, spanning almost one hundred years. The company was established in the year 1914, mainly as a famers’ co-operative. During its early years of operating, Westfarmers remained focused on providing specialized services and merchandise to several rural communities, which were located in Southern Australia. Like most companies in Australia and around the world, the company has undergone a series of transformations to reach where it is today. Throughout this journey, Westfarmers has witnessed challenges and successes, which continue to shape its commitment to its mission and vision of satisfying its shareholders (Bert et al. 2010). This report gives a detailed financial report of the company, through an analysis of its financial statements and performance from 2008 to 2011. To achieve this target, certain ratios will be considered in order to understand the firm’s progressive financial performance. Importantly, the report is divided into segments, which are key in explaining trends and financial indicators of the company as it shall be revealed in the analysis of four financial years.

Westfarmers financial analysis in 2008
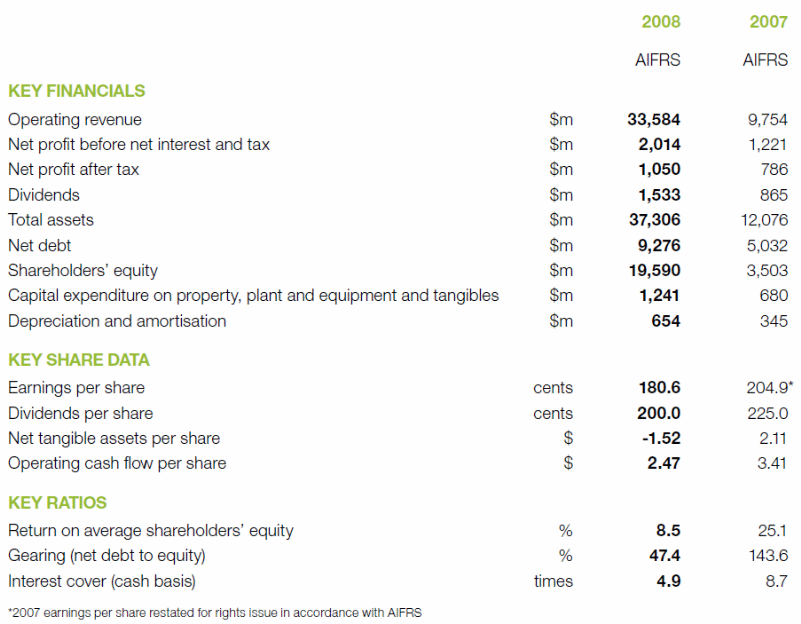
According to Richard Goyder, the company’s managing director, the year 2008 was special to Westfarmers because of the major acquisition it had completed in November 2007. It was a pivotal period for the entire company, including employees, shareholders and all the stakeholders. While giving his remarks, Goyder noted that the financial year was characterized by a wide range of changes and challenges (Wesfarmers: Reports 2012). However, some of the challenges, which were witnessed, were created by the management as a way of positioning the company to continue offering satisfactory returns to the shareholders through various operations. Importantly, the acquisition of Coles Group was completed during 2007/2008 financial year. The group’s operations included food and liquor business, Kmart, Target and Officeworks.
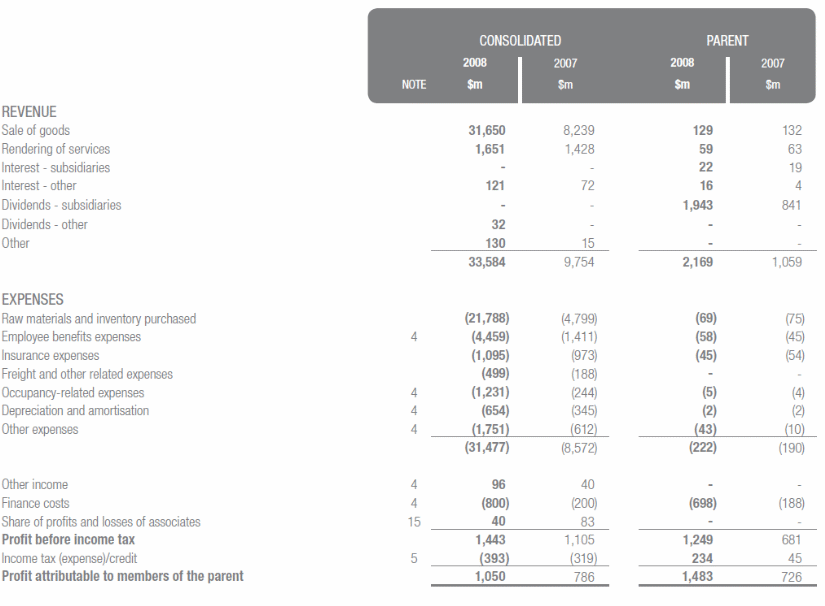
As a result of this expansion, the managing director noted that the company had become the leading private employer, with a total of approximately two hundred thousand employees. The firm undertook a $2.5 billion equity rising, which was mainly aimed at helping it to fund the acquisition of Coles Group and strengthen its balance sheet. The overall profit, after tax and interest for the year 2008 was $ 1.05 billion, up from $786 in the year 2007 (Wesfarmers: Reports 2012). Notably, all the six businesses, owned by the firm recorded increased earnings, which ultimately contributed to the profit that was realized.
Coles Group
The acquisition of Coles Group was undoubtedly one of the best decisions made by the company throughout its history in business. Even though the acquisition of the group was completed several months into the financial year, Westfarmers embarked on a mission of repositioning the group for future expansion. For instance, the company had restructured centralized functions of Coles Group, for the purpose of creating autonomous retail divisions and established several crucial commercial reviews, which included the reviewing of Kmart. Among other reviews, Westfarmers initiated the reduction of the number of employees, appointment of new management, and crafting of a five-year plan and budget. These were imperative measures in ensuring that Coles Group fitted into the operational patterns and standards of Westfarmers.
Due to the company’s commitment towards the acquisition of Coles Group, it was able to complete the integration program much earlier before the financial year closed (Wesfarmers: Reports 2012). By being ahead of the schedule, it was evident that the firm was better placed in improving its services and creating more customer-focused, value-driven operations, which would satisfy the needs of all stakeholders. The 2008 financial results were a clear indicator that the company was in its preliminary stages of transforming the business into a more profitable organization.
Seven months analysis
As noted before, the completion of the acquisition of Coles Group took place after five years into the financial year. This section of the report therefore covers the progress, which was made in the last seven months of the financial year. During that period, Cole’s section had operating revenue of $16.9 billion, which resulted in EBIT of about $454 million. The sections included liquor, supermarkets, fuel, and convenience operations. On the other hand, Officeworks recorded $802 million as total revenue, with EBIT of $36 million (Wesfarmers Reports 2012). It is worth noting that Target was acknowledged for being the best performer, after its total sales rose to $2.2 billion and EBIT value of $223 million. At the end of the year 2008, there were several concerns over the exact reason why Westfarmers had acquired Coles Group. In his report, the Chief Executive Officer clarified that the driving force was to make it a source of value to shareholders for a long period of time. Additionally, the managing director noted that there was need to restructure other sections of the company in order to realize better performance.
Performance across divisions
Although not all sections registered outstanding performance during 2007/2008 financial year, most of them continued to advance to higher levels of performance. All the divisions, which were owned by Wesfarmers before the acquisition of Coles recorded 15% and 16% increase in revenue and profit respectively, before adding interest earned and tax (Wesfarmers: Reports 2012). Among these segments, Bunnings also performed well, recording a 13.9% growth on cash sales, together with a trading profit that increased to 16.8%. Other divisions, which performed well, included the resource division, insurance, industrial and safety, chemical and fertilizer, and energy division. Although the economic situation was tough, the managing director believed that the company’s performance was likely to improve because of attractive prices of exported coal.

Westfarmers financial analysis in 2009
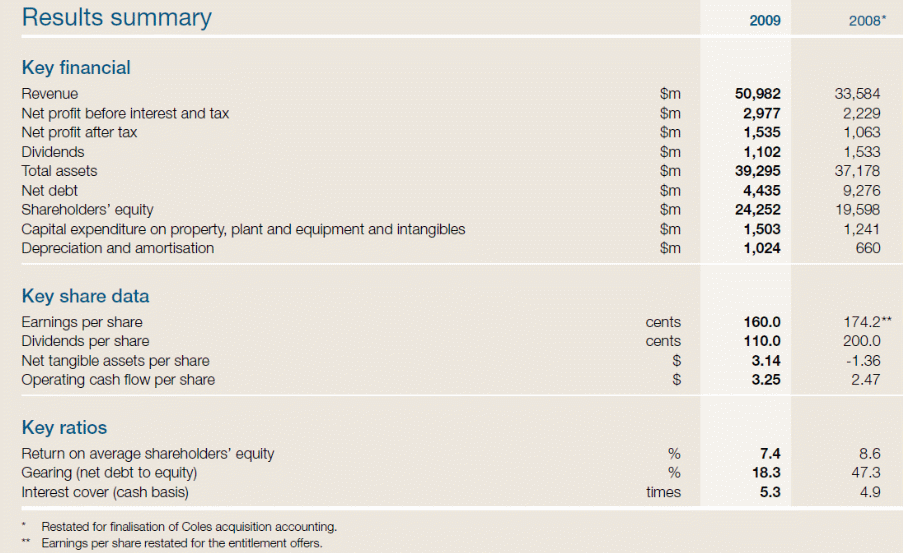
Westfarmers experienced good performance in 2009, as echoed by its senior management. In his review, the director of finance, Terry Bowen noted that cash flow, which was generated from operations rose by 110%, which translated to $3,044 million. It was believed that the achievement was attributed to growth in earnings and excellent management of working capital. Importantly, the net profit of the group increased by 44%, due to high levels of earnings in several divisions like, resources, Target, Bunnings, and Coles. It can also be noted that the acquisition of Coles Group significantly contributed to the development (Wesfarmers: Reports 2012). Besides these operations in various segments of the company, there were other non-trading items, which equally contributed to the overall performance. Moreover, Westfarmers recorded a drop in earnings per share, from $1.74 in 2008 to $1.60 in 2009. In explaining this decline, Terry noted that it was as a result of increased shares on issue. Another drop in returns was witnessed on equity, which decreased from 8.6% to 7.4%.
2009 Cash Flow
According to the financial director of Westfarmers, the firm registered strong cash flow in 2009 as compared to 2008. For instance, the cash flow increased from $210 million to $1,541 million, while cash dividends paid rose from $754 million to $1,066 million. With regard to operations, the company recorded a 110% increment, which was mainly triggered by the increase in earnings and proper management of working capital, especially in various retail businesses (Wesfarmers: Reports 2012).
It is essential to note that the company had a higher capital expenditure value of $1,503 in 2009 as compared to $1,241 million in 2008. This was mainly pegged on the firm’s commitment to promote the growth of every business. Apart from energy, and chemicals and fertilizers, the other divisions had higher capital expenditure. The exception was due to the fact that there were huge expansion projects, which were undertaken in these divisions. Nevertheless, Terry was optimistic that capital expenditure was going to increase because of the renewal of several activities in Coles and completion of various diversion projects (Wesfarmers: Reports 2012). One of the company’s main focuses was to recapitalize its balance sheet, necessitated by poor performance of credit markets, which had been caused by the global financial crisis and exponential downgrading of several market conditions.
Debt management
According to the review done by the director of finance, the company was solely committed to maintaining a strong investment-grade rating by upholding reputable management skills for its cash flow and balance sheet. The year was generally characterized by debt repayment efforts, which saw the net debt fall to $4,435 million. This was quite phenomenal, as it allowed the growth of cash interest cover to 5.3 times from 4.9 times in the previous financial year. Furthermore, Westfarmers Limited managed its equity in several ways. For instance, the company had 1,157 million shares on issue at the end of June in 2009. This comprised of 1,005 million ordinary shares and 152 million of partially protected shares (Wesfarmers: Reports 2012). During that financial year, the total number of shares on issues rose to 358 million. Additionally, the company adopted certain changes in its dividend policy following the escalating effects of the global financial crisis. As a result, the declared amount of dividends was to be based on the firm’s current and projected cash as determined by other factors. The company also announced the final dividend of sixty cents, which was paid at the beginning of October 2009.

Westfarmers financial analysis in 2010
Wesfarmers recorded tremendous gains in 2010, with cash flow increment of 9.3%. As noted by the company’s financial director, the success was attributed to growth in earnings and the firm’s commitment to enhance the management of its working capital (Wesfarmers: Reports 2012).
Financial overview
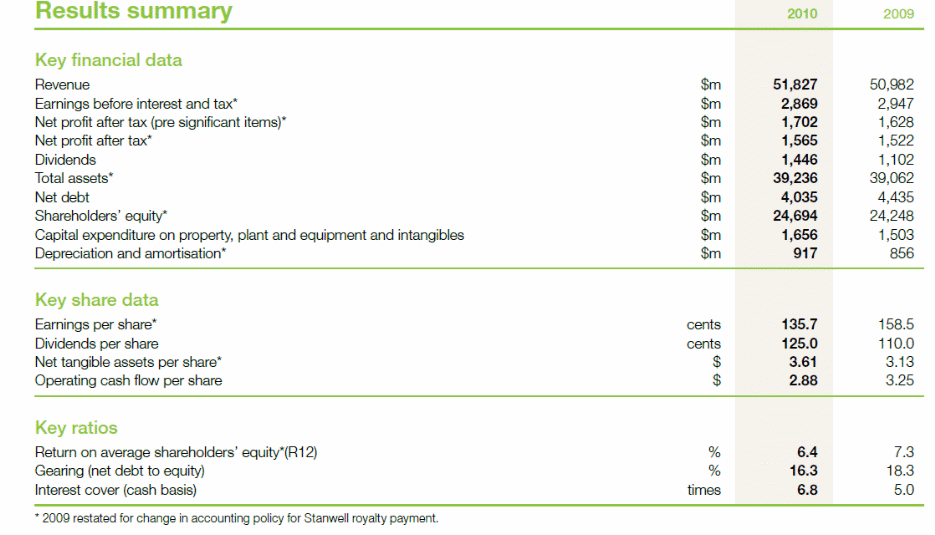
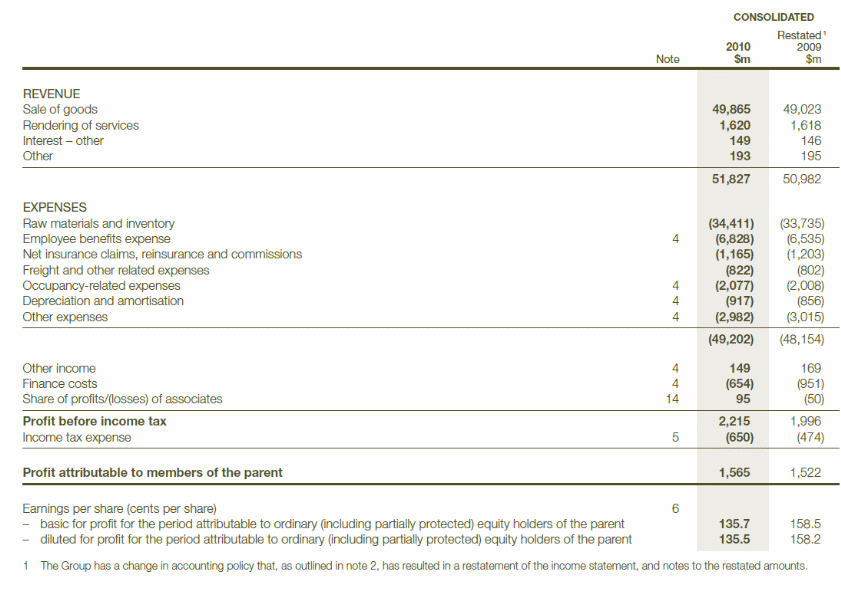
First, the company registered a net profit tax of $1,565, which was higher than the one, which was realized in 2009 by 2.8%. This occurred despite the fact that projections had been made, concerning a drop in earnings from the resources section, mainly because of global economic crisis, which was affecting export prices for coal. Importantly, the group’s retail business was among those, which exhibited appealing results, with a growth of 15.8%. This included performances from different sections like, Bunnings, Target, Coles, Olfficeworks and Kmart. Moreover, the insurance section equally recorded a good performance, with a growth of 34.1%. This was mainly enhanced by the restructuring of businesses and the underwriting of several disciplines. On the other hand, chemicals, energy, and fertilizers registered 75.6% improvement on earnings (Wesfarmers: Reports 2012). This was made possible through full supply of gas, which was resumed in the year 2009, after the disruption of gas supply at Varanus Island. Nevertheless, low earnings were realized in industrial and safety division, with a drop of 2.6%. This was attributed to soft industrial markets, witnessed during early months of the financial year.
In addition, Westfarmers Limited realized a drop in earnings per share from 158.5 cents per share to 135.7 cents. According to the company’s financial director, the drop was as a result of raising equity in January 2009, which in turn increased the number of shares on issue. The impact was further felt on average return on equity, resulting into a 6.4% drop from the previous value (Wesfarmers: Reports 2012).
Cash Flow
Like in the previous years, the company registered strong cash flow generation in 2010, with free cash flow rising to $1,671 million as compared to $1,541, which had been realized in the previous financial year. Moreover, Westfarmers Limited realized an increase in cash flow from operations, which rose by 9.3% to a total of $3,327. The main reason behind this was the significant growth in earnings and improved management of the company’s working capital. Due to an increase in operating cash flow, capital expenditure was supported to $1,656 million (Wesfarmers: Reports 2012). Furthermore, this increase in capital expenditure was due to the acquisition of land and buildings by some divisions of the firm like Coles and Bunnings, as a way of enhancing their store networks around the country. Coles also intensified its efforts to increase its retail infrastructure through investments. For instance, it continued to develop the standards of its stores within supermarkets.
In order to maintain outstanding performance, Westfarmers geared towards improving the management of its capital investment expenditure ahead of depreciation, as a way of promoting its future growth and advancement in business. As noted by Terry, the company had embarked on retail refurbishment, expansion of retail networking and enhancement of necessary requirements to increase the production capacity of Curragh. By June 30, the company’s debt had dropped to $5,353. The Group further had a total of $1,318 million in cash at bank (Wesfarmers: Reports 2012).

Westfarmers financial analysis in 2011
As depicted from the 2011 financial statement, the company’s balance sheet was further strengthened as indicated by the Group’s credit rating.
Financial Overview
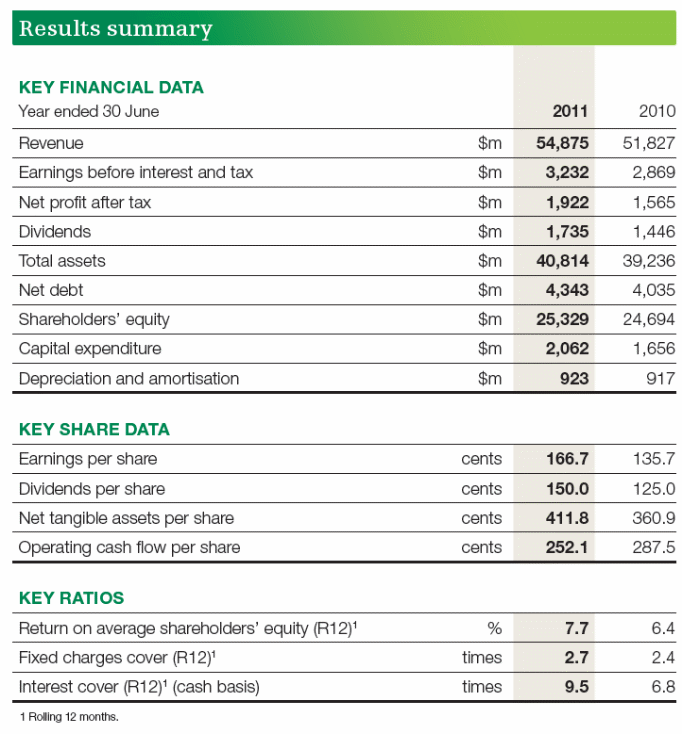
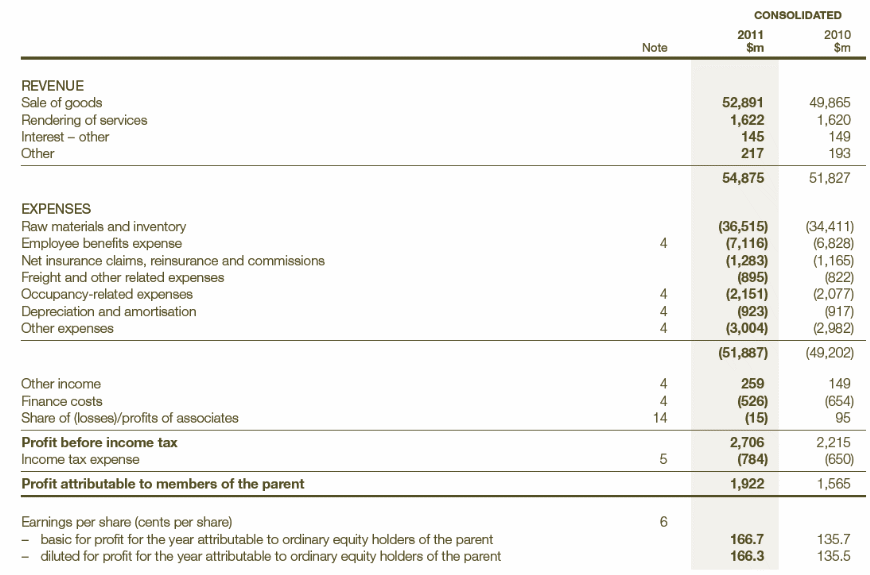
This segment of the report gives an analysis of the company’s performance, in 2011, in which it realized a net profit after tax of $1,922. This represented an increment of 22.8% as compared to 2010. It is worth noting that these pleasing results were achieved even though the group experienced difficult operating conditions, which were mainly experienced in certain divisions. Most of these challenges were linked to natural disasters, which affected Australia and New Zealand, coupled with low consumer confidence. Unlike in 2010, when the company registered a drop in the value of shares, 2011 financial year saw Westfarmers’ value per share rise to 166.7, which was equivalent to an increment of 22.8%. Similarly, the Group realized an increment in average return on equity, which had risen from 6.4% to 7.7% (Wesfarmers: Reports 2012).
Cash Flow
The total cash flow, which was realized from all the group’s operations, was $2,917 million. Even though the firm recorded a solid cash realization of 102.5%, this was down compared to the figure that was reached in 2010. The latter’s success was however based on effective reconstruction of Kmart and Coles divisions.
In the same manner, strong investment by the company was a major boost for its performance in capital expenditure ahead of depreciation, for the purpose of spinning the group’s financial growth. Capital investment also increased to $2,062 due to massive expansion of the firm’s retail network in the country, together with other improvements made in terms of capacity increase at the Bengalla and Curragh coal mines (Wesfarmers: Reports 2012).
According to the company’s financial director, the phase of strong capital investment was expected to rise in 2012 through the improvement of growth and performance of the entire retail network (Wesfarmers: Reports 2012). Additionally, the director was optimistic that the company would complete expansion projects, especially in the resources section. Its expanding business was also targeting the production of ammonium nitrate at Kwinana, even though this was yet to be approved by the company’s board. In terms of free cash flow, the company realized $1,041 million as compared to $1631, which was recorded in 2010. This difference was based on increased working capital and capital investment, as driven by the group’s objectives. Similarly, cash dividends in 2011 rose to $1,557 million from $1,325. Importantly, the firm’s balance sheet was strengthened in 2011 as evidenced from liquidity ratios, together with a higher rating of the group’s credit (Wesfarmers: Reports 2012).
Conclusion and recommendations
From the above report, it is evident that Westfarmers Limited has had a fascinating performance for the last four years. Due to its growth, it has become the leading private employer in Australia with almost two hundred employees on the payroll (EzineMark Westfarmers Limited 2010). Of great significance has been its commitment to satisfying shareholders and other stakeholders. Acquisition of Coles Group by Wesfarmers has also been applauded for creating opportunities through the expansion of the company’s scope of products and retail network. Due to the volatile nature of markets and the looming economic crisis, it is important for the company to maintain a strong balance sheet and explore more opportunities, which can be a source of value to its stakeholders.
References
Bert et al. 2010, Accounting: Business Reporting for Decision Making, John Wiley & Sons, Melbourne.
EzineMark: Wesfarmers Limited 2010, Web.
Wesfarmers: Reports 2012, Web.
Appendix
Calculations
Return on Equity = Net Income
Shareholders’ Equity
In 2008, ROE = 1,050/19,590 = 0.054
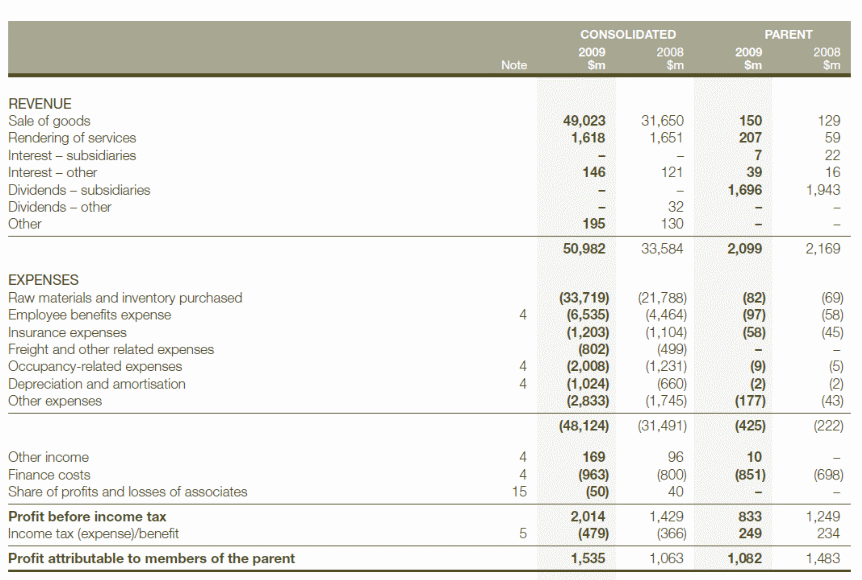
In 2009, ROE = 1,535/24,252 = 0.063
In 2010, ROE = 1,565/24,694 = 0.0633
In 2011, ROE = 1,922/25,329 = 0.076
Return on Assets = Net Income
Total Assets
In 2008, ROA = 1,050/37,306 = 0.028
In 2009, ROA = 1,535/39,295 = 0.039
In 2010, ROA = 1,565/39,236 = 0.040
In 2011, ROA = 1,922/40,814 = 0.047
Asset Turn Over = Revenue
Assets
2008 ATO = 33,584/37,306 = 0.900
2009 ATO = 50,982/39,295 = 1.297
2010 ATO = 51,827/39,236 = 1.320
2011 ATO = 54,875/40,814 = 1.344
Stock Turnover = Cost of Sales
Average Stock Held
2008 Stock Turnover = 31, 650/1,533 = 20.64
2009 Stock Turnover = 49,023/1,102 = 44.48
2010 Stock Turnover = 49,865/ 1,446 = 34.48
2011 Stock Turnover = 52,891/1,735 = 30.48
