Financial Overview of an Australian Company David Jones Ltd.

Executive summary

The report is going to present a financial overview of an Australian company named as David Jones Ltd. The selected company is an excellent mega retailer that had already expanded its retailing operations beyond than Australia including USA and UK. The company’s financial performance has proved efficiency and excellence from 2003 for which a well-built business model had been implemented to gain favourable investment return.

Here, as an assistant analyst of an investment bank, a five year financial performance analysis has been prepared on the basis of different relevant measurement data as sales, gross profit, EBIT, NPAT, current assets and liabilities, fixed assets and liabilities etc. for fiscal year of 2004, 2005, 2006, 2007 and 2008. After focusing on initial company description, study objectives, analysis methods and preparation limitations, an actual financial analysis will be conducted to show the company’s several ratios, common and activity statement. Liquidity analysis will emphasize upon solvency, growth, profitability, du point factors of the company. Additionally, the report will also show a comparative performance focus with its major competitors and a paired comparison of USA chain with UK and other global business turnover.

Introduction

David Jones Ltd. or DJs is an Australia based retailing company, whose major business is to run national-wide department store chain. The company has established by David Jones in 1838, which is renowned as the world’s oldest department store running upon its actual name. Today, it occupies 37 branches placed mostly in Australian regions and these are retailing cosmetics, home products, fashion, and other commodities. This store-based company had started its glorious journey through several ups and downs by passing the remarkable years, for example, 1825, 1835, 1838, 1840, 1856, 1887, 1906, 1927, 1938, 1959, 1980, 1990 and 1995 specially when the company declared $800 billion of public float of a combined David Jones and John Martin retailing.

It is also recognized for offering discounts to its partners. It has battered away from the general pattern of department stores to specialized ones and suburban shopping centres. Like any other mega ventures, David Jones has been hurt severely by global monetary recession through decreased sales of 6.4% to $1061.2 million in the 1st part of 2009, more than Myer. It is a well-known company for branding a black-on-white hunting tooth pattern as one of the most popular organizational dignity in Australia.

A government based jurisdiction declared it as one of the national top 10 preferred trademarks in 2006. From 2001, Megan Gale had been endorsed as a public figure of the company while today such celebrity endorsement also involves Kim Cattrall and Liz Hurley. Key brand recognition involves style, quality, and fashion. It has made several successful acquisitions and all stores are situated in mega retail grounds and shopping centres. In 2007, the company gratified its store location selection from a viewpoint of “low risk, high value locations”. Other important aspects of the company are-

  • Employees- Corporate personnel are committed to deliver NPAT and dividend growth especially during the recessionary period.
  • Dividends- Corporate management team is being liable to maintain upward dividend growth.

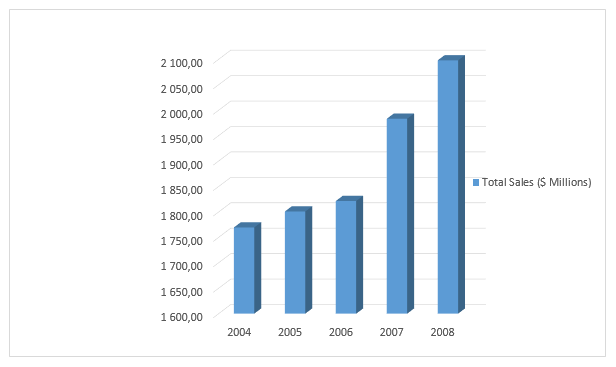
The following figure demonstrates the total sales of David Jones for last five years. Here, the total sales has increased each year, for example, in 2004, total sales was $ 1769.5 millions, which enhanced up to $2098 millions within the fiscal year 2008.

Five Years Sales of David Jones Ltd.
Figure I: Five Years Sales of David Jones Ltd.

Purpose

Several motives for conducting this study are as below-

  • Analyzing the company’s ROA, ROE and profit margin situations to measure the net return on investment, and corporate capability to utilize its funds, total and net profitability.
  • Estimation of different kinds of liquidity ratios to measure the firm’s ability to meet financial liabilities and working capital;
  • Estimation of various leverage ratios to show borrowed funds, leverages, payment of interest, lease payment analysis etc.
  • Estimation of activity ratios to understand inventory, plant and equipment, and assets effectiveness;
  • Understand the effectiveness of corporate investment in relation to the neighbouring competitors.

Methodology: – Information is being collected from secondary sources involving internet, newspapers, articles, international business reports and journals and books of financial management etc.

Limitations: – Several limitations have been confronted the research work. Some most important are-

  • Restriction of conducting primary data.
  • Limited time of analysis.
  • Complicated computation procedure.
  • Complex coordination with the home company and competitor’s performance analysis.
  • Expanded computation planning.
  • Clutter of unnecessary and indirect information.

Financial Analysis

Financial analysis of the David Jones Ltd Australia is an aid to evaluate their weight and the operating performance. General financial analysis for any company involves in- profitability ratios, asset utilisation ratios, liquidity ratios, debt utilisation ratios, common size statements, common size statement, activity statement, short term activity ratios, long term activity ratios, liquidity analysis, long term liquidity ratios, solvency analysis, growth analysis, profitability analysis, five factor Dupont model and prospective analysis. These are the assessment tools for current market position, cash balance at the end of the year, financial and investing activates in conjunction with yearly operations.

Ratio analysis

According to Block & Hirt (2009, p. 55-57), ratio analysis segmented into four major categories- profitability ratios, asset utilisation ratios, liquidity ratios and debt utilisation ratios. In an aggregate form, these four ratios are divided into thirteen stages. Description of these ratios of the David Jones Ltd Australia is analysed bellow sequentially.

Profitability ratios

The profitability ratios of DJL1 has calculated in the following table presented numerical fluctuation from year to year due to change in net income, sales revenues, add or deduction of total assets, shareholders’ equity, amount of debt, return on asset and investment.

Table: Profitability ratios.

Profitability ratios David Jones Ltd. 2005
(David Jones 2005, p. 11, 31, 52-54, 61-74, 84-102)
David Jones Ltd. 2006
(2006 p. 6-9, 52-83, 93-114)
David Jones Ltd. 2007
(David Jones 2008, p. 60-64, 111-115)
David Jones Ltd. 2008
(David Jones 2008, p. 60-64, 111-115)
Myer Group Finance Ltd. 2008
(Myer 2008, p. 4, 8-11, 13-30, 32-49)
Profit margin
= (Net income/Sales)
(77,862 / 1,800,796)
= 0.04324
= 4.324 %
(81,120 / 1,821,560)
= 0.0445
= 4.45 %
(109,516 / 1,983,220)
= 0.05522
= 5.522 %
(147,286 /2 ,097,999)
= 0.07020
= 7.02%
(27,839,699
/ 2,940,331)
= 9.4682 %
Return on Asset (Investment)
= (Net income/Total Assets)
(77,862 / 1,080,557)
= 0.07206
= 7.206 %
(81,120 / 1,139,568)
= 0.5812
= 58.12 %
(109,516 / 1,634,643)
= 0.066997
= 6.7997 %
(147,286 / 1,529,645)
= 0.0962
= 9.62 %
(27,839,69 / 248,361,114)
= 0.1121
= 11.21 %
Return on Equity:

a) Return on Equity = (Net income/Shareholders’ Equity)

b) Return on Equity = {Return on Asset (Investment)/ (1− Debt/Assets)}

a)
(77,862 / 400,762)
= 0.1943
= 19.43 %b) {0.07206 / (1− 0.00)}
= 0.07206
= 7.206 %
a) (81,120 / 362,719)
= 0.2236
= 22.36 %b) {0.5812 / (1− 0.02583)}
= 0.5966
= 59.66 %
a) (109,516 / 513,296)
= 0.21336
= 21.336 %b) {0.066997 / (1− 0.323)}
= 0.09896
= 9.896 %
a) (147,286 / 619,790)
= 0.2376
= 23.76 %b) {0.0962 /
(1−0.153)}
= 0.1135
= 11.35 %
a) (27,839,699/ 87,723)
= 317.359 %

DJL’s return on equity has been evidenced 22.36% in 2005, 21.336% in 2006, 23.76% in 2007, and 19.43% in 2008. Due to the DJL’s profitability has intended with the aim to achieve a victorious balance among the fixed and variable components to drive short-term annual results, and more emphasis has adopted to the longer-term profitability of the DJL as well as sustainable shareholder value, it has gradually increased sales outlets. Therefore, the profitability has increased, but for global financial down turn it has decreased in 2008.

Asset utilisation ratios

The changes of asset utilisation ratios of the David Jones Ltd needs to fall back on receivables on credit sales both of daily basis and annual, amount of receivables, fixed assets during the year and collection of inventories. Amount of these forces amended according to requirement of the manufacturer, suppliers and of the consumers. Modified demand of these three parties play behind amendment of following asset utilisation ratios annually.

Asset utilisation ratios David Jones Ltd. 2005
(David Jones 2005, p. 11, 31, 52-54, 61-74, 84-102)
David Jones Ltd. 2006
(David Jones 2006, p. 6-9, 52-83, 93-114)
David Jones Ltd. 2007
(David Jones 2008, p. 5-11, 60-64)
David Jones Ltd. 2008
(David Jones 2008, p. 5-11, 60-64)
Myer Group Finance Ltd. 2008
Receivable turnover
= Sales(Credit)/Receivables
(243,011 / 52,736)
= 4.608 times
(34,147 / 400,791)
= 0.0852 times
(265,972 / 407,187)
= 0.6532 times
(274,608 / 414,980)
= 0.6617
= 66.17 times
(/)
=
Average collection period = (Accounts receivables/ Average daily credit sales)
Workings:
Average daily credit sales = (Credit sales/360 days)
(52,736 / 675.0305)
= 78.12 daysWorkings:
= (243,011 / 360)
= $ 675.0305
(34,147 / 94.85)
= 360.01 daysWorkings:
(34,147 / 360)
= $ 94.85
(407,18 / 0.9489)
= 42910.74 days
Workings:
(265,972 / 280,281)
= $ 0.9489
(414,980 / 1152.7222)
= 36.00 daysWorkings:
(414,980 / 360)
= $ 1152.7222
(/)
=
Inventory turnover
= (Sales/Inventory)
(1,799,123 / 289,198)
= 6.2211 times
(1,821,56 / 273,728)
= 6.6546 times
(1,983,220 / 280,281)
= 7.0758 times
(2,097,999 / 257,288)
= 8.1542 times
(/)
=
Fixed asset turnover
= (Sales/Fixed assets)
(1,799,123 / 285,103)
= 6.3104 times
(1,821,560 / 252,404)
= 7.2168 times
(1,983,220 / 782,340)
= 2.535 times
(2,097,999 / 782,340)
= 2.6816 times
(/)
=
Total asset turnover
= (Sales/ Total assets)
(1,799,123 / 779,335)
= 2.3085 times
(1,821,560 / 1,135,679)
= 1.6039 times
(1,983,220 / 1,529,645)
= 3.744 times
(2,097,999 / 1,529,645)
= 1.3715 times
(2,940,331/ 248,361,114)
=0.01184 times

The total asset utilisation ratio is 3.744 in 2007 and 1.3715 in 2008. Due to overinvestment in the total assets of DJL in context of its sales in 2008, it has evidenced lower asset utilisation ratio.

Liquidity ratios

The liquidity is the measure of firm’s cash balances during a year. It composes of three prime forces- current assets, current liabilities, and inventories. Market strength and weakness of the company constructed through following numerical changes.

Liquidity ratios David Jones Ltd. 2005 David Jones Ltd. 2006 David Jones Ltd. 2007 David Jones Ltd. 2008 Myer Group Finance Ltd. 2008
Current ratio
= (Current assets/Current liabilities)
(494,232 / 275,840)
= 1.7917
(883,275 / 754,035)
= 1.1714
(747,305 /603,533)
= 1.2382
(747,305 / 603,533)
= 1.2382
(1,197,126/ 1,331,657)
= 0.89897
Quick ratio
= {(Current assets − Inventory)/ Current liabilities}
{(494,232 − 289,198) / 275,840}
= 0.7433
{(883,275 − 273,728) / 754,035}
= 0.8084
{(747,305- 280,281) / 603,533}
= 0.7738
{(747,305 − 257,288) / 603,533}
= 0.8119
{(1,197,126 − 0) / 1,331,657}
= 0.89897

The current ratio of DJL ranges commencing 1.7917 in 2005 to 1.2382 in 2008. As DJL is in some extent worse position in terms of liquidity, it has reduced in 2008. However, the deteriorating liquidity in 2008 has supposed to investigate to discover if the pointed decrease indicates some unexpected circumstances for DJL.

Debt utilisation ratios

Debt is the loan amount of a firm. Debt utilisation ratios of the David Jones Ltd included- amount of total loan, total assets, income before interest and taxes, amount of interests, lease payments and fixed rental charges. These forces do not operate at same amount yearly so that ratios under debt utilisations alter annually.

Debt utilisation ratios David Jones Ltd. 2005 David Jones Ltd. 2006 David Jones Ltd. 2007 David Jones Ltd. 2008 Myer Group Finance Ltd. 2008
Debt to total assets
= (Total assets/Total debt)
(779,335 / 400,762)
= 1.9446 %
(1,135,679 / 236,712)
= 4.7977 %
(1,634,643 / 265,972)
= 6.1459 %
(1,529,645/ 6,263)
= 244.2352 %
(248,361,114 / 225,000,000)
= 1.1038 %
Times interest earned
= (Income before interest and taxes or Operating income (EBIT)/Interest)
(111,716 / 1,697)
= 65.8315 times
(119,650 / 4,165)
= 28.7275 times
(108,822 / 3,309)
= 32.8867 times
(209,615 / 6,891)
= 30.41866 times
(− 26,795/ )
=
Fixed charge coverage
= (Income before fixed charges and taxes/Fixed charges)
Workings:
Income before fixed charges and taxes
= (Income before interest and taxes − Lease payments)
(111,716 / 109494)
= 1.0203 timesWorking:(111,716 − 2,222)
= $ 109494 million
(26512 / 24,291)
= 1.0914 timesWorkings:
(119,650 − 93,138)
= $ 26512 million
(108,822 / 42212)
= 2.578 timesWorkings:
(108,822 – 66,610)
= $ 42212 million
(209,615 / 38709)
= 5.4152 timesWorkings:
(209,615−170,906)
= $ 38709 million
(/)
=

The debt utilisation ratio of DJL has evidenced 1.0203 times in 2005 and 5.4152 times in 2008. Due to recessionary impact, debt utilisation ratio has increased highly which has hampered the profitability.

Common size statements

Common size statements include two financial statements- income statement and the balance sheet. Income statement is the adjustments of annual revenue and expenditures. On the other hand, balance of the David Jones Ltd Australia presents scenarios of assets and liabilities at the 31st December at the end of the year 2008. (David Jones 2008, pp. 60-64)

David Jones Ltd (Australia) Income statement End of the year 31st December 2008.

Particulars Amount ($ in million)
Net sales
Less: Cost of goods sold
Gross profit
Add: Other income
Less: Employee benefit expenses
Less: Lease and occupancy expenses
Less: Depreciation expenses
Less: Expense for financing activities
Less: Selling and administrative expenses
Less: Others
Operating profit (EBIT)
Less: Interest expense
Less: Loss
Net income before taxes (EBT)
Less: Taxes
Net income
2,097,999
1268227
829,772
107,517
347,460170,906

41,544
41,178

88467

38,119
209,615
−
−
209,615

62,329
147,286

David Jones Ltd (Australia) Balance sheet End of the year 31st December 2008.

Particulars Amount ($ in million)
Assets:
Cash
Add: Financial assets
Add: Accounts receivable
Add: Inventory
Add: Others
Total current assets
Add: Net plant and equipment
Add: Non-current financial assets
Add: Intangible assets
Net assets
Add: Deferred income taxes
Add: Other non-current assets
Total assetsLiabilities and Stockholders’ equity:
Accounts payable
Add: Notes payable
Add: Current tax liabilities
Add: Provisions
Add: Financial liabilities
Add: Other liabilities
Total current liabilities
Add: Interest liabilities
Add: Provisions
Add: Financial liabilities
Add: Others
Total liabilities
Add: Common stock
Add: Retain earnings
Add: Accumulated losses
Total liabilities and stockholders’ equity
66,564
704
414,980
257,288
7,769
747,305
670,687798

36,910

73,910
35
1,529,645

274,608
242,360
22,997
53,731
1,009
8,828
603,533
270,000
7,904
695
27,723
909,855
455,341
35,460
128,989
619,790

Activity statements

White & Sondhi (2002, p. 91) argued that statements of activities included activities of operating, investing and financing. Following is the chart of activity statements of the David Jones Ltd Australia.

David Jones Ltd (Australia) Cash flows statement End of the year 31st December 2008

Particulars Amount ($ in million) Amount ($ in million)
Cash flows from operating activities:

Adjustments to reconcile cash flow from operating activities:
Add: Depreciation
Less: Increase of account receivables
Less: Increase of inventory
Add: Interest received
Less: Income tax paid
Less: Decrease
of accrued expenses
Net cash provided from operating activities

Cash flows from investing activities:
Less: increase of software expenses payments
Less: increase of plant and equipment payments
Less: Interest rate swap payments
Less: Acquisition payment
Add: Sale of property
Net cash used in investing activities

Cash flows from financing activities:

Add: Receive loan payments from employee share plan
Less: Dividend paid on ordinary share
Less: Interest payment
Less: Reconcile long-term borrowings
Add: Long-term borrowings proceeds
Net cash used in financing activities

Net cash balance at the beginning of the year
Net cash balance at the end of the year

−
2,378,3462,123,152
56,967
68,919
41,279

338

73,289

−

−
42,000

97

85,204

1,333
180,000

−

201,963

(31,627)

(266,440)

161,308

65,204

Short-term activity ratios

Annual costs of goods sold and inventories have estimated annual turnovers. Consumer demands, fluctuation of raw martial prices, manufacturing costs are causes of inventory turn over transformation.

Short term activity ratios David Jones Ltd. 2005 David Jones Ltd. 2006 David Jones Ltd. 2007 David Jones Ltd. 2008 Myer Group Finance Ltd. 2008
Inventory turn over
= (Costs of goods sold/Inventory)
(1,136,298/289,198)
= 3.9291 times
(1,115,660/273,728)
= 4.0758 times
(1,203,374/ 280,281)
= 4.2935 times
(1268227/257,288)
= 4.9292 times
(/)
= times

Long-term activity ratios

Changes of credit sales, account receivables, total sales, and total assets have transformed long-term activity turnovers of the David Jones Ltd.

Long term activity ratios David Jones Ltd. 2005 David Jones Ltd. 2006 David Jones Ltd. 2007 David Jones Ltd. 2008 Myer Group Finance Ltd. 2008
Account receivable turnover
= (Sales on credit/Account receivable)
(243,011 / 52,736)
= 4.608 times
(34,147 / 400,791)
= 0.0852 times
(265,972 / 407,187)
= 0.6532 times
(274,608 / 414,980)
= 0.6617
times
(/)
=
Fixed assets turnover
= (Sales/Fixed assets)
(1,799,123 / 285,103)
= 6.3104 times
(1,821,560 / 252,404)
= 7.2168 times
(1,821,560 / 252,404)
= 7.2168 times
(1,983,220 / 782,340)
= 2.535 times
(/)
=
Total asset turnover
= (Sales/Total asset)
(1,799,123 / 779,335)
= 2.3085 times
(1,821,560 / 1,135,679)
= 1.6039 times
(1,821,560 / ,135,679)
= 1.6039 times
(1,983,220 / 1,529,645)
= 3.744 times
(/)
=

The total asset turnover ratio is 2.309 in 2005 and 3.744 in 2008. Capacity to borrow to pay off current obligations has increased. The financial report 2008 has demonstrated that DJL has unused financing in its bank as well as stocks. The global credit crush has produced this dilemma.

Liquidity analysis

Transformation of the liquidity ratios is already showed in the ratio analysis part of the paper. Those are the vital forces of liquidity changes and go over here due to the assignment requirement.

Long term liquidity ratios David Jones Ltd. 2005 David Jones Ltd. 2006 David Jones Ltd. 2007 David Jones Ltd. 2008 Myer Group Finance Ltd. 2008
Account receivable turnover
= (Sales on credit/Account receivable)
(243,011/52,736)
= 4.608 times
(34,147/400,791)
= 0.0852 times
(265,972 / 407,187)
= 0.6532 times
(274,608/414,980)
= 0.6617
= 66.17 times
(/)
=
Fixed assets turnover
= (Sales/Fixed assets)
(1,799,123/285,103)
= 6.3104 times
(1,821,560/252,404)
= 7.2168 times
(1,983,220/ 782,340)
= 2.535 times
(1,983,220 / 782,340)
= 2.535 times
(/)
=
Total asset turnover
= (Sales/Total asset)
(1,799,123/779,335)
= 2.3085 times
(1,821,560/1,135,679)
= 1.6039 times
(1,983,220/1,529,645)
= 3.744 times
(1,983,220 / 1,529,645)
= 3.744 times
(/)
=

Solvency analyses

A comparison of company solvency has drawn in solvency analysis. Allied forces of this analysis- asset, liabilities, interest affiliated with debt, total equity, cash balance, or cash in hand, rent expenses, earning before interest and taxes and principal payments amended solvency figure of company annually.

Anon (2009, p. 1-4) mentioned that solvency analysis composed of following seven solvency ratios which used to prove whether the company is solvent or not.

Solvency analyses David Jones Ltd. 2005 David Jones Ltd. 2006 David Jones Ltd. 2007 David Jones Ltd. 2008 Myer Group Finance Ltd. 2008
Debt to assets = (Total liabilities / Total assets) (779,335 / 400,762)
= 1.9446 %
(778,326 / 1,135,679)
= 0.6853 %
(1,121,347 / 1,634,643)
= 0.686 %
(909,855 / 1,529,645)
= 0.5948 %
Debt to equity = (Total liabilities / Total equity) (303,476 / 475,859)
= 0.6377
= 63.77 %
(778,326 / 357,353)
= 2.1780
= 217.8 %
(1,121,347 / 513,296)
= 218.46 %
(909,855 / 619,790)
= 146.800 %
Capitalization ratio = {Interest bearing debt / (Interest bearing debt + Total equity)} {1,697 /(1,697 + 475,859)}
= 0.0036
= 0.36 %
{4,165 / (4,165 + 357,353)}
= 0.0115
= 1.15 %
{350,000 / (350,000 + 513,296)}
= 0.4054
= 40.54 %
{270,000 / (270,000 + 619,790)}
= 0.3034
= 30.34 %
Interest coverage ratio (accrual basis) = (EBIT / Interest expense) (111,716 / 1,697)
= 65.83 %
(119,650 / 4,165)
= 28.73 %
(108,822 / 3,309)
= 3.022 %
(149,543 / 6,891)
= 21.701 %
(/)
Cash interest coverage (cash basis) = {(Cash flows from operations + cash interest paid + cash tax paid) / Cash interest paid)} {(113,304+1,697+37,154) / 1,697}
= 89.66 %
{(121,738 + 40,380) / 4,165}
= 38.92 %
{(197,696 + 3,309) / ( 44,303 + 3,309)}
= 4.22 %
{(201,963 + 6,891) / ( 68,919 + 6,891)}
= 2.755 %
{(+) / (+)}
Target at a specific expense = {(EBIT + Rent expense) / (Interest expense + Rent expense)} {(111,716+85,189)/(1,697+85,189)}
= 2.2662 %
{(119,650 + 98,309)/( 4,165 + 98,309)
=2.127 %
(108,822 + 7,511) / (3,309 + 7,511)}
= 10.75 %
(149,543 + 7,394) / (6,891 + 7,394)}
= 10.986 %
{(+) / (+)}
Target at principal on debt that is due = {EBIT / (interest expense + principal payments)} {111,716/(1,697+85,189)}

= 1.2858 %

{119,650/(4,165 + 24,572)}
= 4.1636 %
{108,822 / (3,309 + 68,942)}
= 1.506 %
{149,543 / (6,891 + 74,004)}
= 1.849 %
{/ (+)}
=

Growth analyses

Growth analysis presented recent market position of firm by means of outstanding market shares, retain earnings, profit margin and asset turnover. Magnification or deduction of these factors strengthen or weaken growth of the firms.

Prospective analysis of this company has diverse into two broad categories- financial statement forecasting and the ways of managerial decision-making and these two forms of prospective analysis demonstrated both present and future prospect of the firm.

Growth analyses David Jones Ltd. 2005 David Jones Ltd. 2006 David Jones Ltd. 2007 David Jones Ltd. 2008 Myer Group Finance Ltd. 2008
g*= {ROE*Retention Ratio (RR)} (0.1912*0.70)
= 0.13384
= 13.384 %
(0.3075*0.70)
= 0.21525
= 21.525 %
(0.21336*0.70)
= 0.1494
= 14.94 %
g* = {ROE *(1–Dividend Payout Ratio)} {0.1912*(1 −0.30)}
= 0.13384
= 13.384 %
{0.3075*(1 – 0.30)}
= 0.21525
= 21.525 %
{0.21336 *(1 – 0.30)}
= 0.1494
= 14.94 %
g* = (Profit Margin *RR *Asset Turnover *EM) (0.04324*0.70*2.3085*2.6963)
= 0.1884
= 18.84 %
(0.0445*0.70*3.1310)
= 0.0975
= 9.75 %
(0.05522* 0.70*0.066997*)

Profitability analyses

As said in the ratio analysis parts of the paper, profitability analyses has raised and fall for the two companies annually and these measurements showed in the following table.

Profitability analysis included profit and sales turn over ratios. Profitability analysis and managerial efficiency evaluation from view point of asset employment, following are the ratios those have presented recent profitability of David Jones and its Competitor Myer Group. Return on asset percentages estimated the efficiency of asset utilisation. Calculation of return on common shareholders’ equity is comparing the data, how financial leverage harmonizes to common shareholders’ equity.

Profitability ratios David Jones Ltd. 2005 David Jones Ltd. 2006 David Jones Ltd. 2007 David Jones Ltd. 2008 Myer Group Finance Ltd. 2008
Profit margin
= (Net income/Sales)
(77,862/1,800,796)
= 0.04324
= 4.324 %
(81,120/1,821,560)
= 0.0445
= 4.45 %
(109,516/1,983,220)
= 0.05522
= 5.522 %
(147,286/2,097,999)
= 0.07020
= 7.02%
(27,839,699
/ 2,940,331)
= 9.4682 %
Return on Asset (Investment)
= (Net income/Total Assets)
(77,862/1,080,557)
= 0.07206
= 7.206 %
(81,120/1,139,568)
= 0.0712
= 7.12 %
(109,516/1,634,643)
= 0.066997
= 6.7997 %
(147,286/1,529,645)
= 0.0962
= 9.62 %
(27,839,69 / 248,361,114)
= 0.1121
= 11.21 %
Return on Equity:

a Return on Equity = (Net income/Shareholders’ Equity)

b Return on Equity = {Return on Asset (Investment)/ (1− Debt/Assets)}

a) (77,862/ 400,762)
= 0.1943
= 19.43 %b) {0.07206/(1− 0.00)}
= 0.07206
= 7.206 %
a) (81,120/362,719)
= 0.2236
= 22.36 %b) {0.5812/(1− 0.02583)}
= 0.5966
= 59.66 %
a) (109,516/513,296)
= 0.21336
= 21.336 %b) {0.066997/(1− 0.323)}
= 0.09896
= 9.896 %
a) (147,286/619,790)
= 0.2376
= 23.76 %b) {0.0962/ (1−0.153)}
= 0.1135
= 11.35 %
a)
(27,839,699/ 87,723)
= 317.359 %

Five factor Du point model

Five factors Dupont model has included- operating profit or EBIT, total sales, interest expenses, tax payments, outstanding share in market. These forces estimated annual return of following Dupont’s five factor ratios. For the David Jones Ltd return and payment of these forces are not same during different year and therefore ratios under these forces has transformed annually.

Five factor Dupont model David Jones Ltd. 2005 David Jones Ltd. 2006 David Jones Ltd. 2007 David Jones Ltd. 2008 Myer Group Finance Ltd. 2008
Operating Profit Margin (OPM)
= (EBIT á Net sales)
(111,716/1,800,796)
= 0.0620
= 6.20 %
(119,650/1,821,560)
= 0.0657
= 6.57 %
(108,822 / 1,983,220)
= 0.05487
= 5.487 %
(209,615 / 2,097,999)
= 0.0999
= 9.99 %
Total Asset Turnover (TAT)
= (Net sales áTotal assets)
(1,800,796/1,080,557)
= 1.6665
times
(1,821,560/1,135,679)
= 1.604 times
(1,983,220 / 1,634,643)
= 1.213 times
(2,097,999 / 1,529,645)
= 1.3715 times
Interest Expense Ratio (IE)
= (Interest expense áTotal assets)
(1,697/1,080,557)
= 0.001570
= 0.1570 %
(4,165 / 1,135,679)
= 0.00367
= 0.367 %
(3,309 / 1,634,643)
= 0.002024
= 0.2024 %
(6,891 / 1,529,645)
= 0.004505
= 0.4505 %
Tax Retention Rate (TR)
= [1.00 − (Income Taxes ÷Net income before tax)]
[1 − (33,854/111,716)]
= 0.697
= 69.7 %
[1 – (4,165/121,500)]
= 0.9657
= 96.57 %
[1 – (3,309 / 108,822)]
= 0.9696
= 96.96 %
[1 – (6,891 / 209,615)]
= 0.9671
= 96.71 %
Equity Multiplier (EM)
= (Total assets á Common equity)
(1,080,557/400,762)
= 2.6963 times
(1,135,679/362,719)
= 3.1310 times
(1,634,643 / 392,496)
= 4.1647 times
(1,529,645 / 455,341)
= 3.3593 times
Return on Equity (ROE) = [{(OPM *TAT) – IE}*EM *TR] [{(0.0620*1.6665) − 0.001570}* 2.6963*0.697]
= 0.1912
= 19.12 %
[{(0.0657*1.604) – 0.00367}*3.1310*0.9657]
= 0.3075
= 30.75 %
[{(0.05487*1.213) – 0.002024}* 4.1647*0.9696]
= 0.2606
26.06 %
[{(0.0999*1.3715) – 0.004505}*3.3593*0.9671]
= 0.43048
= 43.048 %

Source: Mangiero (2004, p. 5) and Annual reports

The Return on Equity (ROI) of DJL has presented 19.12% to 43.048% for the period 2008. The sustainable growth model of DJL has evidenced that when DJL’s earnings growth has dramatically increased for growth expected.

Competitor Analysis

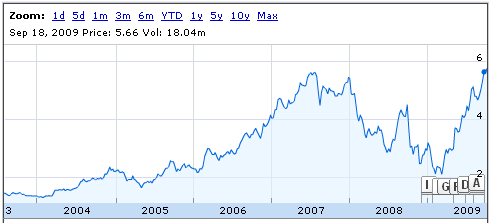
The basic chart of the David Jones shows that its share price had decreased for recession but this situation has been changing from the begging of the fiscal year 2009.

Basic Chart of David Jones Ltd.
Figure II: Basic Chart of David Jones Ltd.

For accessing competition with David Jones, there are several factors have to be analysed and these are sales, profitability, value services, and financial ratios. This company is the market leader of Australian market but it has many direct and indirect competitors, among them Myer Group is the major competitor and Kmart, Target, Bunnings, Big W, Dick Smith, Harvey Norman Holdings and Woolworths Limited are the minor competitors of this company. One of the major competitor Target Australia has established in 1925, which became Target Australia Pty Ltd in 1973 and for several merger and acquisition, in 2006 the group name changed to Coles Group Ltd. Now it has more than 283 stores all over the world.

Porter (2004, p. 85) argued that to create competitive advantages a firm has to rely on generic competitive strategies. He further added that a firm should apply only one strategy among three strategies those are cost leadership, differentiation and focus strategy. David Jones always considers the shareholders well fare to adopt strategies, which reduces the risk of new competitors. However, many other national and international grocery or retailer can become a strong competitor, such as Coach Inc, Ben Sherman, Tesco, Sainsbury, Asda, The Body Shop and so on.

Conclusion

The main purpose of the paper is to analyse the financial stability of Australian Company David Jones. After considering all the ratios, an investor would find valuable to invest in this company because of their high profitability, retain earnings, inventory turn over, profit margin, growth issues, and solvency position. However, the company is passing through an economic downturn and this financial report would help to implement proper strategies to solve this problem.

Reference List

Anon. 2009. An Example of a Solvency Analysis. pp. 1-4. Web.

Block, B. S. & Hirt, G. A. 2005. Foundations of Financial Management. 11th ed. Boston: McGraw-Hill Irwin.

David Jones. 2008. David Jones Annual Report 2008. Web.

David Jones. 2005. David Jones Annual Report 2005. Web.

David Jones. 2006. David Jones Annual Report 2006. Web.

Google finance 2009. Basic Chart of David Jones Ltd. Web.

Mangiero, S. M., 2004. Dupont Model and Forecasting Growth Methodologies. Web.

Myer. 2008. Annual Report 2008 of Myer Group Ltd. Web.

Myer. 2008. Myer Group Finance Limited Annual report. Web.

Porter, M. E., 2004. Competitive Strategy. Export Edition, New York: The Free Press.

White, G. I., & Sondhi, A. 2002. The Analysis and use of Financial statements. 3rd ed. Wiley.

Footnotes

David Jones Ltd.

Cite this paper

Select style

Reference

BusinessEssay. (2022, November 23). Financial Overview of an Australian Company David Jones Ltd. https://business-essay.com/financial-overview-of-an-australian-company-david-jones-ltd/

Work Cited

"Financial Overview of an Australian Company David Jones Ltd." BusinessEssay, 23 Nov. 2022, business-essay.com/financial-overview-of-an-australian-company-david-jones-ltd/.

References

BusinessEssay. (2022) 'Financial Overview of an Australian Company David Jones Ltd'. 23 November.

References

BusinessEssay. 2022. "Financial Overview of an Australian Company David Jones Ltd." November 23, 2022. https://business-essay.com/financial-overview-of-an-australian-company-david-jones-ltd/.

1. BusinessEssay. "Financial Overview of an Australian Company David Jones Ltd." November 23, 2022. https://business-essay.com/financial-overview-of-an-australian-company-david-jones-ltd/.


Bibliography


BusinessEssay. "Financial Overview of an Australian Company David Jones Ltd." November 23, 2022. https://business-essay.com/financial-overview-of-an-australian-company-david-jones-ltd/.