Introduction
General Motors or popularly known as GM is one of the world’s mega automotive manufacturers that has been established in 1908 by William C. Durant. Today, the corporate headquarter of the company is located in Detroit, the USA with about 244500 employees around the world along with continuous operational performances in more than 140 nations. The company and its strategic associates are involved in the development, manufacturing, and marketing of trucks, cars, and different types of automobile parts in about 34 nations through selling and servicing those offerings with a number of brands. The major 4 automobile segments of the company are GMNA (GM North America), GME (GM Europe), GMAP (GM Asia Pacific), and GMLAAM (GM Latin America/ Africa/ Middle- East) (General Motors, 2010). During the respective years of 2008, 2007, and 2006, it recorded the total vehicle delivery of 8.4, 9.4, and 9.1 million respectively while all such automobiles and vehicles have especially marketed in North America along with other independent intermediaries outside that region. The most famous product line of these automakers are Buick, Chevrolet, Cadillac, GM Daewoo, GMC, Opel, Holden, Pontiac, Hummer, Saab, Saturn, Wuling, and Vauxhall, etc. Along with its domestic market of the USA GM’s products have also high demand in Brazil, UK, China, Brazil, Russia, Germany, and Canada. One of its subsidiaries is named OnStar and this brand is the ongoing market leader in terms of safety, security, and IS (General Motors, 2010) in association with regular selling of automotive retailing, GM serves fleet customers. Thus, the international market share of the company has been projected during 2008, 2007, and 2006 as 12.4%, 13.3%, and 13.5% respectively. The company’s major competitors include Toyota, Ford, Chrysler, Honda, Nissan, etc. Market dominance also differs from country to country because of those influential variables associated with demand. Despite facing different competitive and environmental pressure, the company is still being able to hold its largest market share in the USA over 78 years with a total operating income of $21.284 billion and a net loss of $30.9 billion in 2008 (GM Corporation, 2008).
Value-based market segmentation
In terms of implementing GM’s value-based market segmentation strategy, the company will be evaluated under 6 subsequent phases, such as:
- Determine the basic segmentation criteria: Since there is no single way to segment way to segment the market, GM applies various segmentation variables along with the necessary combination to formulate the intended market structure for setting establishing a standardized pricing program. Thus, the core segmentation criteria adopted by the company involve demographic, geographic, and benefit criteria since it focuses on both consumer and business markets (Kotler and Armstrong, 2006).
- Identify discriminating value drivers: There are a number of drivers, which create different values for different segments functioning among the basic segment criteria. For example, geographic factors include target region or country and population density while demographic factors are motivated by age, income, family size, occupation, nationality, etc. Finally, benefits incorporate quality, service, economy, speed, and convenience of the purchased car (Kotler and Armstrong, 2006).
- Determine operational constraints and advantages: Since the company is being operated as an international automaker, each segment offers some operational leverages and challenges simultaneously regarding product and market development, buying, and manufacturing process. In 2007, it had gained 9% increased sales in Europe as 2.2 million units instead of vulnerable market condition in Germany. There was a high demand for the corporate vehicles in UK, Italy, Ukraine, Russia, and Greece with 260000 units while among Asia Pacific region, in the Chinese market, it had been the number one carmaker during the same year with 74% and 30% sales growth in India and Korea (GM Corporation, 2007). The company is also facing an intensive level of competition throughout the world, which is continuously influencing in relation to stiff credit markets and recessionary pressure regarding unstable oil prices and lower employment ratios. All of those variables are reversely influencing the car industry as well basic conditions constituting customers’ automobile purchase decisions involving quality, price, fashion, safety, fuel, confidence, and performance (GM Corporation, 2009). So, the competitive position of GM can be shown as:

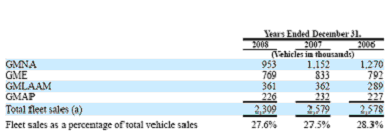
- Create primary and secondary segments: In the primary segments, GM would consider retail sales to final consumers while the secondary segments would incorporate creation of B2B marketing in terms of selling to daily car rental entities, commercial fleet parties, leasing organizations, and governments. These customer segments are widely assisted by GM’s middlemen web regarding maintenance, collision and light repairs, automotive accessories and extra service warranties (Annual report, 2008). Thus, sales statistics regarding this secondary segmentation can be show as:

Additionally, geographic segments can be noted as primary while secondary and benefits segments as secondary segments of the company (Annual report, 2008).
- Create detailed segment description: This part involves, evaluating the noted geographic and demographic segments while the former criteria focuses on corporate operations in USA, UK, Brazil, Canada, France, Spain, Korea, China, Mexico, EU etc. regions of the world. So, the condition of automobile sales of GM in terms of national and international operation during the fiscal year 2008 can be placed as:
Table: Vehicle sales in 2008:
Among all of such regions, GM is being the lion shareholder of mega automakers of some leading Chinese, Russian, and Uzbek countries while it had been able to achieve its greatest success in China where its performance had been rose significantly by 66.9% selling of 1830000 motor vehicles contributing 13.4% of total market (General Motors, 2010).
- Develop segment metrics and fences: In terms of implementing effective market segment metrics, GM would follow cluster modelling, neural network modelling and maintenance of specific rules. Similarly, fencing generally allows specific variables to consider or not to consider in setting segments.
Price structure
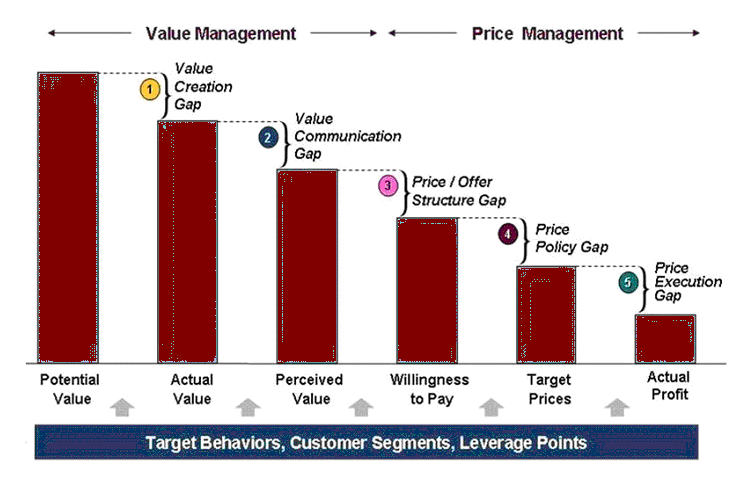
According to the price structure process, a company tends to establish a series of price levels, which represents how a product will be priced. These levels permit flexible pricing regarding the estimated variations in price depending on automobile features, customer differences, and purchasing behavior (Hanna and Dodge, 1995). Such flexible pricing technique adopted by the company can be shown as:
Table: Changed pricing structure of GM
Thus, the 7 generic approaches of market segmentation in terms of price fences and identification criteria of GM are explained as following:
- Segmentation by buyer identification: Generally, the company attends two forms of buyer groups of both consumer marker and business market located in domestic and selected outsider regions of the world (Hitt, Ireland, & Hoskisson, 2001).
- Segmentation by purchase location: It focuses on core ingredients of geographic segmentation criteria while most of the automobiles are sold through local retail outlets accessed by worldwide distribution network by charging different prices for different locations (Annual report, 2008).
- Segmentation by time or purchase: Here, the company varies its price by the season since production scenario is changes from month to moth (Hitt, Ireland, & Hoskisson, 2001).
- Segmentation by purchase quantity: In 2008, such strategy has been used in targeting specific regions with specific new modeled cars, like- new Opel/ Vauxhall in Europe, hybrid Buick in China, Holden Sportwagon in New Zealand and Australia and Chevrolet Captive in Brazil etc. However, most of the new and modified versions are commonly offered to North American region because of the largest purchase quantity (Annual report, 2007).
- Segmentation by product bundling: Here, the company would like to divide the market in terms of bunched order, like- offering a new mini vehicle featured by BAS hybrid system and fuel efficiency to the Canadian auto industry (Annual report, 2008).
- Segmentation by tie- INS and metering: It incorporates an application of price segmentation strategy regarding forecasting or logical prediction by analyzing the previous price performance record of the company (Hanna and Dodge, 1995).
- Segmentation by product design: At present, it has 8 international architectures centered in North America, Asia Pacific, Europe and Latin America termed as Mini, Compact, Midsize, Small, Rear- Wheel drive, Compact Crossover, Luxury Rear- Wheel automobiles and Midsize trucks. Additionally, lower pricing strategy is followed for almost all items up to $3190 involving Chevrolet SSR by $645 and “Employee Discount for Everyone” program (Wial, 2010).
Importance of segment pricing
Segment pricing strategy acts most effectively while GM sells its wide ranges of motor vehicle lines at different prices to different customer segments since such differentiation is not based on costs differences. As the company’s overall target market is segmentable and that segments show different degrees of demand, it should be cautious enough for not exceeding total costs of segmentation beyond the segment price revenues (Kotler & Armstrong, 2006). Moreover, the price structure can recognize the distance between customer segments permit for different customer evaluations of the brand and different value perceptions. It also makes possible to charge higher prices for one segment over another based on the customer willingness and ability to pay. Similarly, it assists GM for arranging a cost effective incentive for the customers in terms of sharing costs for each option of a car. Generally, a lower price is quoted for offers for a combined buying rather than similar ones bought separately. So, the company’s offering of selling different vehicles at lower price is reasoning of both reducing of production costs and scheduling complications along with proper management of pressure from depression, especially, for drawing the attention of internet shoppers as a bowed off party through the web listed high labeled prices. Finally, it assists GM in setting competitive prices including Ford and other mega industry partners (Hanna & Dodge, 1995).
Product importance
In this present phase of globalization and social expansion, the need of communication cannot be avoided since it is related from our business to professional and family to recreational life, which encompasses the vital role of automobiles as offered by the company (General Motors, 2010). Along with general features of a simple branded car, GM incorporates a number of specialized features in each of its individual item with huge research and development and technological effort. A number of factors can be considered for determining such essence (Kotler and Armstrong, 2006), as:
- The size, growth, and visibility of the global automotive industry can be estimated. At the same time, proper estimation of market demand for different types of motor cars would also measure the usage importance.
- Need is the foremost factor which indicates the actual necessity of a particular demand. If need is affordable enough, want arises which reproduces demand for a car. Upon this conception, GM operates its worldwide price segmentation strategy.
- Rate of usage also act significantly in essence of assumption conception.
- Customer perception of per automobile regarding the associated value can also effectively gauge such essence (Markitek, 2010).
Demand
Because of an ongoing instability of oil prices over 2008, a lower demand situation has been created for some of the GM’s higher margin cars involving full- size sport utility vehicles. Since customer demand tended to be smaller, introduction of higher fuel- efficient automobiles offered a reduced profit margin and sales in North- American region. However, less efficient full- size pick- up trucks offered above 21.7% of that regional sale in 2008 better than combined industry average. Demand for conventional sport utility vans and autos had also been lowered while further fall in demand can be projected by an uncertain enhancement of gasoline price and deficit oil in USA and other potential areas resulting as a looser of market share and profitability (Annual report, 2008). Therefore, some other potential aspects of demand analysis can be explained as:
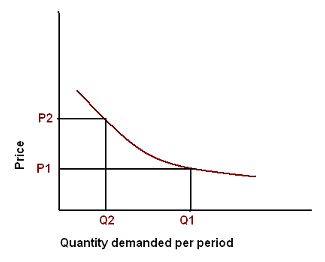
Analyzing the price- demand relationship: Measuring this relationship requires of not considering other factors affecting the stated demand to vary while it can be anticipated through the following demand curve that is showing the number of units the market will buy in a given time frame while the company will charge different prices. (Kotler and Armstrong, 2006), such as:

Price elasticity of demand: Once understanding the product responsiveness or sensitivity to price changes, the next question would be arose in terms of measuring the degree of responsiveness of price changes which is popularly known as price elasticity. According to the previously noted demand curve, a slight drop of price from P2 to P1 causes a huge increase in purchase of one of GM’s car and thus constituting elastic demand indicated as Ed (Kotler and Armstrong, 2006), like:
Ed = % Change in quantity demanded / % Change in price
Recession period
It had been acted as the most vulnerable and loosing issue of the company in terms of decreasing its certified dealership regarding 475 outlets among which 401 were related with GMNA. It also generated stiff credit industry, disorder in the mortgage sector and fluctuated fuel rate for diminishing customer loyalty. It had been reflected in delayed buying and leasing of newer ones pressuring some intermediaries for closing functions. Disruption of channel realignment is another negatively affected sector of global recession (Annual report, 2008). Other notable pressure on relative sectors can be summed up as:
- One of most negatively affected sector depression is the corporate rate of employment. Since the global demand of motor vehicles has been lowered by significantly for it, up to May 2009, GM’s sales have been lowered by 30% than 2008. In Britain, the company has cut a huge number of jobs with limited payments. Since the automotive industry of UK is going through a challenging period, about 220 personnel among total 3800 were planned to be fired while the rest would be paid by 10% from April to December 2009. It had fired international white- collar payroll from 73000 to 63000 with downsizing of 3400 US employees during the same year. GM had also cut off 230 jobs in 2008 with and intention of getting temporary production interval (USA Today, 2008).
- Gm would need a longer period of time to regain its glorious position in terms of more vehicle sales. It would further lower its various product lines associated by a sensible downsizing, which would also put it into danger zone through an adoption of huge productive and innovative capabilities apart from U.S.A. Similarly, bankruptcy ratio would be emerged in 50 metropolitan zones, especially, Michigan, Indiana, and Ohio (Levy, 2010).
- The overall conditions those threatening the company to the extent that it would not sustain for long without a bailout from the US government. It has obtained the least share value of $2.92 within 65 years with monthly $2 billion reduction of cash flow, $1.7 billion fall of market value compared to 90% higher than past years. These are jointly encompassing the need of investing at least $10 billion after 30% jobs cut, postponement of product development and short-term closing of many North American production pants for savings (Drucker, 2009).
Economic Value Estimation
The EVE model refers to a structure adopted by a company for estimating pricing of its offers (Levy, 2010). It aids in obtaining the maximum price by not loosing money yet as:
EVE = Competitor’s price + Positive discrimination value – Negative discrimination value
Since GM is not implementing this model, it can go for several subsequent stages of EVE, as:

- Understanding customer economies: Here, GM would realize customer business structure while core value drivers and hypothesis will be established up to product importance (Levy, 2010).
- Quantifying value drivers: Then, GM would quantify the monetary significance of those drivers for hypotheses testing and delivering basic input to EVE (Levy, 2010).
- Calculation of differential value: It would incorporate building algorithms for value quantification by joining customer wealth, competitive orientation and varied functionality data (Levy, 2010).
Conclusion
At last, it has been explored that from 2008, GM had been utilizing various techniques for promoting price through retail, dealer, and fleet incentives regarding customer rebates, monetary rate assistance, and particular leasing curriculums. All of those functions are highly depended on present competitive landscape and diminishing demand while the company later offered cash incentives to the customers for different lagging backs of other efforts. However, it can be expected that adoption of proper pricing policy and support from external environment would assist the company to retain its previous period.
Reference
Drucker, P. (2009) Economic Value Estimation. Web.
General Motors. (2010) Company Profile of General Motors. Web.
General Motors. (2010) Global Operations. Web.
GM Corporation. Annual Report 2008 of General Motors. Web.
GM Corporation. Annual Report 2007 of General Motors. Web.
GM Corporation. (2009) Form 10-K General Motors Corp – GM. Web.
Hanna, N., & Dodge, H. R., (1995) Pricing- Policies and procedures. Latest Edition, Macmillan Press Limited.
Hitt, M. A., Ireland, R. D., & Hoskisson, R. E. (2001) Strategic Management. 4th ed. South-Western Thomson Learning.
Kangas, P. (2006) GM’s New Pricing Plan. Web.
Kotler, P., & Armstrong, G., (2006) Principles of Marketing. 11th ed. Prentice-Hall of India Private Limited.
Levy, J. (2010) Economic Value Estimation: Evolution and Adaptation in Times of Rapid Change. Web.
Markitek, (2010) Product Pricing Strategies.Web.
USA Today (2008) GM, Ford change pricing strategy. Web.
Wial, H. (2010) General Motors Needs to Downsize, but Not Too Much. Web.

