Introduction
IMAX Corporation (IMAX), founded in 1967 is one of the leading entertainment technology companies. It is headquartered in Toronto in Canada and specializes in film and digital imaging technologies. It is a part of the out-of-home entertainment industry and veers for top spot in this segment. Entertainment industry has been undergoing a continuous growth and so is IMAX with its unique product proposition.
This paper is a company analysis of IMAX. Here we aim to understand the out-of-home entertainment industry, its current situation, and the where IMAX fits into the industry. Here we will review IMAX since its inception. In this paper, we aim to study the ups and downs of the industry, the financial performance of IMAX and how it has undergone a transformation after a drastic fall in its stock prices after 9/11.
The study will be useful for all interested in the entertainment industry. This will give a fair trend of the industry and if investing in this industry will be beneficial or not. This will provide the industry trend and the future of the entertainment industry. The study will be a useful asset to investors who are looking for venues wherein they can invest in this time of economic downturn.
The methodology adopted for research is qualitative. We will analyze the historical data from the company website and other available data sources to analyze the company vis-à-vis the industry. The industry will be analyzed used Porter’s Five Forces Model. The study will employ SWOT analysis to understand the strategic strengths of the company. There are different methods of company analysis which are SWOT analysis, ratio analysis, event analysis, patent analysis, and personality profiling and merger analysis (Joyce and Woods).
In this paper, SWOT analysis is employed to analyze IMAX. SWOT stands for strengths, weaknesses, opportunities, and threats. The importance of this tool lies in its spanning of the company’s “competitive intelligence, marketing, and communications” (Joyce and Woods 139). It helps investors in identifying the company’s strengths and weaknesses in the market. In order to understand the product portfolio of the company, BCG Matrix will be used to see which products are lucrative and which are not doing so well. This analysis will help in understanding of the entertainment industry’s environment and the performance of IMAX in it.
Company Profile
IMAX is a wholly owned subsidiary in the entertainment technology industry. The company specializes in digital and film based motion picture technology and large-format 2D and 3D movie shows in their theatres. The company primarily focuses on designing, manufacturing, selling, and leasing of theatre systems based on its technology for large-format, 70 millimeter format theatres. They have also diversified into museums and science centers, and destination entertainment sites. Mostly these commercial theatres are operated by third party operators. Generally, company licenses the trademark of the company and sells its equipments to the theatre owners. IMAX has also invested in movie productions, digital re-mastering, post production, and distribution of films.
The vision of the company as stated in its website is as follows:
- At the heart of the IMAX vision lie three qualities:
- a commitment to our customers and shareholders;
- a commitment to excellence;
- a commitment to delivering the best entertainment experiences through;
- new technologies” (IMAX).
Business Overview
IMAX Corporation carries out its activities in six business segments (IMAX):
- Projection Equipment: According to Yahoo finance, IMAX falls in the Photographic Equipment & Supplies industry. The main offering of this industry is digital imaging of movies in 2D and 3D versions which provides out-of-entertainment to customers. IMAX is the inventor of large-screen format which provides excellent picture to the viewer. Further, the theatre geometry as designed by IMAX provides all viewers the best seat in the theatre. A standard package offering of IMAX are projections, sound systems, and screen. Recently IMAX has devised a digital projection system which will have the capability of projecting both 2D and 3D films. It is also packaged with unique surround sound effect. IMAX presently has 300 theatres which are using IMAX systems all round the globe (IMAX).
- Film Production: IMAX has facilitated software production and development of giant screen films since its inception. The main focus of IMAX is the production of high quality films for IMAX theatres. Since 2002, IMAX introduced a revolutionary technology called IMAX DMR (Digital Re-mastering). This technology had the potential of transforming any movie into unparalleled image and sound quality. Some films which have undergone such remake are The Matrix Revolution, the third, fourth, and fifth Harry Potter films, Batman Begins, Spider-Man 2, Superman Returns, Happy Feet and 300.
- Distribution: IMAX manufactures high quality cameras and accessories which can be used for making specialty large-format films. These cameras enable standard, high-speed, ultra-high speed, and animation cameras are available. It has also devised a film recorder for computer graphics and other specialty cameras have been designed for filming in unique environments (IMAX).
- Post-production: IMAX distributes almost 25 percent of the films in large format (IMAX), some of which are produced by IMAX and some by independent producers. IMAX distributes films as well as delivers comprehensive packages for advertising, promoting, and educational material for the film.
- Theatre Operations: IMAX had its strong hold in its unique geometrical theatre design which provides viewers at any part of the theatre to see the movie perfectly. This design and layout are designed separately for each theatre to provide that “IMAX experience”.
- Others: all the products sold by IMAX are custom made and comes usually with a one year warranty. IMAX also provides a service program which starts with the beginning of the theatre and stretches lifelong.
Shares of the Business Segment
In this section, we will analyze the share of revenue of each business segment to the overall business. First, we will see the present share in revenue of the business segment for 2007 and then we will see the change in their share in revenue and gross margin from 2005 to 2007.
As figure 1 show, in 2007 the maximum share in revenue of the business segment was from the sale of projection systems which has been termed as IMAX system. The second largest shareholder in overall revenue was theatre operations at 12 percent followed by film distribution at 9 percent. The rest 7, 4, and 2 percent was the share of film production, post-production, and other smaller businesses. Given this, we can say that the major business segment of IMAX is systems sale. But it is important to understand that given that it is the largest business segment, it is important to understand if the segment is performing well.
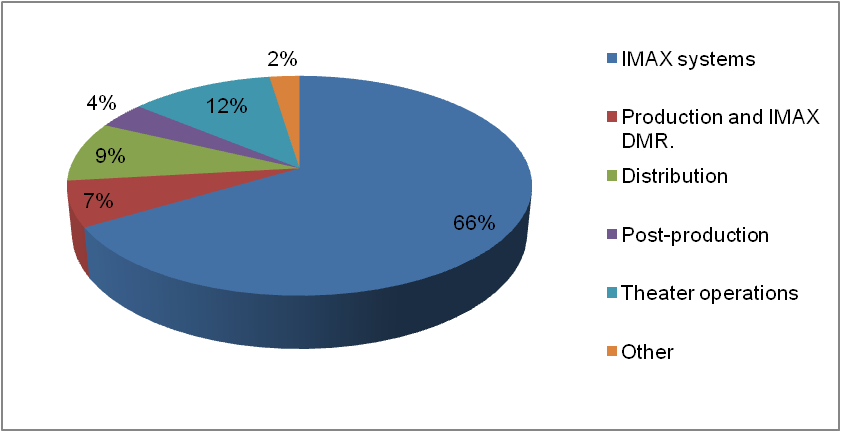
Figure 2 shows the share of revenue of the business segments to the overall revenue of the company from 2005 to 2007. As the figure shows that, the share of revenue of IMAX systems has been increasing since 2005 to 2007. The IMAX systems revenue has increased from 51 percent in 2005 to 66 percent in 2007. It has been rising consistently and its share has increasing consistently over the three years. The segments whose share to revenue has declined over the three years are Production and IMAX DMR, Distribution, Post Production, and Others. Theatre Operations too has seen a decline in share of revenue which declined from 14 percent to 12 percent from 2005 to 2006 but in 2006-07, it remained stable. This shows that sale of IMAX projection and sound systems are the most lucrative business segment for IMAX corporations.
Now we will try and understand the detailed segment operations of the company in order to understand what drew the growth of one segment whereas others were not doing so well. This analysis will provide an in-depth understanding of the overall operations of the company.
IMAX Theatre Systems
The company’s main product is project systems which comprises of the major share of the company revenue. In its product bundle, it has projection system, digital theatre control system, a 6-channel digital sound system that delivers almost 12000 watts, a screen with proprietary coating technology, and 3D glass cleaning equipment. These theatre systems are leased or sold along with extensive advice regarding theatre planning, designing, and supervision of installing the systems. These systems are also sold along with the usage right of IMAX brand name. Under the lease arrangement the company leases out the equipment bundle for 10 to 20 years initially, which is renewable for an additional period of 10 years. These equipments are also sold to the customers.
Recently the company has entered into joint venture with few theatre companies where they provide their expertise in planning and setting up the theatre for a share of the box-office earnings. The company believes that this is a process of increasing their revenue from the theatre services. In this case, the company has entered into 100 such joint-ventures since 2007.
In the theatre systems, IMAX provides two categories of products: 2D and 3D. In the 2D category, it has flat screens and domes. In 3D systems, it has IMAX 3D GT, SR, MPX, DIGITAL, and 3D Dome. IMAX and IMAX dome systems comprises of 39 percent of the open theatre bases of the company in 2007 (IMAX Annual Report 2007).
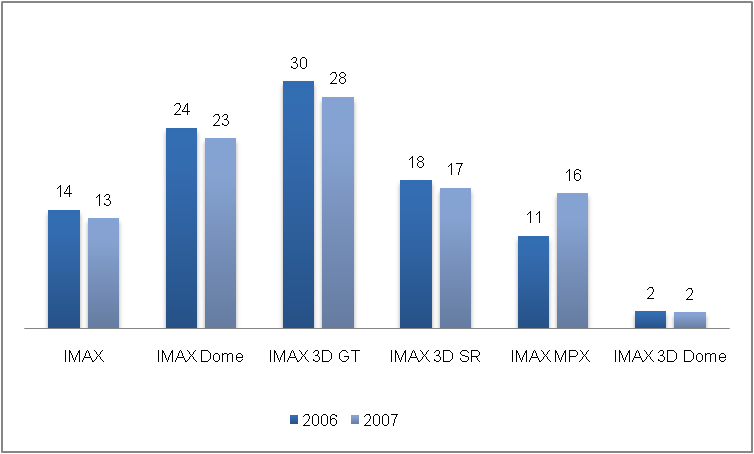
But if we consider figure 3 which shows the share (in percentage) of each type of systems sold in 2006 and 2007 we see that for IMAX systems there has been a decline in share from 14 percent to 13 percent. Even for IMAX Dome there has been a fall from 24 to 23 percent. It is only for IMAX MPX which has shown an increase in sale from 11 percent in 2006 to 16 percent in 2007. This shows that the demand for IMAX MPX being a new introduction to the market is in the growth phase. Whereas the IMAX flat screen and the domes were introduced in 1970 and 1973 respectively. Their decline in share of sale may be attributable to their matured stage in the product lifecycle.
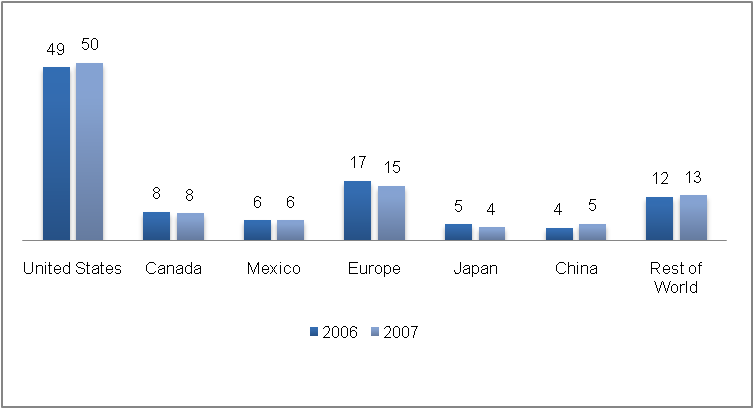
If a geographical distribution of the theatrical network base of IMAX is considered, the majority of the theatres are located in North America. As figure 4 shows, there has been a rise in the share of sale in United States while in all other areas there has been either a decline or stagnation in the growth. 50percent of the IMAX theatres were opened in North America (IMAX Annual Report 2007).
So from this analysis we see that IMAX theatres are the most lucrative business segment of the company. The primary operations of this segment are in the United States, where the largest number of theatres is opened every year. Thus, the company stronghold remains in this area. Clearly, there has been an increase in shift of focus of the company towards this segment as there has been an increase in investment in this area of business (IMAX Annual Report 2007). The expenditure in this segment in purchase of property, plant, and equipment for this segment has almost doubled from $ 847 thousand in 2005 to $1367 thousand in 2007. Thus, there has been an extra emphasis that has been laid on this area of business because of its greater share in revenue and market demand.
Industry Overview
IMAX belongs to two industries: motion picture exhibition industry as well as the photographic equipment and supplies industry. We will study the basic features of the industries in brief.
Motion Picture Exhibition Industry
The motion picture exhibition industry is in a mature stage. The industry has experienced a long-term steady growth in revenue historically. Since 1965, there has been a growth in the total box office revenues at a compounded annual growth rate of 6 percent. Though over a longer period there has been a steady growth, the industry is susceptible to seasonal fluctuations which lead to a seasonal change in revenues. From 1996, there has been an increase in the construction of new theatres and installation of screens in the industry.
Approximately, there has been a rise of 8 percent theatres from 1996 to 1999, which was double of the screen growth of 3.5 percent from 1965 to 1995. The reason behind this expansion was due to major exhibitors increasing or upgrading their asset base to megaplex formats. These megaplex or multiplexes have more than 10 screens on an average in one theatre arena. Moreover, these theatres have stadiums seating arrangements, improved projections, and superior sound systems. This new mode of theatres increased revenues of all in the motion picture business.
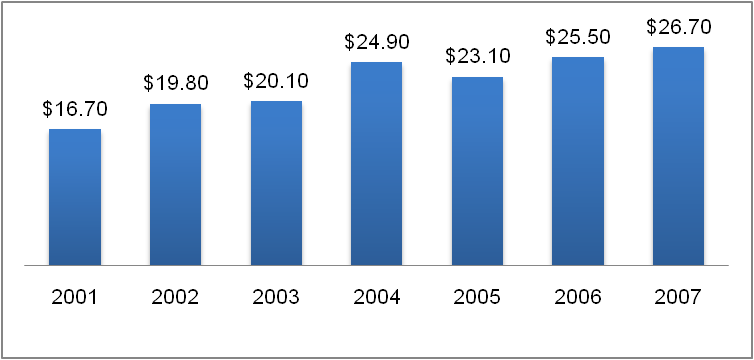
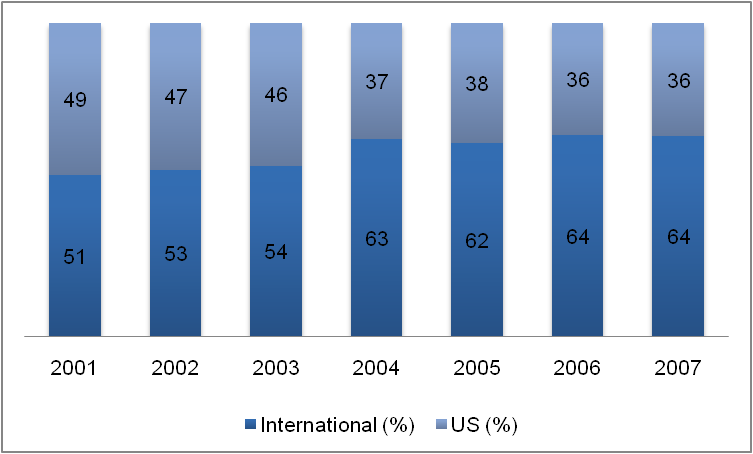
The theatrical business worldwide has been experiencing a growth. As figure 5 shows, there has been an increase in the revenue from this industry since 2001 through 2007. In 2001, it was $16.7 billion which climbed to $26.7 billion in 2007. Apart from this, the US box office revenue has increased over 2001 to 2007 and so has international revenue. But if we do an overall calculation the international revenue as a percentage of the global box office revenue has increased from 51 percent in 2001 to 64 percent in 2007 while that of the US has declined from 49 percent to 36 percent. Clearly, it is more lucrative for business to diversify its geographic area and tap the international markets which still have not reached a mature stage.
Presently IMAX is the second largest company in this industry after REG. IMAX’s market capitalization is $227.31 million and the industry average is $96 million in 2008 (Yahoo Finance). The growth rate of the company is above the industry average which is 6 percent and that of IMAX is 14 percent. Given the growth trend in the industry, it is expected that IMAX will be in a position to grow even further.
Photographic Equipment Industry
In the photographic equipment industry, IMAX takes the third position after Canon Inc. and Eastman Kodak in market capitalization (Yahoo Finance). The long-term growth rate of the leader is 15 percent and that of IMAX is 10 percent. This industry concentrates on wholesale distribution of cameras and equipments. The other products include still and motion picture cameras, audiovisual projectors and screens, etc. Sensitized materials include still and motion picture films (Kipnis and Huffstutler). From 1967 to 1979, the revenue growth of this industry was at an annual average rate of 7.5 percent, which was almost triple of the overall manufacturing growth (Kipnis and Huffstutler). In this period, it was the fastest growing industry (Kipnis and Huffstutler).
IMAX is the third market leader in market capitalization in the photographic equipment industry. But IMAX leads in revenue growth in 2008 which is at 14 percent (Yahoo Finance). The industry is in a growth phase. Though the market leaders are Cannon and Kodak, they are not direct competitors of IMAX. Given the growth momentum of the industry, IMAX too is expected to benefit from it. The industry has shown an increase in the stock market even in a bear market in the present situation of a recession over the global economy.
Doing this industry analysis provides a fair idea as to what the industry is expected to be in the near future and the position of IMAX in the industry. Further, given that both the industries are expected to grow at a fast pace, IMAX too is expected to experience a fair rate of growth.
Major Competitors
IMAX’s direct competitors are companies who manufacture and sell large-screen format film projectors. One of IMAX’s direct competitors is Regal Entertainment Group (REG) and privately held company called SimEx-Iwerks Inc. (SI) in this section we will do a detailed analysis of the competitors of IMAX.
Regal Entertainment Group (REG)
REG is IMAX’s biggest competitor in the United States (REG Annual Report 2007). They operate multi-screen theatres. One such theatre contains 10 to 18 screens. The strategy in which REG operates is through acquiring, developing, and operating multi-screen theatres. Their target markets are primarily mid-sized metros and suburban growth areas in the US.
The main competitive advantages enjoyed by REG are its position as a industry leader in domestic motion picture exhibitor in the US. Their main aim is efficient operations and cost control which makes their systems more cost effective in comparison to the more technologically sophisticated more expensive IMAX systems. The primary strategy of REG is expansion through acquisition of theatres. They have increased their revenues and operations through a strategy of successful acquisitions of 17 theatres since 1995. Their theatre portfolio offers REG with the option of showing multiple screens in one theatre with stadium quality seating arrangement. The following is mentioned in the Annual Report of REG:
“As of December 27, 2007, approximately 76% of our screens were located in theatres featuring stadium seating. As of December 27, 2007, approximately 84% of our screens were located in theatres with 10 or more screens. Our theatres have an average of 12.1 screens per location, which is well above the North American motion picture exhibition industry 2006 average of 6.5 screens per location.” (p.6)
REG has invested in National CineMedia which operates the largest in-theatre network in North America in 2007. The main business of National CineMadia is to use its “in-theatre digital content network to distribute pre-feature advertising, cinema and lobby advertising products, comprehensive meeting and event services, live and pre-recorded concerts, sporting events and other entertainment programming content.” (REG Annual Report 2007).
IMAX is the second largest company in motion picture exhibition industry with revenue of $103.73 million in 2008 and a growth rate of 14 percent. The leader is REG with revenue of $2.66 billion and a growth rate of 0.6 percent in 2008. Given the slow growth of the leader in this industry, and with the new technological advantage of IMAX of digital projectors, it can be assumed that the company will grow to become the market leader in near future.
Presently it has tied up with IMAX to provide their theatres with IMAX format digital projectors which would provide an IMAX feel to the motion pictures that will be shown in their theatres. Under this agreement, IMAX and REG will share the cost and profit from the new theaters which has digital projectors and IMAX MPX theatre design (Peer).
SIMEX – IWERKS Inc. (SI)
SI specializes in providing 3D and 4D projections to viewers. SI theatres provide to viewers 3D projections, 4D special effects and motion seating and other films. They provide 3D projectors to their clients. They have their services in over 40 countries.
The 3D projectors provided by SI are cost effective and have been purchased by varied markets. They also have their business in distribution of 3D films. They have almost 125 films which they have distributed worldwide. They have produced various 3D films and programs. They produce digital based specialty films. In post production area, SI provides its services in developing image quality on screen. Their post-production services include “Editorial Services featuring both linear and non-linear edit bays, Post-production audio services & sound design, 8/70 and 15/70 Extreme Screen Screening Theatre for dailies, Digital scanning/film recording and film output of digital productions, and 3D Screening Facilities for most formats” (SimEx-Iwerks). They rent specialty cameras for filming at a competitive cost.
From the discussion, it is clear that SI though is a direct competitor of IMAX does not have its operations in all the areas that IMAX operates in. since they specialize in specialty films such as 3D and 4D films.
Financial Analysis
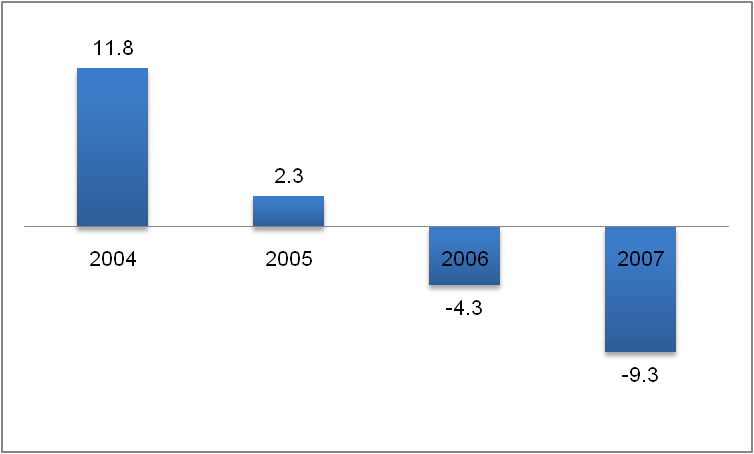
The following figure shows the rate of change in revenue of from 2004 to 2007. The rate of change is calculated by the percentage of the change in revenue as a percentage of the revenue previous year. This data when plotted in the graph shows that the growth of revenue in 2004 was highest at 11.8 percent, but then it started declining. I 2005 it was at 2.3 percent after which, there was decline in revenue of IMAX by 4.3 percent in 2006 and -9.3 percent in 2007. This shows that the revenue of IMAX is declining over the years.
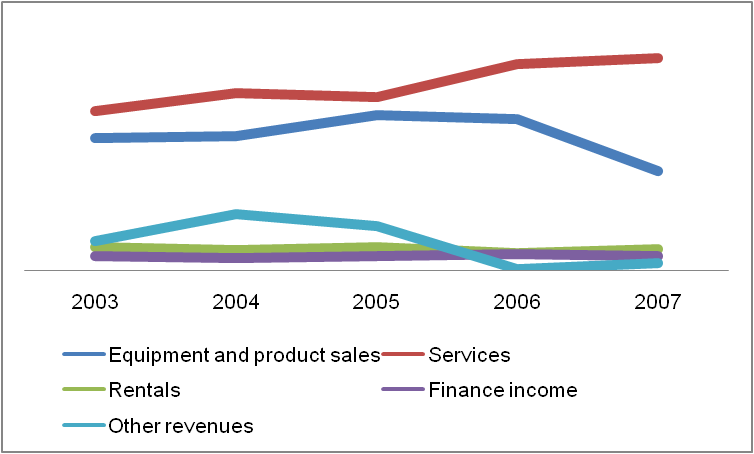
When this growth data is further dissected, it is seen that it is the revenue of Equipment and Product Sales which had been declining and had induced the drop in overall revenue of the organization. The largest share of revenue is from services and Equipment and product sales. But both the segments have shown a decline in revenue from 2005. Further, the category marked as other revenues has also declined from 2004. This indicates that there has been a decline in the main two businesses of the company i.e. the equipment and product sale and services. Clearly, the market had reached a saturation level when the revenue curve became flat. But due to the existing demand of the services like maintenance of the equipments, the rate designing, etc. the revenue earned from services were still rising marginally.
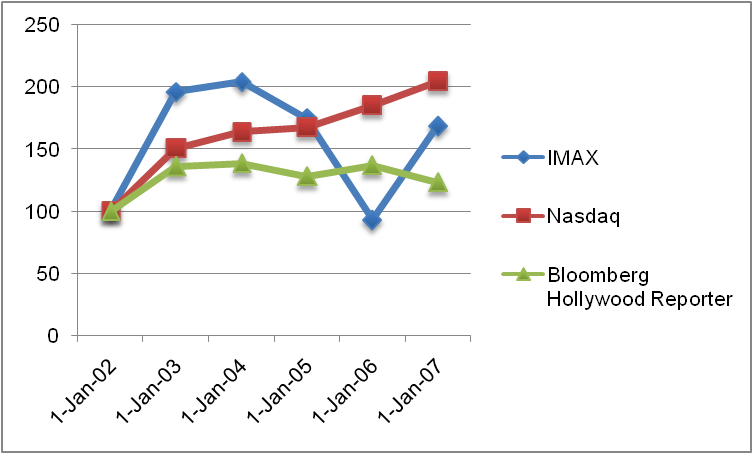
The performance of IMAX shares in the share market is shown in the following graph. The graph compares the cumulative shareholder return for $100 invested (assuming that all dividends were invested) in common shares of the company against the total cumulative returns from NASDAQ Index and Bloomberg Hollywood Reporter Index on 31 December 2002 to the end of 2007. The figure shows that the earnings from IMAX shares rose in 2002-05 but after which it fell from 2004 to 2006. From 2006-07 the share earnings rose. The share earnings for IMAX were always lower than that of NASDAQ from 2003-07 but were higher than that of Bloomberg Hollywood Reporter Index except for 2006 when IMAX earnings fell than that of the Bloomberg Index.
This shows that the performance of IMAX in the mainstream business was lower than the market (NASDAQ) but in terms of other companies in the entertainment industry and the Hollywood index, IMAX performed better than many. Its earnings were higher than that of the market average. From the share performances we could also derive, IMAX’s performance in the industry was good but in terms of the overall market, it was far less.
From the above analysis, we see that the decline in growth rate or revenue of IMAX was simultaneous with the decline in earnings from share in the market. This indicated that from 2004 the company had faced a lowering of its performance.
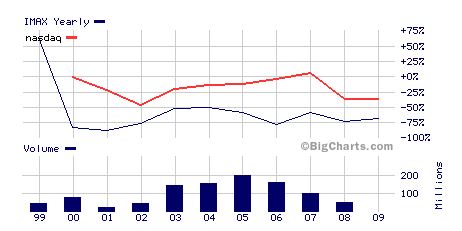
Figure 10 shows that the stock prices of IMAX had shown substantial decline in 2000, but after that it has been rising steadily except for in 2007, when the fall in prices of stocks were simultaneous with the fall in prices of stocks in NASDAQ. So IMAX has been following general market trends since 2006.
Financial ratios depicting growth for is showing a negative figure. The revenue growth for the last 5 years is -9.73 which shows that there has been a decline in the revenue of the company. The quick ration and the current ratio are 1.37 and 1.69 respectively indicating that the financial health of the company is well off. This shows that the company is in a bad phase but the fundamentals of the company are strong and so it is expected to recover once the recessionary phase passes.
SWOT Analysis
Table 1 shows the SWOT analysis of IMAX Corporation on the basis of the external and internal analysis that we have done. In this section we will discuss the strengths, weaknesses, opportunities, and threats in greater details and analyze why we consider them to be so.
New Technology
IMAX Corporation has introduced digital projection systems in the market which has revolutionized the motion picture exhibition industry. This technology enables theatre companies to “download high-quality, long-lasting movies from a private Internet system rather than have trucks transport clunky old-fashioned film stock to multiplex movie theaters” (Orol). IMAX had started its quest for digital projectors when it acquired a UK based company called Digital Projection International in 1999 (Orol).
IMAX entered into deals with other theater operators like AMC Entertainment Inc. (International Herald Tribune) and Regal Entertainment Group (Peer), to install digital projectors in their theatres in 2007 and 2008 respectively. This raised the share value of the IMAX stock in the market, indicating a turn back in the declining revenue: “Imax’s shares were up C$2.65 (US$2.64) to C$7.29 (US$7.28) in late afternoon trading on the Toronto Stock Exchange.” (International Herald Tribune)
Strength
Diversified Business
IMAX’s business is diversified into various areas. Though its main business in sale of photographic equipments, it also provides other services, production, post-production, and theatrical services. This provides the business the immunization from the problem of market downgrading. One of the main business areas of IMAX is to design theatres and provide consultation into the designing.
Table 1
Weakness
High Cost of New Technology
The cost of the new digital projectors is very high. The prices are around $100,000 for a single projector while the conventional projectors cost around $17,000 to $25,000. The first time cost of implementing this system comes to around $250,000. This indicates that the rate of acceptance of digital cameras will be slower due to its price factor. Due to the high price, market capturing with the new product will take some time. This is a weakness for IMAX as it needs this new technology to capture as much of the market as possible before a competitors brings in a cheaper option.
One business segment growing
IMAX has six business segments, but the only segment which has an incremental share in total revenue is IMAX systems sale. Other’s share has been dwindling. This indicates that the business is heavily concentrated on only one segment. If this segment fails, IMAX will have great difficulty in recovering.
Geographic concentration
The maximum share of revenue from a geographic segment is from North America and that too the United States. As there is a recessionary phase in the country, the entertainment industry to has been facing a toll of the dampened consumer demand.
Opportunity
Rise in demand for specialist movies
There has been a rise in the demand for movies in North America. Moreover, there has been a rise of demand for specialty movies in the continent. This increases the chances of increased revenue for IMAX’s 3D business segment.
Rise in demand for specialist movies
The motion picture industry has been on the growing phase. The number of admissions in theatres has increased from 1.099 billion in 1992 to 1.4 billion in 2007 (MPAA). This shows that there has been an increase in the demand for movies in theatres. Further, the number of films released also increased from 462 in 2001 to 590 in 2007. This also indicates that there is a rising trend in the industry. This definitely creates an opportunity for IMAX in expanding its revenue base.
Alliances with theatre Houses
IMAX has gone into alliance with theatre houses like AMC Entertainment and Regal Entertainment Group. These alliances are on a profit and cost sharing basis. The revenue from these alliances will be based on a share of the box-office earnings. These alliances provide a positive opportunity for IMAX as this will allow the company to sell its digital projectors which otherwise are very expensive to implement. In this case, IMAX implements the system and takes a share of the earnings of the theatre.
Threats
Economic recession
The recession is expected to hit the entertainment industry even though the effect will not be so bad. Though recessionary effect may not be so bad on home entertainment devices like cable TV, DVD, video games but the effect wile b bad on one-time entertainment where customers have to buy a ticket: “Industries that rely on sales of costly tickets for one-night entertainments, like sporting events, live music and theater, may not be so lucky.” (Keegan). These being more costly from of entertainment will not be considered so often by the consumers due to the recession.
Competition
There are other companies who are vying for market in the digital projection market. These companies are traditional projection companies like Ballantyne of Omaha and Italian-based Cinemeccanica, who are trying to get into the digital projection market. Barco of Belgium and Christie Systems of Cypress, California are the other two companies who have already got the usage rights of the chips made by Texas Instruments. When these companies get into the market, IMAX’s share will get depleted.
Conclusion
The company analysis shows that IMAX is in a stage of growth. Though its revenue growth had stagnated and was in a declining phase, but the new digital projection technology brought it back on the growth track. The company is increasingly banking on the sale of new technology to revive its fallen share prices.
The analysis further shows that the company has good fundamentals, but the recession will take a toll on the company performance as consumer demand will dwindle due to the recession.
In conclusion, we may say that the company has a lot of potential in growth. The new technology is the latest buzz in the film exhibition industry and will be in demand for a long time as the product is just in the nascent stage.
Reference
Bureau of Economic Analysis. “National Economic Accounts: Gross Domestic Product (GDP) “Current-dollar and ‘real’ GDP. 2008. Web.
Dow Jones. MarketWatch Inc. 2008.
IMAX Annual Report 2007. Annual Reprot. Canada: IMAX Corporation.
IMAX. Corporate. 2009. Web.
International Herald Tribune. “Imax in deal with AMC Entertainment to install 100 Imax digital projectors at AMC theaters.”2007. International Herald Tribune. Web.
Joyce, Paul and Adrian Woods. Strategic Management. London: Kogan Page Publishers, 2002.
Keegan, Rebecca Winters. “How Will Recession Affect the Entertainment Biz?” 2008. Time. Web.
Kipnis, Stuart and Clyde Huffstutler. “productivity txnds in the photographic equipment and supplies industry.” Monthly Labor Review (1999): 39-50.
MPAA. “Entertainment Industry Market Statistics.” 2007. Motion Picture Association of America. Web.
Orol, Ron. “IMAX Bets On Digital Future“. Web.
Peer, Melinda. “IMAX Makes Regal’s Reels More Realistic.” Web.
REG Annual Report 2007. Annual Report. Delaware: Regal Entertainment Group, 2007.
SimEx-Iwerks. SimEx-Iwerks Entertainment. 2009. Web.
Yahoo Finance. IMAX Corporation (IMAX). 2009. Web.