Introduction
The main objective of this report is to identify the challenges, opportunities, present market situation, financial position, and ability of the selected company “Kingsgate Consolidated”. However, this report will consider the effectiveness of activity-based costing to enhance shareholder wealth and provide suggestions to the company on this issue. However, this paper will also focus on the Weighted Average Cost of Capital, the principal value drivers, the Shareholder Value Analysis (SVA) model for the company, key assumptions in the model and the limitations of SVA in practice.
Company Overview
According to Reuters (2011), Kingsgate is an Australian gold mining and exploration business with possesses Chatree Gold-Mine in Thailand and focuses to remain a low-priced gold maker by increasing gold manufactures, Ore deposits, mineral resources, and it wishes to continue as a value-creator as it manufactured 132,628 ounces gold and 549,522 ounces silver in 2010 from Chatree-mine.
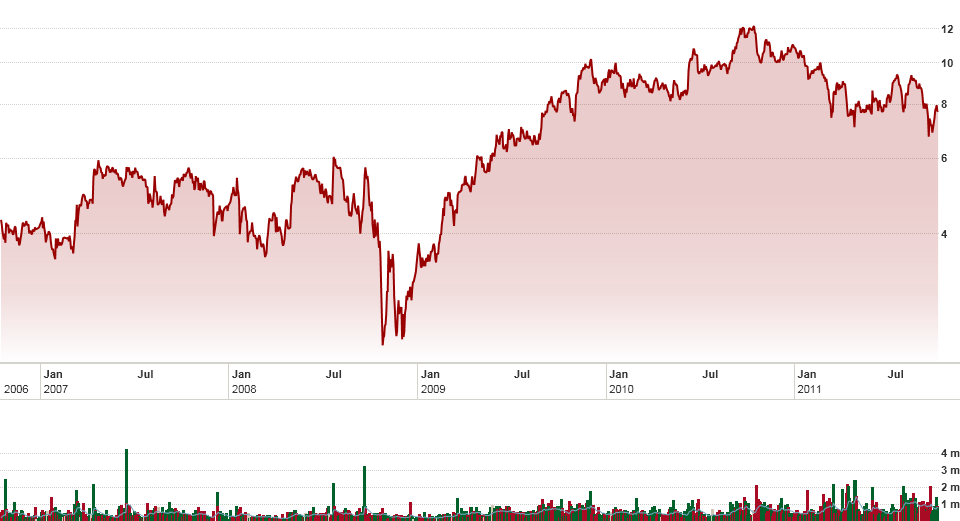
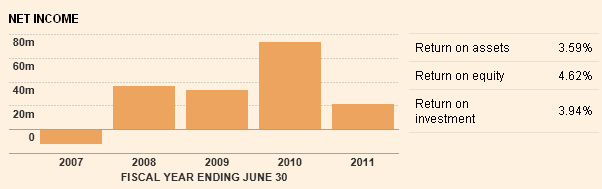
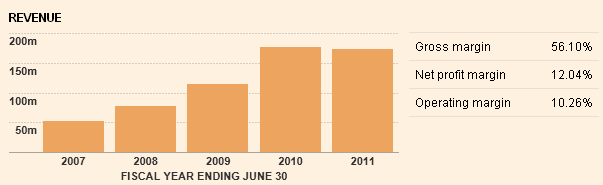
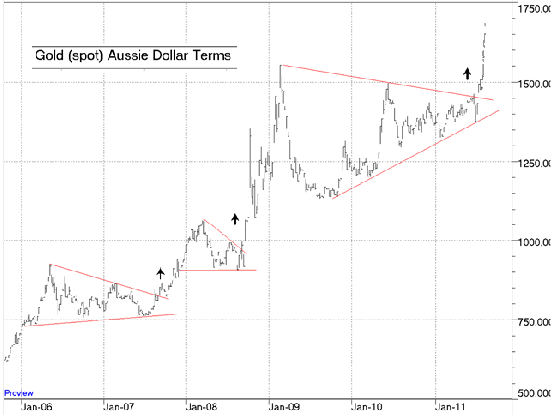
As demonstrated in the graph above, Kingsgate Consolidated has experienced unpleasant conditions during the international economic downturn because of the reason that the gold purchasing power of people fell massively causing a consequent fall in demand; even though the business possesses a very potent financial backdrop, this economic downturn has put an adverse influence over the company. Graph number three shows the five years net income comparison of Kingsgate Consolidated and figure four shows the five years revenue comparison of Kingsgate Consolidated from the fiscal year ending June 30.
From the diagram, it is arguable that Kingsgate’s gross returns dropped by 71.06 percent from AUD 73.07 million to AUD 21.15 million despite comparatively flat turnovers; however, a positive feature has been an amplification in the percentage of sales that comes from the expenditure of commodities sold from 30.87 percent to 43.65 percent.
Current Opportunities for Kingsgate Consolidated
Calibre Report (2011) argues that the current topside break out of the following ascending graph represents that gold will see strong buying for long-term in the Australian market to broaden its amazing performance in 2012; this portrays an excellent opportunity for Kingsgate as more investors will seek to invest in this sector while others will try to buy more stocks.
Another opportunity arises due to the reason that Kingsgate has a powerful financial position, superb administration, and high production-growth potential, which could help the firm to double its plant-processing facility at the Chatree colliery – with the suggested doubled capacity, the firm will be capable to boost its outcomes and revenues further and focus on seeking first-class gold deposit at Chatree.
Discoveries of new mines are possible in Thailand, that would provide great opportunities for Kingsgate; moreover, it has recently received final approvals to access all mining areas at Chatree gold colliery, which provides the suppleness to blend ore from high and low-quality areas throughout 2012; besides, this timing fits nicely with the plant expansion-plan, which would possibly attain full capacity. Conversely, The Bull (2011) reports that Kingsgate is currently looking for acquisition of fresh schemes, for instance, the newly acquired Bowdens Silver Project that has a silver resource of 97 Moz with the ground value of AUD 5b; Kingsgate’s MD and CEO Thomas argues that this opportunity enables Kingsgate to advance projects as Bowdens are ideally suited to Kingsgate’s core competencies.
In addition, it is essential to note that as Kingsgate has turned highly committed to ensuring environmental sustainability and in recent years, it is showing strong tendency to attain ethical business practices by focusing on the interests of all stakeholders, the governments of both Australia and Thailand have started to show positive attitudes by creating business-friendly circumstances for Kingsgate. After realizing such attitudes from both these governments, the company has started to undertake some other ethical code of conduct and include corporate social responsibility and sustainable practices more strictly into its corporate governance. The company believes that as these ethical schemes and governance will come into practice in the upcoming year, it would start to receive positive responses from the neighboring communities. Moreover, the concerned governments would in turn agree on the issue to give Kingsgate the approvals to explore in some other important mining spots in both the countries, providing the firm extensive opportunities to seek further profits.
Conversely, because of the environmentally efficient, low waste emitting, and sustainable behaviour put forward by the firm, it is likely that it would very soon turn out to be the best mining business that could carry out its business economically, but still be eco-friendly. This would also arise the opportunity for Kingsgate to gain competitive advantage over the industry rivals.
Current Challenges for Kingsgate Consolidated
Kingsgate faces a range of challenges in operating in the Australian mining industry; apart from political, recessionary, inflationary, and competitive challenges, legal barriers pose a great deal of problem for operating efficiently. This involves challenges related to environmental and labour laws, taxation laws, and many more. According to Environment Protection Authority, the concerned pressure groups in the country put forward several challenges for the mining businesses creating troubles to operate profitably (EPA, 2011).
A study on the Mine managers throughout Australia in 2006 suggested various challenges confronted by mining businesses: among external challenges, 35% respondents argued that they had lack of equipment, input-costs were higher for 35%, and government regulations had troubled 22%; conversely, among internal challenges, 35% suffered employee turnover, 22% lacked managerial skills, while 16% had scheduling constraints (Jamieson Group, 2006). Being a part of the Australian mining industry, Kingsgate also faces a range of such challenges – the most alarming one includes the staff turnover issue.
Furthermore, Kingsgate Consolidated (2010) points out that ensuring workplace safety for employees remain another big challenge for the mining giant, as the mining activities are quite risky and the operational processes usually causes some causality. This is also one of the reasons of high turnover.
The Effects on Kingsgate’s Ability to Create Shareholder Value
Kingsgate’s aim is to be an ideal gold corporation conveying shareholder value by means of turnover, expansion, and dividends; therefore, it incessantly evaluates new business opportunities to append extensive and long-term shareholder value by influencing mining-development and operating-expertise in Asian regions. However, the challenges and opportunities discussed above habitually put some optimistic or pessimistic impact over this aim to create shareholder value (Pandey, 2007). Opportunities such as prospect of strong gold buying in Australian market in upcoming year, expansion of Kingsgate’s plant-processing facility at the Chatree mine, discoveries of new mines, approvals to access all mining areas at Chatree, and competitive advantage over the industry rivals by turning environmental sustainable exert some positive influence over the firm’s ability to create shareholder value.
These prospects would mean higher profits in long run for the shareholders. Conversely, the current challenges, like recessionary, inflationary, and legal barriers like environmental and labour laws, concerns from the pressure groups, and high staff turnover create a great deal of problems for the firm to operate efficiently and increase profitability; rather, this means higher operational costs, low economies of scale, and lower capacity utilisation. These in turn would mean that the firm would suffer a decline in its ability to pay dividends to the shareholders.
Contribution of Activity–Based Costing to Enhancing Shareholder Wealth
Roztocki (2010) and Gilford (2010) pointed that traditional cost analysis of an organisation considered direct labour hours as only cost driver to calculate cost of products where as modern cost standards define that labour hour cannot be a unique assessment tool that carried only 5–10 % of entire production costs of a firm. Considering limitations of typical costing standards, activity–based costing (ABC) method has included machine hours along with non–volume cost dynamics of an organisation as well as its labour hours throughout cost allocation.
Alternatively, first of all ABC accumulates respective overhead costs of firm’s activities and subsequently split costs function into product, service and former cost sources that would term as activity of the firm. Thus, ABC provides most recent, relevant, as well as reliable information and data during designing financial policies how to enhance shareholders wealth and convey simpler decision–making strategies by identifying most economical financial assets. More specifically, ABC involves with a series of cost standards that able to overcome conventional shortcomings of a firm for instance:
- ABC has key focus on radically minimise cost of each department respectively.
- Discover scope of superior controlling approaches to overcome limitations of material yield along with efficiencies of direct labour where significant manufacturing and overhead costs would absent.
- Make comparisons among cost standards that proficient to incorporate expenditures, wastes and non–value added activities even though cost standards under ABC are more concentrate on satisfied cost management rather than cost reduction. Conversely, non–value added financial activities recognised as core tools of assessing firm’s operational performance (Tonnage Throughput, Machine Downtime Hours & Process Cycle Time).
Influence of Activity–Based Costing on Kingsgate’s Performance
In the light of previously mentioned ABC benefits, cost standards of ABC have numerous significant influences on Kingsgate’s performance in the industry competition. According to the requirement of the paper, this part has involved to illustrate all respective products profitability report of Kingsgate under ABC approach. According to Roztocki and Needy (1998), following is the valuation approach of Kingsgate under ABC where performance measure focused on EVA (Economic Value Added) in order to ensure shareholders value by creating an improvement of cost structure.
More specifically, compare to last year, in Thailand Kingsgate’s Chatree Gold mine is now pursuing 20.0 % lowest costs of production than major global competitors and additionally, boosts entire production volume by 40.0 %. Alternatively, reserves of Minerals increased by 41.0% or in another word 1.90 million ounces of gold and substantially, this profile extended Kingsgate’s mine-life where Mine resources amassed 30.0 % or 4.30 million ounce gold more than prior fiscal period. Consequently, annual profit increased by 125.0 % or AUS $73.0 million, which are the highest profit value as well as earning per share of Kingsgate’s business history. Conversely, dividend yield also magnified by 3.50 % that is the most exceptional accomplishment among global gold producers (Kingsgate Consolidated 2010).
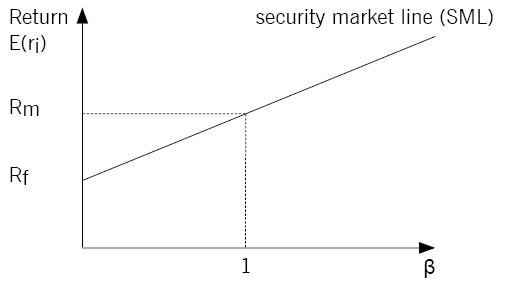
Capital Asset Pricing Model (CAPM)
Pandey (2007) stated that, CAPM defines the liner relationship among required rate of return of an investment in terms of market securities or any business operation. Key assumptions of the CAPM included diversified portfolio investment, transaction horizon for a single period of time, make available of comparison among diverse securities, assumption of risk free rate of return to lend and borrowing of investments. Following is the equation of CAPM formula.
E (ri) = Rf + (Rm) – Rf) β
Here,
- E (ri) = Required Rate of Return on Financial Asset i or Cost of Equity
- Rf = Risk-Free Rate of Return
- Rm = Market Portfolio Return
- β = Beta
Calculation of Weighted Average Cost of Capital (WACC)
WACC includes in the appendix
In the light of CAPM approach, reasonable WACC of Kingsgate enhances their business operations prominently as well as executing a healthy stock profile not only in Australian stock exchange, but as also started processing of IPO (Initial Public Offering) in Thailand from 2010. More specifically, Kingsgate exercised an agreement with Sinphum Co., Ltd in order to call preference share of Sinphum Co., Ltd. Subsequently, this transaction assigned to facilitate IPO towards the valuable stockholders in Thailand. As par agreement, Kingsgate committed to pay Baht 43.0 million or AUS $1.50 million to Sinphum Co., Ltd as premium of declared preference shares where as par value of the preference shares is Baht 265.0 million AUS $9.50 million. Thus, Kingsgate is continuing monitor of scope of improvement of gold mining projects to provide superior value towards the shareholders (Kingsgate Consolidated 2010).
Principal Value Dynamics of SVA by Rappaport (1986)
To illustrate principal value dynamics of SVA, Chartered Institute of Management Accountants addressed that, the SVA model was first introduce by Alfred Rappaport in the middle 1980s (CIMA, 2004). Key objectives of SVA model is involved is assessing probable risks of available shareholders in order to make a framework for strategic decision making. In time of SVA assessment, value of an organisation’s business operations conduct through determining expected free cash flows for future operations concerning cost of capital appropriately. Furthermore, the SVA value is also an expression of business valuation by adding value of two essential ingredients
- marketable securities and
- other investments where debt value of the firm should be subtracted.
Alternatively, free cash flow has significant influence on firm’s entire operating cash flow for a predefined time where financing cash flow (Share or Debt Issues, Dividend & Interest Payments) should be placed after assessing free operating cash flow as following table.
In describing principal values of SVA model by Rapport (1986), in both hypothetically and practically operating value of an organisation can also be assessed through a shorter alternative form as following expression. Here, time of future cash flows taken into account for two times period:
- Present value (PV) of cash flow during operation
- Post operation value of cash flow
Operating Value = PV of Free Operating Cash Flows during Operation + PV of Post Operating Free Cash Flows
According to report of Wet & Jager (2007), it concentrates on standards of value drivers of SVA, PV of cash flow during operation is an explicit way of assessing free operating cash flows for every ingredient of individual financial operations annually and in this case detailed assessment form is not mandatory always. Alike free operating cash flow, value assessment of SVA also includes a simplified form that proficient to covey most reliable results in tricky situation. In addition, the simplified form of SVA valuation grounded on seven value drivers those are termed as the principal value drivers of SVA by Rappaport. These are:
- Annual Sales Growth Rate (%);
- Value of Operating Profit Before Interest and Tax Payment;
- Tax Rate on Cash Income Excluding Deferred Tax;
- Incremental Value on Constant Capital Investment Rate;
- Investment Value on Working Capital Rate;
- Scope of Investment Planning; and
- Cost of Capital (Specially Cost of Debt)
From aforementioned SVA value drivers, first five drivers are involved in calculating annual free operating cash flow during scope of investment and that value is treated as discounted cost of capital. Moreover, to keep consistency with hypothetical view of cash flow accurate discount rates of an organisation employed to calculate WACC where WACC summarised return on equity weights as well as debt in accordance with available proportion of debt and equity investment.
Finally, after operation PV of free operating cash flows considered terminal value of an organisation and in case of competitive industries there have a tendency to generate excess return on investment and average earning is the cost of capital that bulk cash flow at the end of year.
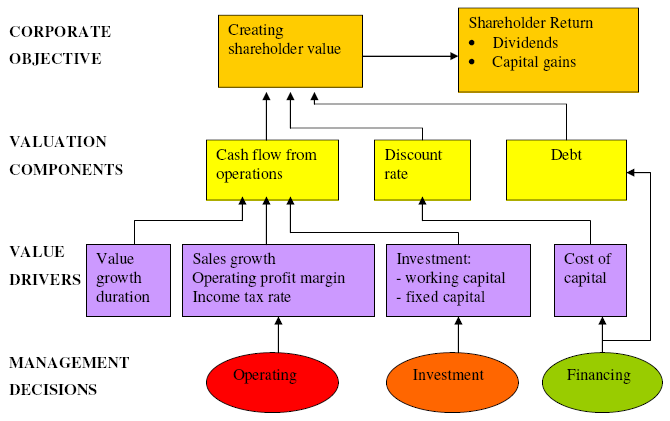
SVA Model for Kingsgate
Concerning all of the above facts of principal value drivers of SVA, this part of the paper would structure SVA model for Kingsgate as below.
In the light of above diagram following are the value drivers required to assess for Kingsgate during planning period of 2009 and 2010 where 2009 is consider as length of time over that future cash flow of 2010 of Kingsgate assessed.
Sales Growth (%)
= {(Sales Value in 2010 – Sales Value in 2009)/ Sales Value in 2009} * 100
Calculations have included in appendix.
Operating Cash Flow
Cost of Capital for the Year Ended 2010
Taking into account seven drivers of SVA, amongst their business journey Kingsgate is now enjoyed their best profit performance in terms of production growth, prominent capital growth, and dividend payment. More specifically, in order to finance original Mine plant as well as boosts market capitalisation Kingsgate initialised to raise debt their funds and thus now existing plant expansion is covering approximately 10.0 % of available market capitalisation. Alternatively, Kingsgate wined Fifth Best Performing Stock announced by the AFR and in addition, accomplished Third Best Performing ASX-200 Stock for the prior decade though Kingsgate was in great threat of collapse by global financial crisis. Motto of Kingsgate’s success routed through persistence of managerial skills featuring cost management, substantial option of acquiring share, reasonable cost of capital, prospectus scope of expanding project plant in both domestic market and abroad, as well as investment planning, handsome cash payment of dividends and increase value of stock price (Kingsgate Consolidated, 2010)
Shareholders Value Calculation
Concerning on motto of SVA model shareholder value is involved with corporate vale as well as debt capital of the firm Kingsgate where corporate value is assess through calculating net present value (NPV) of cash flows for the planned period. For instance, to assess shareholder value of Kingsgate following calculation is attached with value of NPV for the year ended 2009 and 2010. However, detail calculation has included in the appendix of this essay
Working
Cost of Debt, Kd = 1 + (1 – Tax Rate)*(Debt / Equity)
Cost of Equity, Ke = {Risk Free Rate of Return, Rf + (Market Portfolio Return, Rm – Risk Free Rate of Return, Rf)* Beta, β}
Mutually cost of debt and equity calculation has executed in accordance with CAPM (Capital Asset Pricing Model) approach.
Therefore, NPV = ∑ Discounted Cash Flows after Tax (CFAT)–Net Cash Outlay (NCO)/Cash at Hand
However, detail calculation has included in the appendix of this essay.
Gordon Growth Model
Anon (2004) denoted that, the Gordon growth model is another valuation process that involved assessing firm’s value by discovering dividend growth rate as following equation.
Present value of Stock of Kingsgate = {(Dividend Payment in 2010)/ (Cost of Equity, Ke–Growth Rate in Dividends Payment, g)}
According to annual report 2010 of Kingsgate Consolidated, during 2009 stock value was AUS $6.70 where as previously mentioned calculation showed that in 2010 stock value is AUS $7.90, which is AUS $1.20 greater. Concerning the valuation, it would wise to buy stock of Kingsgate Consolidated.
Working
Growth Rate in Dividends Payment, g= {(Dividend Payment in 2010 – Dividend Payment in 2009) / Dividend Payment in 2009}
Efficient Markets Hypothesis
Aga and Kocaman (2008) illustrated that; efficient market hypothesis (EMH) is a prediction of required rate of return of Kingsgate’s stock and thus the EMH attracts potential investors. Moreover, the EMH has required being concerned changes in stock prices as described in the Gordon’s growth model to define market efficiency fundamentals of Kingsgate focused on return consequences of stock price.
Limitations of SVA in Practice
To draw limitations in practice, CIMA (2004) pointed that, Rappaport’s SVA model is typically assessed value of a firm’s shareholder and in addition, involved in evaluating company’s alternative strategic investment decisions where both pre and post-strategic value also compared. In simple form, structuring seven principal drivers provide sensitivity analysis to assess potential influence on shareholders value. Furthermore, from operational context, executives able to analysis seven principles of SVA in more detail form focus on two facts
- evaluation of practical performances and
- enhancing shareholders wealth.
In doing so, first of all, the most significant difficulty that arises here is that analysis and techniques of SVA is involved to predicting required variables rather than rational. Secondly, Spencer & Francis (1998) and Walters (1999) identified that, uses of SVA model is an approach of valuing acquisition or divestment that is not enough proficient to explore its skills to measure internal performance of an organisation.
As a result, though hypothetically SVA model exists with widespread discussion, but absence of significant empirical evidence compress scope of divisional performance of an organisation as well as value based metrics uses. Finally, Wet & Jager (2007) addressed that, SVA model is an ideal measure of assessing corporate financial performances, but carried an important complexity in evaluating form’s future cash flows along with lack of individual performance assessment that linked remuneration packages.
Reference List
Aga, M. & Kocaman, B. (2008) Efficient Market Hypothesis, and Emerging Capital Markets: Empirical Evidence from Istanbul Stock Exchange. International Research Journal of Finance and Economics, 13(1). Web.
Anon (2004) Dividend Discount Models. Web.
Calibre Report (2011) Is Kingsgate Consolidated A Golden Opportunity. Web.
CIMA (2004) Maximising Shareholder Value Achieving clarity in decision–making. Web.
EPA (2011) Meeting regulatory challenges in the SA mining industry. Web.
Financial Times (2011) Kingsgate Consolidated Ltd. – Financial Overview. Web.
Financial Times (2011) Kingsgate Consolidated Ltd KCN:ASX. Web.
Gilford, T. K. (2010) Activity-Based Costing in Manufacturing. Web.
Jamieson Group (2006) Australian Mining Industry Survey Results. Web.
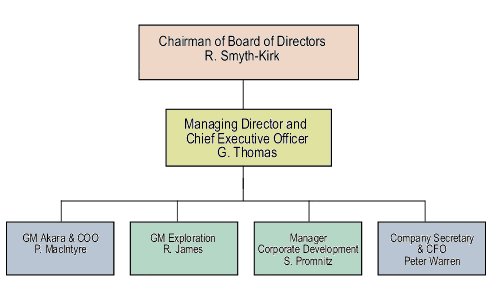
Kingsgate Consolidated (2009) Management Structure Chart. Web.
Kingsgate Consolidated. Annual Report 2010 of Kingsgate. Web.
Kingsgate Consolidated (2011) Preliminary Final Report 4E for the year ended 30 June 2011. Web.
Pandey, I. M. (2007) Financial Management. 9th ed. New Delhi: Vikas publishing house.
Reuters (2011) Kingsgate Consolidated Ltd (KCN.AX). Web.
Roztocki, N. (2010) How to Design and Implement an Integrated Activity-Based Costing and Economic Value Added System. Web.
Roztocki, N. & Needy, K. L. (1998) An Integrated Activity-Based Costing And Economic Value Added System As An Engineering Management Tool For Manufacturers. Web.
Spencer, C. & Francis, G. (1998) Implementation Issues of Value Based Metrics at Divisional Level. Web.
The Bull (2011) Stocks to watch: Top Gainer – KCN. Web.
Walters, D. (1999) The implications of shareholder value planning and management for logistics decision making. Web.
Wet, J. & Jager, P. (2007) An Appropriate Financial Perspective For A Balanced Scorecard. Web.
Appendix 1
The following figure shows the management structure of Kingsgate Consolidated:
The following graph demonstrates the stock prices of Kingsgate Consolidated:

The chart below shows how Kingsgate constantly tries to achieve water efficiency:
The graphs below show the rate of reducing CO2 emissions and use of electricity:
High staff turnover, in turn, causes Kingsgate to face the problems outlined in the figure below:
Appendix 2
Appendix 3
Working:
- Cost of Debt, Kd
= 1 + (1–Tax Rate)*(Debt/Equity)
= 1 + (1–0.30)*(0/316,043)
= 1 + (0.85)*0
= 1 %
- Cost of Equity, Ke
= {Risk Free Rate of Return, Rf + (Market Portfolio Return, Rm–Risk Free Rate of Return, Rf)* Beta, β}
= {0.0475 + (0.0584–0.0475)*0.93}
= 0.0576
= 5.76 %
Sales Growth (%)
= {(Sales Value in 2010 – Sales Value in 2009)/ Sales Value in 2009}*100
= {(175,480 – 113,015)/ 113,015}*100
= 55.271 %
Operating Cash Flow
Cost of Capital for the Year Ended 2010
Shareholders Value Calculation
Working:
Here, Corporate Value = NPV at the Year Ended 2010
Therefore, NPV = ∑ Discounted Cash Flows after Tax (CFAT)–Net Cash Outlay (NCO)/Cash at Hand
= (92734–49,098)
= AUS $43,636
Gordon Growth Model
Present value of Stock of Kingsgate = {(Dividend Payment in 2010)/ (Cost of Equity, Ke–Growth Rate in Dividends Payment, g)}
= {(0.35)/ (0.0576–0.0133))}(Kingsgate Consolidated 2010, p.6-79)
= AUS $7.90
Working:
Growth Rate in Dividends Payment, g = {(Dividend Payment in 2010–Dividend Payment in 2009)/ Dividend Payment in 2009}
= {(0.35–0.15)/0.15} = 1.33 %