Abstract
The paper provides findings of the financial analysis of Lowe’s Company. Lowe’s Company has a strong market position, which helps to generate higher sales every year. However, it is important to evaluate whether the company can maintain its profitability or not. Therefore, the financial information of Lowe’s is evaluated in this paper to determine its potential to grow in the future. The financial analysis is performed by analyzing income statements, balance sheets, and cash flow statements.
Furthermore, the solvency, profitability, and liquidity of Lowe’s is assessed in this paper. The overall results indicate that the company has a strong, profitable position and it is likely to grow at a higher rate in the next year. The projected income statement is also included in this paper, which shows the expected net earnings of the company in 2017. The financial analysis of Lowe’s has validated the hypothesis that it has the potential to increase its net profits and improve it’s earning per share.
Lowe’s Financial Statement Analysis
Lowe’s Companies, Inc. (Lowe’s) is a leading retail company specializing in home improvement and hardware products and services. It is a US-based company, and its stocks are listed on Fortune 50, NYSE (Lowe’s Company Information, 2017). The company’s last financial reporting period ended on February 3, 2017, and its annual report includes consolidated balance sheets for the last two years. In this research paper, the company’s consolidated balance sheets are analyzed to perform the trend analysis including horizontal and vertical analysis and also, the financial ratio analysis to evaluate its financial performance in the last two years. Furthermore, the paper discusses accounting policies and treatment methods adopted by the company for recording and reporting of its assets, liabilities, and equity.
Trend Analysis
The trend analysis provided in this section determines the yearly change (horizontal analysis) and proportion of each financial element (vertical analysis) included in the values of the company’s assets, liabilities, and equity.
Table 1: Common Size Balance Sheets.
Table 1 indicates that the major proportion of Lowe’s current assets was held as merchandise inventory. Although the company’s business requires it to have a large volume of inventory in its stores, it has certain drawbacks including inventory loss due to product damage, obsolete products, and change in price, etc. Therefore, the company faces risks of loss in the value of inventory that could affect its liquidity position.
Moreover, it could be noted that the company mainly owns and operates its stores. Furthermore, it is indicated that the company recorded a significant increase in the book value of goodwill that was associated with its acquisition of Orchard Supply Hardware. The horizontal analysis shows that the value of all assets except short-term investments and deferred income taxes increased in 2016.
The analysis indicates that the company owed a significant amount to its suppliers and finance providers. It could be stated that the company financed the acquisition of Orchard Supply Hardware and stores expansion through external borrowing both short-term and long-term. The company’s decision to borrow additional amounts rather than financing investments through equity could be due to the low-interest cost. One concern that could be raised is that despite increased borrowing in 2016, the company’s retained earnings decreased by almost 18%. It could imply that the company’s operating costs were high in the last year or it was not able to increase its profit margin.
Financial Ratio Analysis
The financial ratio analysis provided in the following includes results of different ratios including liquidity, efficiency, and solvency that are related to the analysis of Lowe’s balance sheets.
Table 2: Liquidity Ratios.
Table 2 indicates that the current ratio value was 1 in both years. However, the value of the quick ratio was very low, which was due to high inventory low. It implies that the company had a weak liquidity position, but it reflected the common trend in the retailing industry.
Table 3: Efficiency Ratios.
Table 3 indicates that Lowe’s did not have any accounts receivable in both years. It means that the company settled all its customer accounts and received cash for all credit sales before the year-end. Although the value of payables turnover decreased in 2016, the company managed to keep the value of inventory turnover constant in the last two years. However, it could be noted that the company held inventory for almost 90 days, but settled its accounts payable in 57 days. The delay could create financial difficulties for the company.
Table 4: Solvency Ratios.
Table 4 indicates that the company had a weak solvency position in the last two years. Moreover, it deteriorated in 2016 because of high borrowing. The analysis also indicates that if the company experiences any major business problem, then it could face significant financial challenges (Rowe, 2017). Furthermore, the value of the interest coverage ratio indicates that the company generated sufficient operating income to fulfill its interest obligations.
Accounting Policies and Treatments
Lowe’s follows U.S. GAAP for the preparation of its financial statements. The company operates through different subsidiaries, which carry out various business activities to support the company’s main business of selling home improvement and hardware products and services. The company acquired a new business in 2016-17, and its assets and liabilities are also consolidated in the parent company’s accounts. Therefore, it could be identified that the company uses a consolidated basis for preparing its financial statements on a quarterly and yearly basis.
It could also be noted that the company made non-GAAP adjustments related to goodwill and long-term asset impairment related to its acquisition of Orchard Supply Hardware in 2016. It is described in the company’s annual report that it evaluates goodwill for impairment on an annual basis. If there is any impairment loss, then the company records it against its earnings for the year. However, the management also highlights that such estimations are affected by accounting assumptions and judgments regarding the carrying value of goodwill.
The company records its non-current assets including buildings and building improvements and equipment at their net book value and calculates the depreciation amount by using the straight-line method. The cost of land and construction in progress is not depreciated. Furthermore, the company determines the fair value of its long-term investments and liabilities including mortgages for reporting purposes.
The company incurs various off-balance-sheet transactions that mainly comprise of operating leases. The total undiscounted value of operating leases was US$5,853 million in 2016. The present value of “future operating lease payments of the company is determined to be US$3,937 million based on the discount rate of 7.27%” (Lowe’s Cos. Inc. (LOW), 2017). Moreover, transactions between subsidiaries of Lowe’s are settled and eliminated for preparing consolidated balance sheets.
Lowe’s Corporation – Cash Flow Statement Analysis
In the previous analysis part, balance sheets of Lowe’s Company (Lowe’s) were analyzed for the last three years, which indicated that the company’s net book value increased in 2016. Moreover, the company reported an increase in its earnings in 2016 (Lowe’s, 2017). It would be interesting to investigate the company’s cash flows especially operating cash flow and the company’s profitability during 2014-16 to assess its position.
Return on Invested Capital
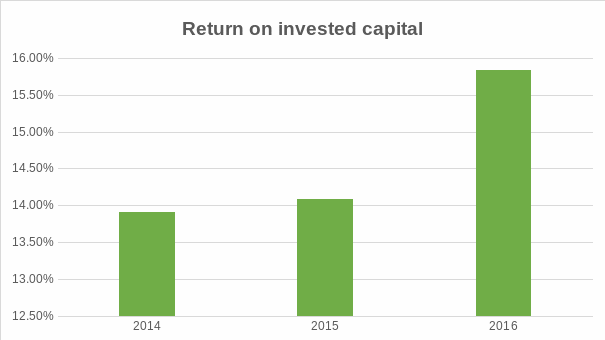
The company’s profitability is assessed by calculating the return on invested capital ratio. The ratio indicates the effectiveness of a business to earn profits from its investment (Bodmer, 2014; Procházka, 2016). The return on invested capital of Lowe’s increased by 0.18 percent in 2015. The main reason for the improvement in the ratio value was the sales growth of home improvement products and appliances in 2014.
Further improvement in the ratio value was noticed in 2015 due to the substantial increase in net earnings. The persistent increase was followed by the increasing demand for home improvement products fueled by the increasing demand for new homes and renovations. Additionally, Lowe’s succeeded in controlling its capital expenditure in the last three years and focused more on increasing sales per square foot in its existing stores that increased its net earnings.
Table 5: Return on Invested Capital.
The consistent growth in the ratio value can be noted in Figure 1, which indicates that Lowe’s managed to increase its profitability by utilizing its available resources. Lowe’s effective tax rate also declined in the last three years that had a positive impact on net earnings.
Additional Profitability Ratios
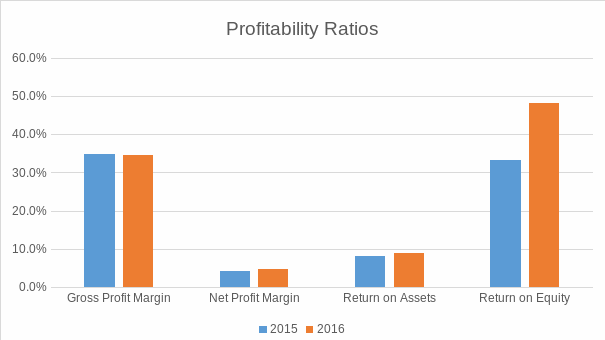
Profitability ratios are used to measure the potential of a business to generate more income in the coming periods (Goel, 2015). The values of the gross profit margin provided in Table 6 indicate that Lowe’s was inefficient to control its cost of sales. Lowe’s incurred high labor costs for production due to the increased competition in the global market. However, the company was efficient in reducing its revenue expenditures as compared to its sales.
Lowe’s reduced its amortization and depreciation expense by selling some of its non-performing operating assets (Lowe’s, 2017). On the other hand, the acquisition of new assets proved to be beneficial in 2016 as indicated by the improvement in the value of return on assets of the company. The return on equity of Lowe’s significantly increased in 2016. The main reason was the decline in the retained earnings of the company despite an increase in its earnings.
Table 6: Profitability Ratios.
As shown in Figure 2, the profitability ratio trend indicated that Lowe’s showed a slight improvement in the values of net profit margin and return on assets in 2016. It indicated the company’s weakness in controlling and managing its costs. However, the company maintained consistency in generating a high profit by utilizing its available assets.
The following figure graphically represents changes in profitability ratios discussed above.
Cash Flow Statement Analysis
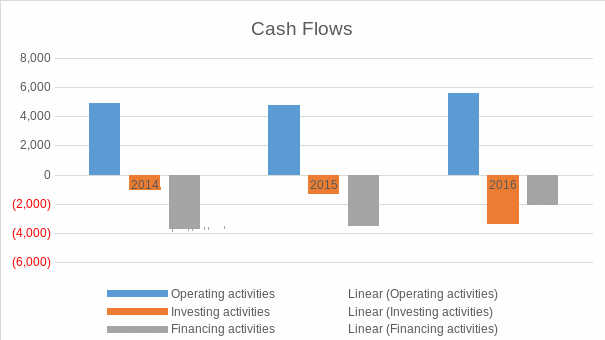
The cash flow statement shows total cash inflows and outflows of a business in the financial period (Robinson, Henry, Pirie, Broihahn, & Cope, 2015; Wahlen, Baginski, & Bradshaw, 2017). The cash flow analysis of Lowe’s showed a positive trend in net cash flows from operations in the last three years. It was due to the increase in net operating assets. On the other hand, the company’s net operating liabilities decreased.
Lowe’s sold its non-performing assets to reduce the financial burden and acquired new assets to generate a high income. The consistent improvement showed that Lowe’s succeeded in managing its financial position in 2016. A similar trend was noticed in net cash generated from investing activities as Lowe’s made new investments in its existing network to generate a higher profit and reduced capital expenditures by limiting the number of new stores in different cities.
The management decision proved to be beneficial because Lowe’s profitability position improved in 2016 due to the company purchased securities. Lowe’s also borrowed an amount from finance providers to manage its long-term investments. The main reason for borrowing was to arrange additional cash that could be utilized to fulfill the obligations of the company within the specified time. The net cash and cash equivalents at the end of 2016 indicated that Lowe’s reported a positive change in its cash position, which is important to reduce the risk of solvency.
Table 7: Cash Flow Statements.
Figure 3 indicates changes in the cash flows from operating, investing, and financing activities in the last three years along with the trend lines for them. The trend lines also show that the company was able to improve its cash flows in three years. However, the main concern discussed earlier is that the company depended on the proceeds from long-term borrowing to compensate for the gap between inflows and outflows. Moreover, it could be indicated that the company benefited from its recent acquisition that is expected to improve its position in the market and generate more income.
Financial Projections
Hypothesis
In this section, the financial analysis of Lowe’s is carried out by analyzing its past financial performance to prepare forecasted financial statements. It could be hypothesized that the financial performance of Lowe’s will improve in the next period.
Disclosures
The annual report of Lowe’s contains important qualitative and quantitative information regarding the financial position of the company for its stakeholders. The company considers cash on hand, cash at bank, and short-term securities as cash and cash equivalent that have the maturity of fewer than three months from the time of purchase (Lowe’s, 2017). The investment component in the balance sheet includes municipal obligations, money market funds, municipal floating rate obligations, and certificates of deposit. The unrealized loss and gains on assets available for sale are recorded net of tax.
Earnings Quality Analysis
Lowe’s sales increased by 10 percent in 2016 in the world market. The management is highly interested in investing in new capabilities and businesses to generate high income. Furthermore, operating discipline and productivity are its core strength (Lowe’s, 2017). Although Lowe’s suffered from inflation and competition prevailing in various international markets, the company made an effort to increase it’s adjusted diluted per share by 21.3 percent in the last fiscal year.
Return and Turnover Ratios
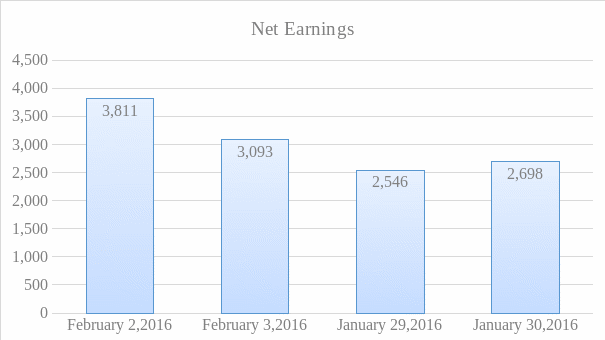
The statement of cash flows of Lowe’s shows net earnings increased to $3,093 million in 2016. The company also managed to lower its loss on property and cost equity method, deferred income tax expense, and share-based expenses in this fiscal year. The management succeeded in arranging net cash of $5617 million from its operations in 2016 (Lowe’s, 2017). Lowe’s acquired a new business in 2016 that substantially contributed to generating higher profit for the company.
The cash investment portfolio of the company indicated that the management took strategic initiatives to improve the company’s net earnings in the last year. Lowe’s also borrowed $3,267 million in 2016 to accelerate its business operations and acquire new businesses in different markets.
Table 8: Turnover and Return Ratios.
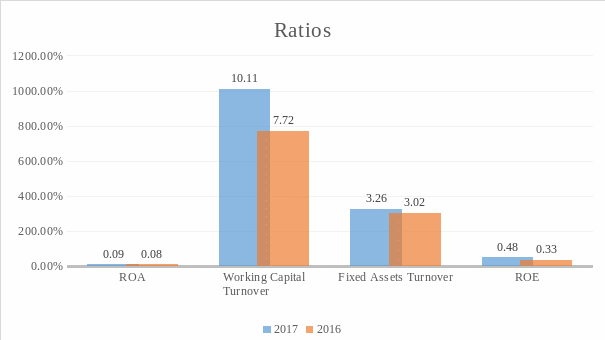
As shown in Table 1, Lowe’s had a slight improvement in its net assets turnover in 2016 as compared to 2015. It showed the company was able to utilize its assets efficiently to generate higher income in the last year. The networking capital ratio’s value also improved in 2016 that indicated the efficiency of the company’s operational management. The improvement in the value of fixed asset turnover also indicated that Lowe’s managed to generate more sales from its property, plant, and equipment that also resulted in higher profits in 2016 than 2015.
The values of ROE indicated that the company increased its earnings per share. However, it could be seen that there was a decline in its total equity. The improvement in turnover and return ratios are also presented graphically in Figure 1.
Steps for Preparing Projected Financial Statements
The preparation of projected financial statements is a critical task that involves an examination of the company’s financial records and analysis of the current business environment. The steps involved in the preparation of projected income statements and projected balance sheets are discussed in the following.
Projection of Sales
The initial step is to make a list of sales that the business made in the last two years. It should also include the determination of customer accounts depending on the plans of the company (Samonas, 2015). The projection is also referred to as forecasting income for the future. In the case of Lowe’s, the projection should follow the trends observed in the past two years.
Estimations of Values of Expenses and Costs
The next step is to determine the expenses and costs that are likely to incur in the future. The preparer should consider the effects of inflation and changes in the amount of cost of goods sold and operating expenses to ensure correct assumptions for forecasting (Wahlen & Baginski, 2014). There should be no bias in calculating the company’s costs and expenses. In other words, there should be reasonable changes anticipated in the company’s costs and expenses for projections.
Determining Financial Needs
This step is important for making projections as it is necessary to determine the sources of finance while preparing projected financial statements (Pignataro, 2013). The financial needs refer to the arrangement of investment that can be utilized to pay obligations, acquisition of new assets, purchase of inventory, and payment of revenue expenditures, etc. However, an existing business may require funds to cover the shortage of cash for managing its operations. Therefore, the projection should also include the estimation of possible borrowing by the company.
External Factors Recognition
The changes in the external environment may have a positive or negative effect on the business (Fletcher, 2016). Therefore, it is essential to determine the risks and opportunities in the market for the company. The preparer of the projected financial statement should consider the growth rate, risks, seasonal effects, and other external factors that directly affect the financials of the company.
Assessment of Projected Financial Statements
Assessment of monitoring is not part of preparing projected financial statements, but it is essential to assess whether the company is performing according to the projection or not (Gupta, 2017). The assessment is also useful in determining if there is a need to change anything depending on the current conditions of the business.
Liquidity and Solvency
Table 9: Liquidity and Solvency Ratios.
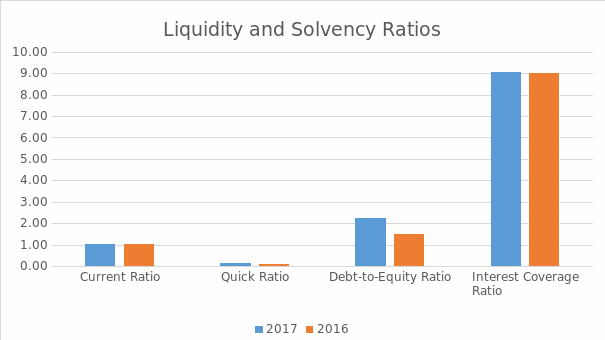
The liquidity position of Lowe’s improved in 2016 as indicated by changes in the values of current and quick ratios. The main reason for the improvement in the value of these ratios was the acquisition of new assets that generated high revenue for the company in the last fiscal year. Furthermore, the company maintained the value of the current ratio in both years by improving its cash and cash equivalent position (Lowe’s, 2017).
However, Lowe’s did not manage its solvency position as indicated by the debt-to-equity ratio is 2016. The debt-to-equity ratio indicated that the company financed most of its valuable assets through debt. Although the company planned to increase its long-term profitability by acquiring a new business, it failed to manage its equity for that purpose. The values of interest coverage ratio showed a slight improvement in 2016 irrespective of the increase in interest expense. The graphical representation is provided in figure 5, which depict changes in the values of these ratios.
Projected Income Statement
The guidance provided in the previous section on preparing the projected financial statements has enabled us to prepare a projected income statement for Lowe’s for the next year.
Table 10: Projected net income for the year 2017-18.
The projected net income shown in Table 10 represents the growth trend observed in the past two years. However, there are other estimations used for preparing the projected income statement for the year to be ended in 2017, which are provided in the following.
- The net sales of Lowe’s are expected to follow the trend observed in the last two years. It is noted that the company’s sales increased by 10% in 2016. However, it is assumed that they will grow by an additional two percent in the next year due to the company’s new acquisition. A similar trend is assumed for the company’s cost of sales.
- The amount of depreciation is also expected to increase as Lowe’s acquired new assets in 2016 that will be included in the accumulated depreciation amount in 2017-18.
- There would be no change in the net interest expense as the company does not plan to borrow any additional amount.
- The rate of income tax assumed for 2017 is the same as in 2016 that is 40%.
The projected income statement of Lowe’s indicates that the company is expected to improve its financial position in the next year. Additionally, the growth trend can be observed in Figure 6.
References
Bodmer, E. (2014). Corporate and project finance modeling: Theory and practice. Hoboken, NJ: John Wiley & Sons.
Fletcher, F. (2016). Solutions: Business problem solving. London, UK: Routledge.
Goel, S. (2015). Financial ratios. New York, NY: Business Expert Press.
Gupta, A. (2017). Project appraisal and financing. New York, NY: PHI Learning Pvt. Ltd.
Lowe’s. (2017). Lowe’s annual report 2016. Web.
Lowe’s company information. (2017). Web.
Lowe’s Cos. Inc. (LOW). (2017). Web.
Lowe’s SEC filing 2015. (2016). Web.
Lowe’s SEC filing 2016. (2017). Web.
Pignataro, P. (2013). Financial modeling and valuation: A practical guide to investment banking and private equity. Hoboken, NJ: John Wiley & Sons.
Procházka, D. (2016). New trends in finance and accounting: Proceedings of the 17th annual conference on finance and accounting. New York, NY: Springer.
Robinson, T. R., Henry, E., Pirie, W. L., Broihahn, M. A., & Cope, A. T. (2015). International financial statement analysis.. Hoboken, NJ: John WIley & Sons.
Rowe, A. (2017). Is Lowe’s Companies Inc’s (LOW) balance sheet a threat to its future?. Web.
Samonas, M. (2015). Financial forecasting, analysis and modelling: A framework for long-term forecasting. Hoboken, NJ: John Wiley & Sons.
Wahlen, J. M., & Baginski, S. P. (2014). Financial reporting, financial statement analysis and valuation. Mason, OH: Cengage Learning.
Wahlen, J., Baginski, S., & Bradshaw, M. (2017). Financial reporting, financial statement analysis and valuation. Mason, OH: Cengage Learning.
