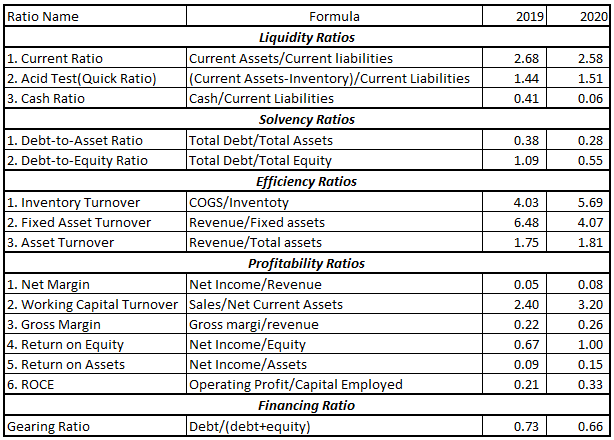
The table below outlines the financial ratios computed from Maxway’s financial statements for 2019 and 2020. The ratios are classified into specific groups for simplicity of reference to enable a quick comparison between the two years. This section explores each of the computed ratios and offers an interpretation of the ratios in connection with the company’s financial performance. It will be possible to discover how the company performed in 2020 compared to its financial health in 2019.
Liquidity Ratios
Liquidity ratios are indicators of a company’s ability to settle short-term liabilities as they continue to fall due. They are important ratios since they give an overview of a company’s ability over short-term liabilities, such as debts that are payable in less than 1 year (Chiaramonte and Casu, 2017). Liquidity ratio shows the ability of a company to pay its suppliers, making the ratios crucial for both internal and external stakeholders.
Current Ratio
The current ratio for Maxway in 2020 was 2.58 and 2.68 in 2019. For this ratio, the outcome of the computations indicates that the company could be doing well in regards to its ability to cover its short-term liabilities. These rates are higher than the market average for other companies in this industry.
Quick Ratio
Maxway’s quick ratios were 1.44 and 1.51 for 2019 and 2020 respectively. The acid test ratio eliminates the impact of inventory in the computation and is, therefore, more reliable in deciding as to the financial performance of the company. The market average rates for other similar companies were 1.2 in these years. This fact indicates a high capability of Maxway to meet its current liabilities.
Cash Ratio
The cash ratio is a metric that depicts how much cash a company has and other short-term assets can be turned quickly into cash. These are the most liquid assets in the company. Maxway’s cash ratio was 0.41 and 0.06 in 2019 and 2020 respectively. In 2020, the amount of cash available for disposal was less than in 2019 resulting in a smaller ratio. The cash ratio values indicate the company’s weakness due to a lack of absolute immediate liquidity.
Solvency Ratios
These are ratios that measure the ability of a company to meet its long-term obligations when they fall due. Long-term liabilities are debts that are payable in more than 2 years.
Debt-to-Equity Ratio
This ratio compares total long-term debt to total shareholders’ equity. The ratio in 2019 is above 1 but in 2020, the ratio is 0.55. It means that the company engaged in less long-term financing in 2020 compared to 2019. There were no changes in the shareholders’ equity between the two years. The drop in the ratio could be a good indicator since sometimes long-term financing can be very costly.
Debt-to-Asset Ratio
The debt to asset ratio for Maxway in 2019 and 2020 was 0.38 and 0.28 respectively. Total assets in 2019 were more due to a greater value of current assets. In 2020, non-current assets were more in value but the current assets had reduced significantly.
Efficiency Ratios
Inventory Turnover
Inventory turnover depicts the number of times a company replenishes its inventory due to sales. In 2019, the ratio was 4 while in 2020, the ratio was 5.69, an improvement from the previous year. These ratios suggest that Maxway is doing well in matters of inventory management and sales in the market.
Fixed Assets Turnover
This ratio represents the value added by fixed assets in the creation of Maxway’s revenues. The rate for 2019 was 6.48 and 4.07 in 2020, indicating a downward trend since there were more purchases of fixed assets in 2020 while the revenue remained fairly the same. It means that the fixed assets purchased in 2020 did not directly contribute to a boost in revenues.
Asset Turnover
Asset turnover ratio represents the contribution made by all assets in the creation of revenues in a particular year. Their ratios of 1.75 and 1.81 for 2019 and 2020 suggest an improvement in inventory management strategy. More inventory was converted into revenue in 2020 which is an indicator of strength.
Profitability Ratios
Net Margin Ratio
Net margin ratio projects how much of the total revenues end up as free cash flows in a particular financial year. The ratios for 2019 and 2020 are 0.05 and 0.08 respectively. Although there is a slight improvement in 2020, the ratios are still below average and more strategies are needed to ensure that costs do not outweigh revenues.
Working Capital Turnover
Working capital turnover ratios of 2.4 and 3.2 in 2019 and 2020 respectively were very promising for Maxway. They indicate Maxway’s appropriate management strategies in working capital management to boost revenues. The company’s working capital is well utilized to improve revenues.
Gross Margin Ratio
The gross margin ratio in 2019 reveals a weakness in the management of the cost of goods sold. The market average for 2019 and 2020 were 25% while Maxway has 22% and 26%.
The sales revenues in 2019 are more than those of 2020, but the year 2019 has a smaller gross margin ratio. This fact means that there is a gap that needs to be managed to further plan and minimize the cost of goods sold to boost the gross margin.
Return on Equity
Maxway’s return on equity ratios are good, with 0.67 and 1 in 2019 and 2020 respectively. The company is doing great in this aspect and can easily get equity financing if need be since investors look at a company’s potential to grow.
Return on Assets
Maxway’s return on asset ratios are 9% and 15% in 2019 and 2020 respectively. These ratios indicate the net income generated compared to the total assets used to produce the revenues. These values are reasonably high and indicate strength and great potential in the company.
Return on Capital Employed (ROCE)
Return on capital employed is a development of the return on assets ratio since it eliminates the effect of short-term liabilities. It explains the contribution of long-term debt and equity to the profitability of the company. A ratio of 21% and 33% in 2019 and 2020 respectively is a good indication since the market average was 10% and 12% in 2019 and 2020.
Gearing Ratio
The gearing ratio is a projection of how much of the capital employed is debt since it compares debt and equity. Debt financing in 2019 was 73% and 66% in 2020 since there was a decrease in debt financing in 2020 while there was no change in equity. Market average rates were 15% and 20% in 2019 and 2020. There is a decrease in debt financing in 2020, but these ratios reveal a high debt capitalization in Maxway and could push the company into insolvency.
EcoBox Proposal
The EcoBox proposal presented a financial decision-making opportunity for the management team to choose between the card boxes’ way of transportation and the use of EcoBoxes. The tables below show the applicable cost per month for each alternative for comparison purposes. The shipping frequency in the target markets for the bikes is different per month with the Americas having an average of 4 trips while Europe and Oceania have 5 trips. However, for simplicity of computations, it has been assumed that in all these regions, the boxes make 4 trips and are returned to Taiwan to be refurbished.
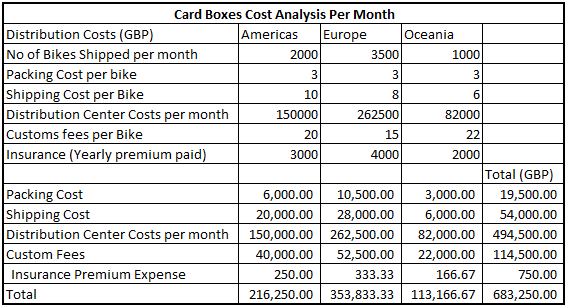
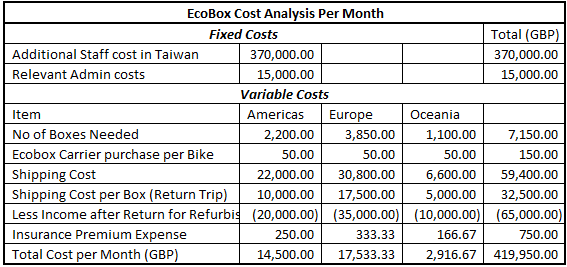
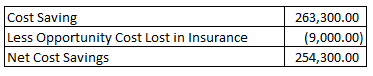
The total cost resulting from the use of card boxes amounts to 683,250 GBP per month while the total monthly cost associated with the EcoBox is 419,950 GBP per month. There is a difference of 263,300 GBP which represents the cost-savings that can be achieved if the company switches to EcoBox. The amount of cost to be saved corresponds to a 39% decrease in monthly cost incurred in logistics processes of getting the product to the market. The cost allocation per month concerning the insurance premium was achieved by dividing the total cost per region by 12 months.
A further consideration was given pertinent to the insurance premiums that had already been paid. The insurance cost for the card boxes model had been cleared for a whole year. The total amount of the insurance policy was 9,000 GBP and this insurance cover would be lost should the company switch to the use of EcoBoxes. The opportunity cost lost shall be 9,000 GBP with an assumption that a new operational year has not yet commenced. For simplified computations, it was assumed that the company was in the process of budgeting and planning to make decisions that shall be applied at the start of the next year’s operations. It was assumed that the company paid for the insurance cover in advance as it is supposed to be to avoid any inconveniences should they decide not to work with the EcoBox alternative.
The next cost savings were found to be 254,300 GBP after taking out the cost of the insurance cover that shall be lost. Apart from the cost-saving advantage, the company is about to experience when using the EcoBox, the issue of sustainability is something that should be considered. The EcoBoxes can be recycled unlike the card boxes that will have to be repurchased and continued use of plant-based products could result in climatic issues. The management team of the company should, therefore, consider switching to the EcoBox shipping solution to benefit from reduced costs and to contribute to positive corporate responsibility in sustainability goals. As a result, Roadstar should adopt the innovative EcoBox packaging system to minimize distribution costs and boost profitability.
Product Profitability-MB93
The product MB93 has current sales units of 85 pieces that yield a negative profit of 1,750 GBP. Compared to MB80 and MBX Pro, this performance is not appealing since these two brands have posted a positive profit after allocation of the fixed costs. The table below represents the preliminary computations that yielded those results.
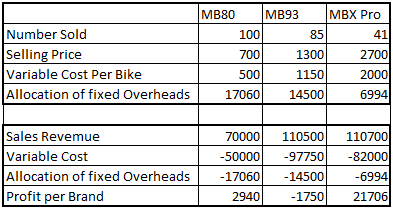
MB93 has indeed posted a loss after the sale of 85 units. However, from a deeper perspective, this information is not adequate to make a final decision of stopping the manufacture of the brand. By exploring the CVP analysis we can find out the break-even point of this brand. At break-even, the profit is equal to zero since there is neither loss nor profit.
Profit=Revenue-Total Cost (Variable+Fixed Cost)
Profit=(P.x-V.x)-F
Whereby x=Number of units sold, P=selling price, V=variable cost, and F=fixed cost
Profit=(P-V)x-F
At the break-even point, P=0
0=(P-V)x-F
Therefore, F=(P-V)x
For MB93 P=1300 and V=1150
Therefore, F=(1300-1150)x=150x
F=14,500=150x
X=97 units
This computation assumes that the fixed cost allocated will not change and shall, therefore, be 14,500 GBP. At this level of fixed cost, 97 units are needed to be sold to reach the break-even point for the MB93 bike brand. However, this assumption cannot give accurate computation results considering that an increase in the number of units sold would attract an increase in the allocated fixed cost. This fact leads to another assumption that the other two brands’ units sold should be maintained at 100 and 41 for MB80 and MBX Pro respectively. Then MB93 brand should be sold more to discover how many units need to be sold such that this brand becomes profitable. Sensitivity analysis from Excel gave the following results as presented in the table below.
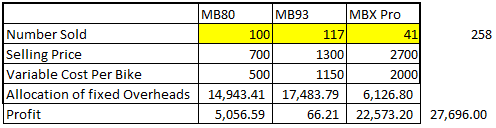
The true break-even-point for MB93 assuming constant sales in MB80 and MBX Pro is 117 units. To achieve this, the company needs to create a strategy to sell 32 more units of BM93 product. With a proper marketing strategy, this can be achievable although the sales units for the bike brands seem to have a reverse relationship with the product price level. Looking at the overall profitability, if the company would stop manufacturing and selling MB93 the fixed cost would be too overwhelming to be covered by the remaining two brands and the result would be lower profitability. If it is not viable to improve the sales units of the bike brand, the company should consider other ways of minimizing the controllable costs such as outsourcing the manufacturing process of all or some of the parts. Roadstar should focus on managing the controllable costs by making the production process more efficient and by minimizing wastage.
Investment in Aspire Apparel Ltd
Accounting Rate of Return
The following table is a presentation of the net profitability of Aspire Apparel Ltd over the next 5 years. The initial investment is 3,500,000 GBP and the investors’ required rate of return is 20%. The IRR is a rate that can be used to gauge the viability of a project before investors put in their funds. It evaluates the risk and return of a project for investors to determine whether the project’s risk is worth taking given the projected returns.
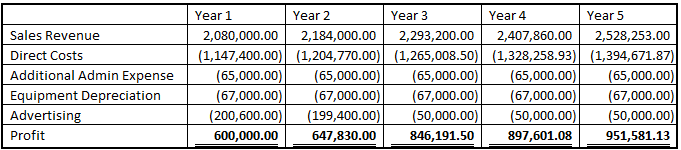
The computed IRR given these values is 4% which is way below the required rate of return by the investors. Based on this evaluation criterion, the investors shouldn’t undertake this project at that value.
Payback Period
The payback period does not factor in discounting but instead focuses on how fast the initial investment can be paid back. The initial investment would be 3,500,000 GBP at the inception of the project. At the end of year 4, the project would not have returned the money invested at year 0 as shown in the table below. A balance of 508,377.43 GBP will have remained to be covered in the fifth year. This amount can be apportioned based on the profit to be earned in the 5th year to find out the proportion of the year it shall take to pay the initial investment fully. The payback period is only concerned about the length it would take to pay back the initial investment is not concerned with the time value of money (Pike & Neale, 2018).
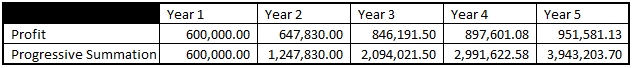
It would take 4.53 years to fully recover the initial 3,500,000 that is estimated as the required amount to buy off the company. The required payback period as a tool for decision-making depends on the investors. In this case of Aspire Apparel Ltd’s proposed purchase, it has not been stated clearly how long the investors would prefer as their payback years.
Net Present Value
The net present value was computed using the given 12% discount rate and 3,500,000 as the initial investment. As shown in the table below, the resultant net present value was negative.
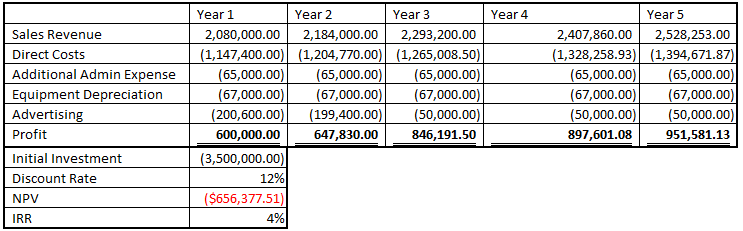
A negative value of NPV is an indication that the project has less profitability for the level of investment it requires. The NPV is a strong and more reliable metric than the payback period since it considers the time value factor of money. Through discounting, it returns the present value of future cash flows into their current values. A summation of these current values is used to subtract the initial investment to achieve the NPV value.
As suggested in the valuation metrics discussed above, this project has weaknesses in the level of profitability considering the amount of investment it requires. It would be a less optimal decision for the management of Roadstar to acquire this company at the stipulated value. If possible, there should be negotiations to acquire the company at its value of $2,843,622.5.
The Value of Budgets
Budgets are important tools that can be used in any organization to foster continuous improvement of business at different levels. Budgets are important not only for financial purposes but also for other non-financial matters that need to be kept in check (Pike & Neale, 2018). In this section, the paper shall review the various uses and applicability of budgets and how Roadstar management can improve its budgeting process.
Budgets as Source of Trend Data
The use of technology such as Excel’s data analytic tools can reveal certain patterns of interest in historical data. From what is presented, Roadstar company has not made appropriate and adequate use of technology to delve into its historical data. Specific analysis of historical information could lead to the discovery of trends such as an increase in costs at certain times of the year. It could also enable the appropriate use of data analysis for decision-making by the top management of Roadstar company.
Through trend analysis, historical data can reveal risks that the management was not aware of. These risks include the creation of over-ambitious plans for the next financial year due to the formulation of unachievable goals through the budgets. Every year is unique, and the way Roadstar has been managing the budgeting process does not reflect new trends such as inflation and foreign currency exchange rates. As a result, the budgets created this way may be less meaningful and might not communicate reasonably to the rest of the organization.
Technology enables users of data to avoid tedious manual computations that are prone to human errors. Technological advancements have evolved to enable the use of financial modeling for managerial decision-making. Decisions that are made from an informed position due to data exploration can be more objective than those that are based on past experiences and intuitions. For instance, the fact that Roadstar wanted to purchase Aspire Apparel Ltd based on what seemed to be high annual profitability would have been a less optimal decision. Further analysis of the data indicated that the company was not worth an investment of 3,500,000 GBP.
Budgets as tools for Operational Efficiency
Budgets can be used in the operations department to set important goals in the production process. For instance, companies like Roadstar can use the power of analytics to define optimal production levels per machine. These goals can then be transferred downwards to find out what other factors are needed to be fulfilled to achieve them (Proctor, 2012). Other factors that determine operational efficiency are employee morale and the age of the manufacturing plants. Operational efficiency decisions can involve the replacement of an old plant with a new model that is cost-effective in terms of power consumption.
Operational budgets can also help to choose between competing alternatives in the distribution channels to be used by a company. An example of such a decision is the case of Roadstar’s dilemma on whether to continue packaging the bikes in card boxes or to proceed with an innovative EcoBox model. Through analytic comparison, the results indicated that the choice to use the EcoBox solution would not only lead to huge cost-savings but was also an optimal decision since it supported sustainability.
The Importance of Forecasting
Forecasting enhances the projection into the future by laying a foundation of what is known and what can be assumed. Financial data can easily be mapped and used to project unknown data by use of technological advancements. Sometimes managers are faced with the challenge of deciding in the current period, yet the factors under consideration extend into some unforeseen periods. The case of Aspire Apparel is one of those examples that use some reasonable assumptions and current information to forecast the financial developments of the company in the future.
Revenues and costs can be forecasted to support decision-making about the future. A company can decide the purchase price of another target corporate by projecting the financial reports of the latter. This process helps an acquiring company to make an informed decision and avoid purchasing the target company at a very high that might not be recovered any time soon.
Budgets as Internal Control Tools
Budgets can be used to control processes such as expenditure in a given financial year. Expenditure categories are allocated reasonable values, and the teams managing those processes are expected to keep in mind the budgeted values for their expenditures. Any negative deviation is investigated, and control measures are undertaken to ensure that the company maintains acceptable costs at every level.
Cost control is very important since it determines the overall profitability of a company. Assuming a company can make huge revenues but cannot control the costs accordingly, that organization would report fewer profits than another company with strict adherence to cost control. That is why budgets should be used as control tools to foster continuous growth in profitability by maximizing revenues and minimizing costs.
Budgets to Foster Customer Experience
Some budgets may not necessarily be financial, but they might have a very strong impact on the affairs of a company. These budgets can be in the form of qualitative metrics that measure or direct employees to perform better to make the customers more satisfied. Customer experience is crucial and can be determined by simple factors such as how the relevant employees communicate to them or respond to their queries. Metrics such as the speed of response and accurate know-how of product information place customer service agents in a position to deliver outstanding customer experience.
Key performance indicators are ways that can be used to make employees be motivated to own their work. They are metrics that can be measured and gauged to specific standards upon which employees can know how they performed. For instance, customers can be asked to rate their experience in every outlet out of 5 stars. This is a non-financial standard that can have an impact on the financial performance of the company. Outstanding employees should be rewarded upon meeting or exceeding the set standards. Such rewards can be very motivating for other employees to desire to work hard to receive those gifts like their colleagues. Sometimes appreciation of employees can be non-financial such as the public recognition during special company days.
Budgets as a Tool for Inclusivity
Budgets can be a source of strength in an organization since they can be used to bring employees together. The budgeting process should be designed in a way that communicates the purpose of the company to the employees. It should be done in a way that allows employees to participate because their contributions are crucial to the company. Their commitment to the budgeting process could be reflected in their passion for doing their work to exceed expectations.
Middle-level managers had complained that they were not being involved in the budgeting process since the top management would issue already formulated budgets to them. They felt left out and less valued by the organization they work for, and that alone can be a source of demotivation. Top-level management should not dictate budgets to the rest of the teams but should invite them to share their views and harmonize all opinions into the budget.
Involving employees in budgeting makes them responsible for the goals that are defined in the budgets. A budget requires the input of such stakeholders like employees, and without their strong personal commitment, the organizational strategy cannot be actualized. The top managers should start sourcing for information from low levels of the organization upwards. At the operational groups or sections, the employees understand issues about that level better than the organization. The top management can set goals that are easily achieved when employees can do more. Likewise, a budget can be too ambitious only for the management team to realize.
Reference List
Chiaramonte, L. and Casu, B., (2017). ‘Capital and liquidity ratios and financial distress. Evidence from the European banking industry’. The British Accounting Review, 49(2), pp. 138-161.
Pike, R., & Neale, B. (2018). Corporate finance and investment: decisions & strategies. Pearson Education. Web.
Proctor, R., (2012). Managerial Accounting: Decision Making and Performance Management. FT Press. Web.