Introduction
With an increasing trend towards globalization of business, both Coca-Cola and Pepsi, the largest world’s largest beverage and snack-food companies have been taking strategic approach to expand their markets, despite an increasing competition from new market entrants as well as local companies in foreign nations. The competition between the two organizations remains one of the strongest in the global business arena.
As the two continue to compete with each other as well as the threat of new market entrants, it is worth making an in-depth analysis of their global market share. The purpose of this paper is to develop a comprehensive analysis of the global market share that the two companies hold in order to determine the level of their performance as well as their future financial health.
Market analysis for Coca-Cola versus Pepsi
Corporate history
Based in Atlanta, Georgia, the Coca Cola Company is an American multinational corporation that specializes in snack-food, soft drink, syrup and nonalcoholic beverages. An American pharmacist and Civil War soldier John Pemberton, who was injured during the civil war, is accredited with the idea of starting the company (Wayland & Porter, 2011).
Obsessed with opiates, Pemberton formulated a Coca-Cola as a recipe of the opiates, which was launched at his Eagle Drug and Chemical House, a drugstore he was running in Columbus, Georgia. By 1885, Pemberton had registered the French Wine Coca as a corporation. However, he was forced to change to nonalcoholic business when the Fulton and Atlanta Counties decided to pass and enact the prohibition laws in 1886 (Wayland & Porter, 2011).
In 1888, the company sold a third of its interest to young drug specialist named Asa Griggs Candler, who became one of the future founder of the Coca- Cola Company (Wayland & Porter, 2011). In the 20th century, the company carried out a number of strategies to enter the world market. By 2000, the company was already selling its products in all continents (Mitchman & Mazze, 2012).
Like Coca Cola, Pepsi started at a drugstore owned and operated by Caleb Bradman, a pharmacist in New Bern, North Carolina. By 1903, Bradman had moved the company to a rented house and was making selling more than 7,000 gallons of the syrup (Wayland & Porter, 2011). Between 1900 and 1930, the company increased its sales, which enhanced its growth. However, the great depression of the 1930s saw the company undergo bankruptcy due to the financial losses it incurred from the fluctuating sugar prices during the First World War (Wayland & Porter, 2011).
Products and services: A comparison between Coca Cola and Pepsi
Products
Currently, both companies are involved in beverage and snack soft drink industry. While Coca Cola ranks above Pepsi as the world largest soft-drink maker in the world, Pepsi ranks number one as the largest maker of snacks. Over the years, both companies have retained a flagship product as the main corporate sales strategy. While the Coca Cola Company has retained the Coca-Cola product, Pepsi has retained the Pepsi brand as its flagship product. However, both corporations have diversified their product lines, including a variety of brands, especially in the soft-drink industry (Dhar, Chavas, Cotterill & Gould, 2012). For instance, the Coca Cola Company heads Pepsi in terms of product lines. In addition to its Coca-Cola flagship product, the company also sells the Fanta and Sprite soft drinks, which are sold in all parts of the world. Moreover, the company’s list of products is large, especially because it produces different brands for different countries or regions (Wayland & Porter, 2011).
On its part, Pepsi has a large product line that is shared equally at 50% healthy food products and 50% beverage products. For instance, Gatorade, Tropicana, and Quaker food operations are the flagship healthy food products while Pepsi-Cola, Mirinda, 7Up and Naked Juice being the major soft drink and beverage products.
Services
Although the companies are food processing and manufacturing organizations, they also provide a few numbers of services. For instance, both companies have been providing supply and distribution services to a number of organizations, their distributors and retailers
Major customers: Pepsi versus Coca Cola
Both organizations are multinational corporations specializing in the same industry. Both companies started with the American market before rolling out their products to other regions. Both companies recognize a number of factors when venturing into a new market or when developing new products (Dhar, Chavas, Cotterill & Gould, 2012). For instance, the factors of age, financial status of the target market, tastes and preferences are well considered. At Pepsi, there is a long history of targeting the low-end market in any society, which started in the US during Mack’s tenure (Dhar, Chavas, Cotterill & Gould, 2012).
Mack realized that the black people were an untapped market, which Coca Cola and other companies had been ignoring. The strategy proved to be a success and spurred the company’s growth. Currently, the company is targeting all people in the world market (Wayland & Porter, 2011). However, some products under the “better for you” category are developed to target individuals with health problems or people who are concerned of their health. They include sugarless soft drinks and snacks as well as water and fruit juices.
This strategy is also used at the Coca Cola Company, where sugarless products, water, juices and sugarless snacks are becoming popular (Wayland & Porter, 2011). For instance, in the recent past, the two companies have focused on Chinese and Indian markets, hoping to achieve revenue from the large populations in these nations. Pepsi has been making special brands to meet the Indian and Chinese demands.
For example, special brand names are given to products exported to these countries to ensure that they fit the local market (Dhar, Chavas, Cotterill & Gould, 2012). On the other hand, Coca Cola has been embarking on price as the strategy for venturing in the second and third world nations. For instance, the company has been selling its brands at a lower price in Asia and Africa than its product prices in America and Europe. This ensures that its products fit the low-end markets common in these regions.
Major suppliers: Pepsi versus Coca Cola
Both companies specialize in food and beverage industry, which heavily relies on suppliers. Specifically, the industry relies on ingredients, machinery and packaging. Sugar and fruits are some of the most important ingredients that the two companies purchase from farmers and organizations dealing with production and supply. For instance, Coca cola heavily relies on sugar imported from South American nations such as Brazil, Guatemala and Colombia for its soft drinks (Wayland & Porter, 2011).
The company disclosed that it deals with Copersucar Sugar and Usina Trapiche of Brazil, the Mitr Phol Corporation of Thailand and the Dangote Sugar Corporation of Nigeria as its main sugar suppliers in the Americas, Asia and Africa respectively. On the other hand, Pepsi has a contract with Usina Trapiche of Brazil and a number of other companies in Thailand, Malaysia, Indonesia, India and Mexico (Wayland & Porter, 2011).
Leadership: Cola versus Pepsi
The leadership approaches and structures at both Coca Cola and Pepsi are relatively similar, given the fact that they deal with the same industry. However, differences in corporate leadership are seen in the approaches used to manage corporate affairs, especially in marketing. For instance, product management, geographic breakdown of revenue and valuation management are relatively different in the two companies. Pepsi’s product management focuses on splitting down the revenue down the middle, with food and beverages contributing to 50% each (Dhar, Chavas, Cotterill & Gould, 2012). On the other hand, the management at Coca cola generates more than 90% of revenue from beverages (Dhar, Chavas, Cotterill & Gould, 2012).
Stock price trends: Cola versus Pepsi
Noteworthy, while the Initial Public Offer (IPO) for Coca Cola was offered in 1919, Pepsi was first publicly traded in 1978.on the initial offering date, share prices at Coca Cola stood at $40 per share while those of Pepsi stood at $1.49 per unit. However, between 2010 and 2014, the trend has changed significantly as shown, with Coca Cola’s stock price reducing significantly.
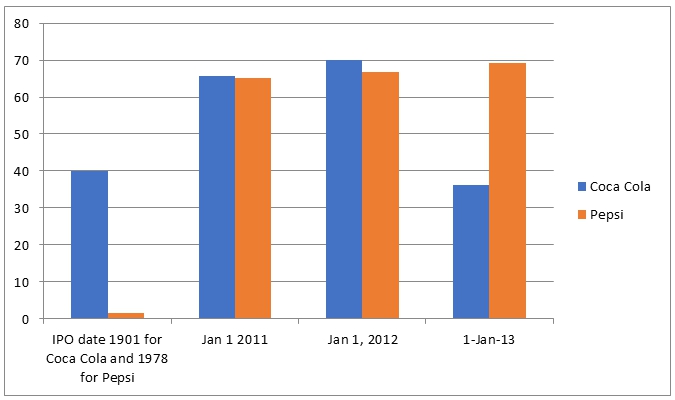
This trend shows the differences in the stock price in the last three years as well as how the companies traded during their IPO dates. It is worth noting that the companies have been gaining in terms of stock price since their first IPO. However, the last three years shows Coca Cola’s stock prices decreasing, while those of Pepsi remains constant. Thus, if other factors are held constant, it is advisable for investors to consider investing in Pepsi as opposed to Coca Cola.
Recent News Events affecting the corporations
In 2013, Oxfam released report that accused Pepsi and Coca Cola of perpetrating human injustices in the developing world (Merrill, 2013, p. 17). The two companies, together with Associated Food of Britain (ABF) were accused of purchasing sugar from companies that grabbed public, community and individual land in a number of nations. For instance, Coca Cola was accused of buying sugar from companies that had been involved in grabbing land from individuals in Cambodia, Thailand, Africa and India. Some of the accused companies include Tate and Lye of Cambodia and Ilolovo, a subsidiary of ABF that operates in Africa (Merrill, 2013, p 17).
According to the report by Oxfam, these companies were not directly involved in the injustices, but their greed for more sugar made the local suppliers develop a desire to increase their sugar supplies, which resulted into the need for more land. With poor laws on human rights and land ownership as well as corruption, these countries allow corporations to involve in such injustices with little concern.
Although these accusations are not likely to have an immediate impact on the corporate performance at Pepsi and Coca Cola, it is worth noting that the companies will be forced to cut their relationships with the accused suppliers if the Oxfam allegations are confirmed. Therefore, they are likely to lose a significant volume of their sugar imports, which will also affect their productivity and performance.
Secondly, the Coca Cola company as accused of illegal mapping in southern China. The Chinese authorities argued that the company has been using GPS devices to map some parts of the Yunan Province, an illegal act that could result into penalties (Burkitt, 2013, p. A12). If the allegations are confirmed, it is possible to cause decline in the company’s sales made in the country.
On the other hand, Pepsi has been accused of using aborted fetal cells from humans in its search for new ways of enhancing food flavor (Richardson, 2012, p. A12). Although the company has denied the allegations, it is still under investigation. If the allegations are confirmed, the company is likely to suffer a bad public image. This has the potential of increasing Coca Cola’s competency and reduces Pepsi’s sales and performance.
Financial analysis: Coca Cola versus Pepsi
Figure 2: Financial ratio analysis for Coca Cola, 2010 to 2013.
Figure 3: Financial ratio analysis for Coca Cola, 2010 to 2013.
Overall, Coca Cola has a relatively stagnant but strong financial health, which is indicated by its profitability ratios over the last four years. For instance, in 2010, the company’s gross margin stood at 64% but reduced by three digits in the consecutive years. In 2013, the ratio was 61% after gaining a single digit from the previous rating of 60%. In addition, the overall profit margin decreased from 34% in 2010 to about 18% in 2011. Since then, it has remained stagnant at an average of 18.5%.
What the impacts of the ratios?
The impact of an increasing rate of the level of profitability, as determined by the profit margins, is a clear indication that the company is able to utilize its assets to enhance performance. It is an indication that the company’s business is reaping profits. In turn, it is an indication that the company is able to increase the value of its shareholders. Both have this characteristic.
Similarly, the profitability ratios of Pepsi indicate that the company has a relatively stable financial health. For instance, the company’s gross margin has stagnated at an average ratio of 53% since 2010. In addition, the profit margin has stagnated at an average rating of 10% since 2010. This is an indication that the company has a good financial health although it is not achieving the desired growth.
Reliability of using data in making investment decisions
The reliability of financial analysis of corporate performance in investment decision-making is an important topic of debate. It is evident that the financial analysis, especially using ratios, is highly accurate because it attempts to examine the corporate performance using the relevant data. It allows the investors to determine the status of the company in terms of profitability, liquidity and solvency.
The investors are able to determine the future of the company. However, it is worth noting that these methods rely on pure statistical inference, which makes it difficult to examine other aspects of the company such as public reputation, corporate social responsibility (CSR), current activities and the environmental and economic conditions of the industry.
Recommendations
The data analysis shows that both Pepsi and Coca Cola have positive financial health. For instance, their profitability, liquidity and solvency ratios indicate that the companies are moving in the right trend. It is also evident that their profitability is stagnating, yet they are making good profits every year. However, Coca Cola has been declining its stock price in the last few years. Thus, investors are recommended to consider investing in Pepsi.
References
Burkitt, L. (2013, March 13). China Accuses Coca-Cola of Illegally Using GPS. The Wall Street Journal, p. A12.
Coca-Cola Enterprises Inc. (2014). Reports fourth-quarter and full-year 2013 results.
Dhar, T., Chavas, J. P., Cotterill, R. W., & Gould, B. W. (2012). An Econometric Analysis of Brand‐Level Strategic Pricing between Coca‐Cola Company and PepsiCo. Journal of Economics & Management Strategy, 14(4), 905-931.
Merrill, J. (2013, Oct 2). Oxfam accuses Coke and Pepsi of taking land from the poor. The Independent UK, p. 17.
Mitchman, R., & Mazze, E. M. (2012). The Food Industry Wars: Marketing Triumphs and Blunders. New York, NY: Greenwood Publishing
PepsiCo. Inc. (2013). Annual Reports and Proxy information.
Richardson, V. (2012, March 28). PepsiCo denies accusations on link to aborted fetal cells. The Washington Times, p. A12.
Wayland, R., & Porter, M. (2011). Coca-Cola versus Pepsi-Cola and the Soft Drink Industry. Cambridge, MA: Harvard Business School.