Abstract
Sharjah Islamic Bank is one of the prominent financial institutions operating in the U.A.E. banking industry. The bank started as a conventional bank and later converted into an Islamic bank. The bank has a long history of great strategy and success. The financial analysis performed in this report includes a review of financial statements and key performance indicators (KPIs). The analysis indicated that the bank recovered strongly after the financial crisis period in 2008. The bank’s profitability increased along with its total assets. The bank’s main assets include financing receivables and leased assets. It indicated that the banks had a diverse pool of clients, and it mitigated its risks effectively. The only concern regarding the bank’s performance was the increase in its non-performing loans in the last four years. The bank had strong capital adequacy, and it could be concluded that it is unlikely to face any major issues in the next accounting period.
Introduction
Sharjah Islamic Bank is a leading Islamic bank that is headquartered in Al Khan, Sharjah, U.A.E. Since 1975, the bank operated as a conventional bank. The bank achieved growth in its early years by offering traditional services and fulfilling the need for banking services in Sharjah and other states of the U.A.E (Sharjah Islamic Bank – (SIB), 2016). The management comprised of highly skilled and knowledgeable individuals who carefully planned the strategies of the bank. These strategies helped the bank to generate equity and become a successful entity. It went through a complete transformation of its business processes and principles to become the first conventional bank that changed its status to Islamic banking in 2002 (Sharjah Islamic Bank – About Us, 2016).
The bank provides excellent customer services and products to serve the Islamic banking needs of its customers. The bank offers services in retail banking, corporate banking, investment banking, and real estate management. The core business values of the bank are “bonding and harmony, compliance learning and self-development, social responsibility, and creativity and innovation” (Sharjah Islamic Bank – Our Values, 2016). The bank’s financial statements and internal control system and records for the year ended December 31, 2015, were audited by KPMG Lower Gulf Limited (Sharjah Islamic Bank – Director’s Report and Consolidated Financial Statements – 2015, 2015).
The Directors’ Report of Sharjah Islamic Bank indicates that it is structured as a parent company holding several subsidiary companies that are providing Islamic financial services to a wide range of customers in different sectors of the Middle Eastern market. The bank’s financial performance improved in 2015 as the total assets increased by AED 3.9 billion. The bank credit activity also showed an improvement as it reported 16.2% increase in the customer deposit, and its receivables increased by 13% (Sharjah Islamic Bank – Director’s Report and Consolidated Financial Statements – 2015, 2015). The bank also issued Islamic Sukuk of $5.1 billion for financing its major corporate clients (Sharjah Islamic Bank – Director’s Report and Consolidated Financial Statements – 2015, 2015).
The objective of this report is to evaluate the financial performance of the Sharjah Islamic Bank by considering the values of Key Performance Indicators (KPIs) from 2009 to 2015. The key indicators included in this report include Equity/Asset (%), Leverage (%), Net Profit Margin (%), Return on Assets (ROA), Return on Equity (ROE), and Capital Adequacy Ratio. The data of these indicators was collected from different reliable sources. It includes a financial data website, Gulf Base, and the bank’s annual reports that are available on its website. The formulas of key performance indicators included in the analysis are provided in the following.
- Equity Assets (%) = Total Equity / Total Assets.
- Leverage (%) = Total Liabilities / Total Equity.
- Net Profit Margin = Net Profit / Total Income.
- Return on Assets = Net Profit / Total Assets.
- Return on Equity = Net Profit / Total Equity.
- Capital Adequacy Ratio = (Tier 1 + Tier 2) Capital / Risk-weighted Assets.
The analysis in this report is also supported by the evaluation of the financial performance over the years, as reported by the bank in its financial statements. Furthermore, the report provides a breakdown analysis of ROE that is performed by using DuPont analysis. The DuPont analysis investigates the bank’s ROE by breaking it down into three components, including net profit margin, asset turnover, and equity multiplier.
Literature Review
Luo (2016) states financial ratios are the main indicators of the overall performance of a bank. There are many types of ratios that can be used to measure or assess the performance of a bank in the past (Luo, 2016). Lai ping-fu & Cho kwai-yee (2016) explains that determining the leverage position of a bank is important and mandatory for measuring its performance. The leverage ratio determines the capital structure of a bank. The ratio is used to assess the ability of a bank to meet its financial obligations. The determination of the ability of a bank to pay its liabilities or debts is important for an investor (Lai Ping-fu & Cho Kwai-yee, 2016).
Mathew (2015) also highlights the importance of the leverage ratio by highlighting that a company may borrow a high amount of loan or debt to finance its projects. The feasibility of the project depends on the capital structure of the bank, which is determined by the combination of debt and equity used to finance its projects. The leverage ratio is an effective tool to determine the portion of the capital that is in the form of debt (Mathew, 2015)
Mathew (2015) highlights the asset to equity ratio is also mandatory in assessing the performance of a bank. The asset to equity ratio represents a net amount of percentage that shareholders have an enduring claim on the bank. The ratio is significant for a bank to assess whether it has potential assets about its equity (Mathew, 2015).
Tracy (2012) supports the claim of Mathew (2015) and further clarifies that the performance of a bank is related to its ability to generate a profit. The performance of a bank or any other financial institution is measured by reviewing its profitability trends in the past few years. The profitability can be determined by using a net profit margin ratio. The net profit margin ratio is an effective and reliable tool to measure the percentage of profit as a proportion of the company’s revenue (Tracy, 2012).
Luo (2016) mentions the significance of financial ratios in assessing the performance of a bank in a different way. The important financial ratios are Return on Assets (ROA) and Return on Equity (ROE) that indicate how efficiently a bank has utilized its available resources to generate profit. ROA calculates the percentage of the profit of a bank as a proportion of its assets. ROA represents the bank’s profitability, that also indicates the efficiency of its asset utilization (Luo, 2016). Mathew (2015) further explains that ROE measures the percentage of the bank’s profit as a proportion of the investment of shareholders. The efficiency of a bank can be determined by calculating ROE. It determines the success of business in generating income by utilizing the available capital (Mathew, 2015).
Luo (2016) argues that the use of the capital adequacy ratio can assess the performance of financial institutions such as banks. The Capital Adequacy Ratio is also known as capital to risk ratio that represents the reasonable amount of loss that a bank can accept based on statutory capital requirements. Tracy (2012) also supports the argument by mentioning another name for this ratio that is the capital-to-risk weighted asset ratio. The ratio is important to measure if the bank has the cushion to absorb losses before becoming insolvent that is in the case of loss of funds of depositors (Tracy, 2012).
Data, Results, and Discussion
Balance Sheet
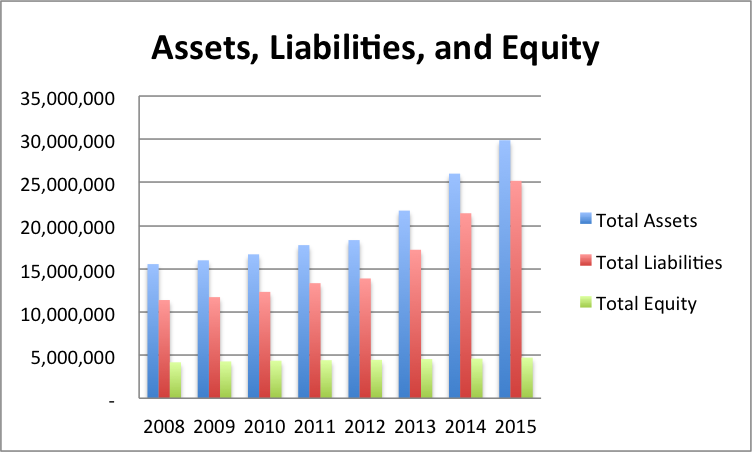
The following table provides values of the bank’s assets, liabilities, and equity in the period starting from 2009 to 2015.
Table 1: Assets, Liabilities, and Equity of Sharjah Islamic Bank. Sources: Sources: (Sharjah Islamic Bank – Director’s Report and Consolidated Financial Statements – 2009, 2009; Sharjah Islamic Bank – Director’s Report and Consolidated Financial Statements – 2011, 2011; Sharjah Islamic Bank – Director’s Report and Consolidated Financial Statements – 2013, 2013; Sharjah Islamic Bank – Director’s Report and Consolidated Financial Statements – 2015, 2015).
Table 1 indicates that the bank’s assets, liabilities, and equity increased in the last nine years. The bank’s made effective use of customer deposits to increase their lending activity. The assets and liabilities of the bank increased in almost the same proportion over the years. However, the bank’s equity increased at a slow growth rate. The bank should focus on enhancing its equity level as it would improve its capital adequacy and liquidity.
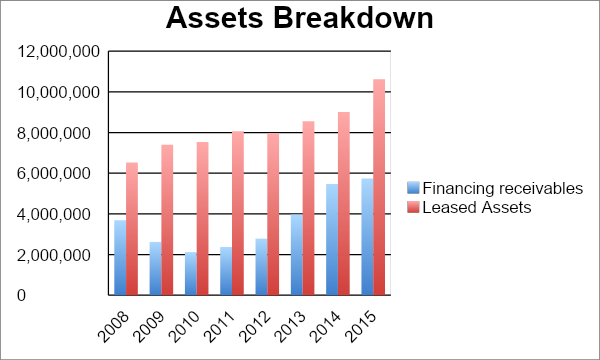
The analysis of the bank’s assets indicated that its main assets were financing receivables and leased assets. Table 2 provides the values of assets held by the company in the last nine years.
Table 2: Main Assets of Sharjah Islamic Bank. Sources: (Sharjah Islamic Bank – Director’s Report and Consolidated Financial Statements – 2009, 2009; Sharjah Islamic Bank – Director’s Report and Consolidated Financial Statements – 2011, 2011; Sharjah Islamic Bank – Director’s Report and Consolidated Financial Statements – 2013, 2013; Sharjah Islamic Bank – Director’s Report and Consolidated Financial Statements – 2015, 2015).
The breakdown of assets indicates that the bank’s portfolio was not concentrated in single business activity. As it is already mentioned, the bank offers its products and services in four different categories, including retail banking, corporate banking, investment management, and real estate. The analysis indicates that the bank had a diverse client portfolio. It is important for the bank to have income generated from different sources to mitigate the credit risk.
Income Statement
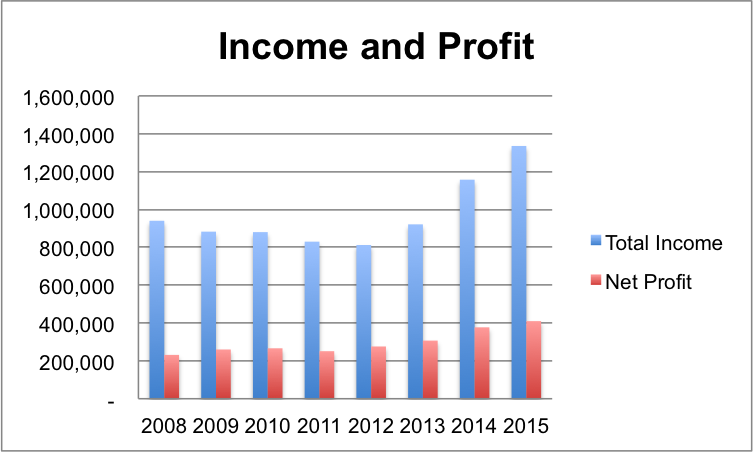
The following table provides values of the bank’s income and profit in the period starting from 2009 to 2015.
Table 3: Income and Net Profit of Sharjah Islamic Bank. Sources: (Sharjah Islamic Bank – Director’s Report and Consolidated Financial Statements – 2009, 2009; Sharjah Islamic Bank – Director’s Report and Consolidated Financial Statements – 2011, 2011; Sharjah Islamic Bank – Director’s Report and Consolidated Financial Statements – 2013, 2013; Sharjah Islamic Bank – Director’s Report and Consolidated Financial Statements – 2015, 2015).
It could be noted from the bank’s financial statements that its total income was generated from financing and leasing activities. The total income increased by 42% and the net profit increased by 77%. It clearly indicated that the bank managed its operating expenses efficiently that lowered its costs and improved profitability.
Provision Related to Non-Performing Loans
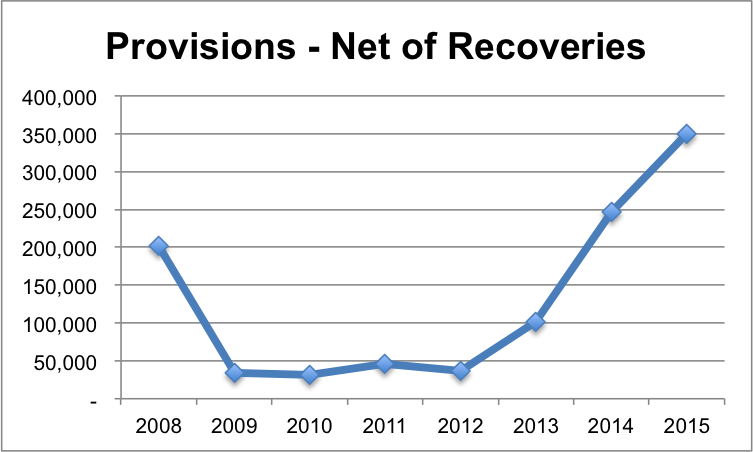
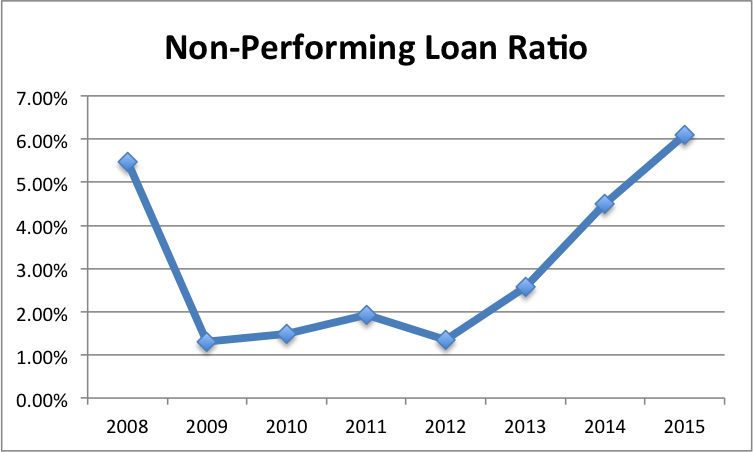
It is important for a bank to monitor its credit activity closely and reduce the number of non-performing loans. Non-performing loans can affect the bank’s liquidity and its ability to increase its financing and leasing activities. It is common that clients default on repayment of the principal loan amount and interest payments. In such cases, the bank records a loss in the form of provisions in its income statement. The table provided below indicates provisions – net of recoveries of Sharjah Islamic Bank.
Table 4: Provision Related to Non-Performing Loans. Sources: (Sharjah Islamic Bank – Director’s Report and Consolidated Financial Statements – 2009, 2009; Sharjah Islamic Bank – Director’s Report and Consolidated Financial Statements – 2011, 2011; Sharjah Islamic Bank – Director’s Report and Consolidated Financial Statements – 2013, 2013; Sharjah Islamic Bank – Director’s Report and Consolidated Financial Statements – 2015, 2015).
The provisions related to non-performing loans increased in the last nine years. It could raise major concerns regarding the bank’s effectiveness in managing its credit portfolio. It is important for the bank to perform regular reviews of the creditworthiness of its clients and take action to ensure the timely recovery of its loans. The figure provided below helps to understand the major shift in the trend. The provisions were very high in 2008 as the U.S. and all major economies faced the financial crisis that affected the global banking industry. The bank managed to keep its provisions at a low level in the next four years.
Key Performance Indicators
Table 5 provides values of different key performance indicators of the Sharjah Islamic Bank.
Table 5: Key Performance Indicators. Sources: (Sharjah Islamic Bank – Director’s Report and Consolidated Financial Statements – 2009, 2009; Sharjah Islamic Bank – Director’s Report and Consolidated Financial Statements – 2011, 2011; Sharjah Islamic Bank – Director’s Report and Consolidated Financial Statements – 2013, 2013; Sharjah Islamic Bank – Director’s Report and Consolidated Financial Statements – 2015, 2015).
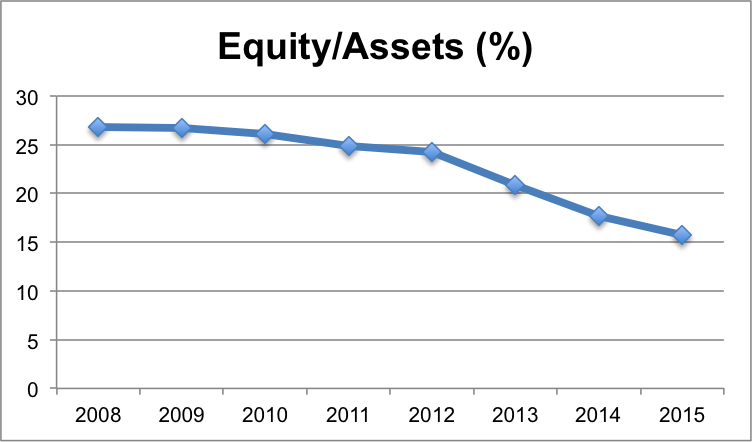
Figure 5 indicates a declining trend of equity/assets ratio value. It implies that the bank increased its assets (financing, investment, and leasing activities) without increasing its equity. It could be problematic for the bank as it should have sufficient equity to back its assets.
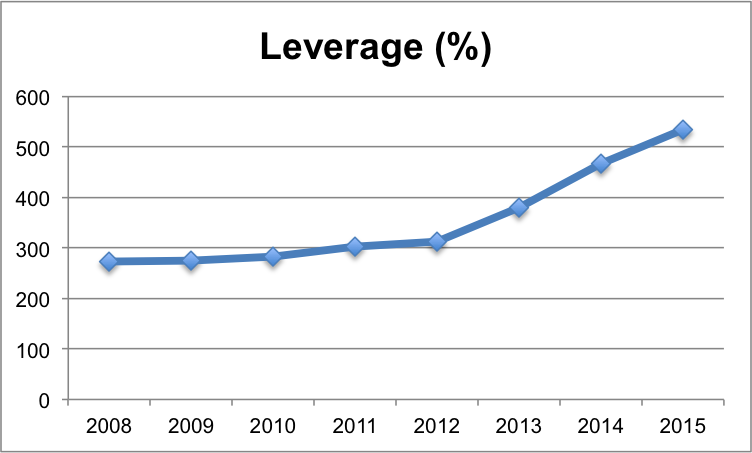
The bank’s leverage increased sharply after 2012. The bank received large sums of customer deposits and investments from clients that increased its liabilities.
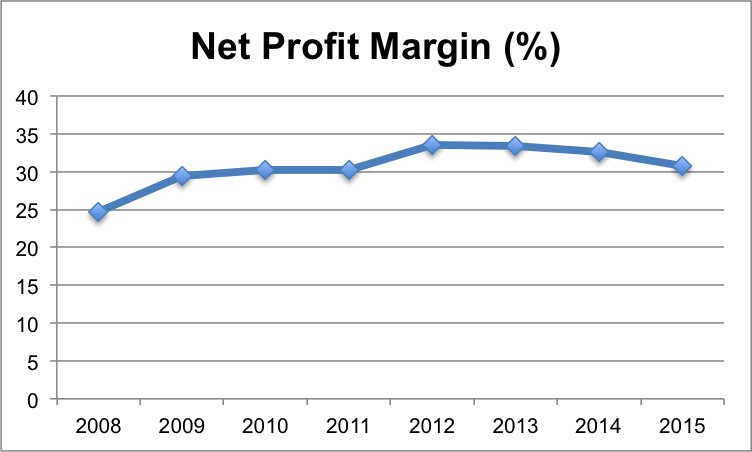
The net profit margin of the bank increased slowly from 2008 till 2012. However, in the last three years, there was a declining trend observed in the bank’s net profit margin value. The bank needs to focus on improving its profit margin on financing and leasing activities to increase its profitability.
The table provided below indicates the mean value of ROA and ROE.
Table 6: Mean Value of ROA and ROE.
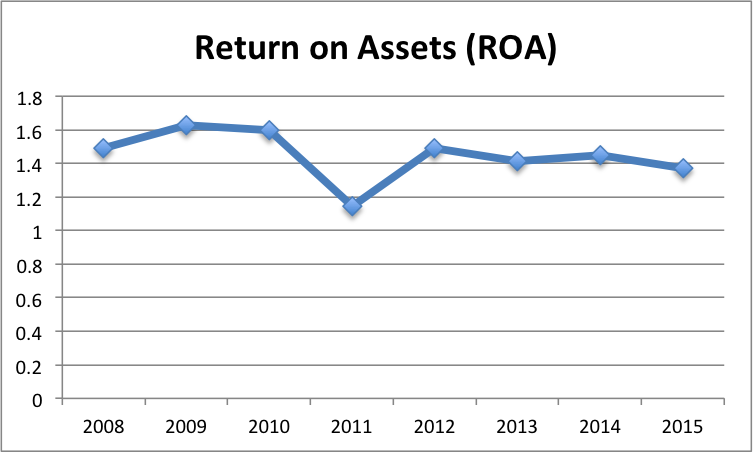
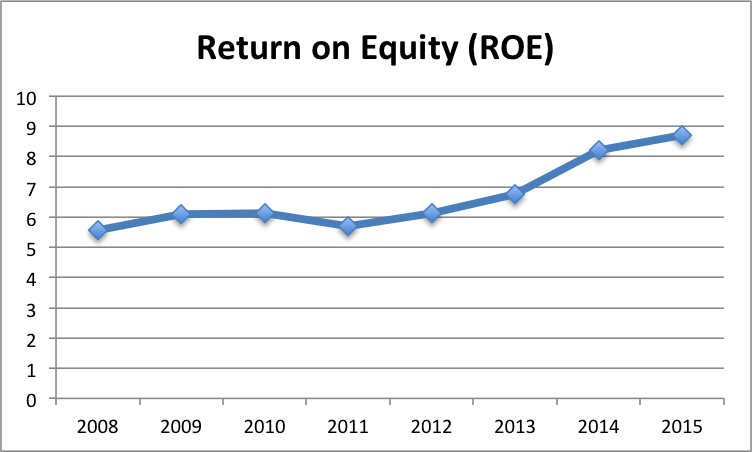
The mean value of ROA indicates that the bank generated a profit of Dirham 1.45 for each Dirham 1 invested in its assets, including financing receivables, leased assets, investments, and other securities. The mean value of ROE indicates that the bank degenerated a profit of Dirham 6.66 for every Dirham 1 of its equity.
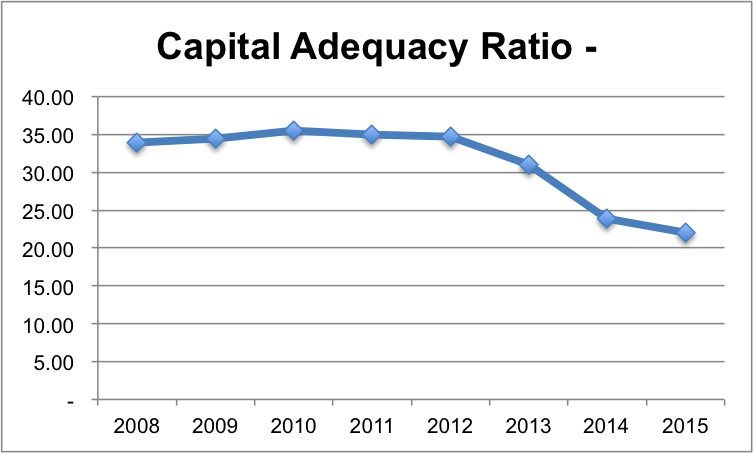
It is crucial for a bank to have strong capital adequacy in providing financing and leasing services to the increasing number of customers. However, the analysis shows that the bank’s capital adequacy declined in the last three years. The bank could face major problems its value further deteriorates.
DuPont Analysis
DuPont Analysis breaks down the value of ROE into three components that are related to profitability, efficient, and asset utilization. It is an important measure of ROE as it helps in determining the efficiency and effectiveness of the business strategy. The ROE can be determined by using the following equation.
ROE = Net Profit Margin x Asset Turnover X Equity Multiplier.
ROE = Net Profit / Total Income x Total Income / Total Assets x Total Assets / Total Equity (Koch & MacDonald, 2014).
Table 7 provides values of the three ratios that were used to calculate the ROE of Sharjah Islamic Bank.
Table 7: DuPont Analysis.
It could be noted that the bank’s net profit margin increased after 2008. In 2015, it declined by almost 2%. However, the asset turnover remained the same for the last four years. The value of equity multiplier also improved in the last nine years. The outcome of these changes in the values of the three performance indicators was the increase in the value of ROE. The bank’s ROE was 8.71% in 2015 and 8.22% in 2014. The results also coincide with the calculation of ROE performed in the previous section.
Conclusion
Sharjah Islamic Bank is a leading Islamic bank that offers great products and services. The financial analysis of the bank indicated that its business operations remained successful over the last nine years. The bank’s total income declined after 2008 due to the financial crisis in the U.S. and European countries. However, the bank achieved significant growth in 2013, 2014, and 2015. On the other hand, the banks total assets increased substantially in the last nine years. The bank maintained a strong capital adequacy position in this period. Moreover, the bank’s profitability remained strong, and it generated a high return for its shareholders.
A major concern related to the bank’s financial performance was the increase in the provision related to non-performing loans. Although the bank’s assets increased considerably in the last three years, the value of non-performing loan ratio increased as well that could indicate poor management of credit activities of the bank. The bank should improve its procedures to assess the creditworthiness of individuals. It has a strong client base, and its portfolio is diverse as it offers excellent services in retail banking, investment management, and real estate. There were certain contingent claims and liabilities reported by the bank in its financial statement. They should be taken into consideration while assessing the bank’s financial performance. However, it could be concluded that the bank is unlikely to face any major problems in future. The bank has a strong position in the market, and it will continue to make its network stronger.
References
Koch, T. W., & MacDonald, S. S. (2014). Bank management. Boston, MA: Cengage Learning.
Lai Ping-fu, B., & Cho Kwai-yee, K. (2016). Relationships between stock returns and corporate financial ratios based on a statistical analysis of corporate data from the Hong Kong Stock market. Public Finance Quarterly, 61 (1), 110-123.
Luo, D. (2016). The development of the Chinese financial system and reform of Chinese commercial banks. New York, NY: Springer.
Mathew, B. (2015). Anchor India 2015. New Delhi, India: Kerala Communication Private Limited.
Sharjah Islamic Bank – (SIB). (2016). Web.
Sharjah Islamic Bank – About us. (2016). Web.
Sharjah Islamic Bank – Director’s report and consolidated financial statements – 2009. (2009). Web.
Sharjah Islamic Bank – Director’s report and consolidated financial statements – 2011. (2011). Web.
Sharjah Islamic Bank – Director’s report and consolidated financial statements – 2013. (2013). Web.
Sharjah Islamic Bank – Director’s report and consolidated financial statements – 2015. (2015). Web.
Sharjah Islamic bank – Our values. (2016). Web.
Tracy, A. (2012). Ratio analysis fundamentals: How 17 financial ratios can allow you to analyze any business on the planet. New York, NY: RatioAnalysis.