A Snapshot of Starbucks today
Starbucks is a global brand that and operates limited-services cafes in more than 67 countries. The company operates more than 22,000 restaurants and employs more than 300,000 workers across its branches. Starbucks mainly specializes in retail and marketing coffee and other related products. It offers specialty coffee, Frappuccinos, spice lattes and other variety of breakfast items. The company operates under different brand names such as Teavana, Seattle’s best coffee and Ethos. The company has been facing stiff competition over the years. In fact, as a strategy for reducing competition, Starbucks announced the closure of 23 La Boulange shops to serve La Boulanger food. In 2013, Starbucks acquired Teavana to expand its business operations for $620 million. Teavana is a well-known company for its tea-based beverages products.
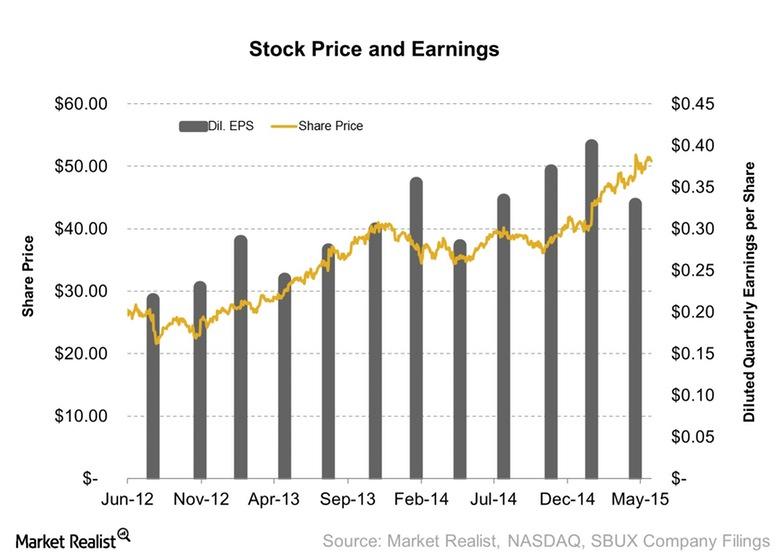
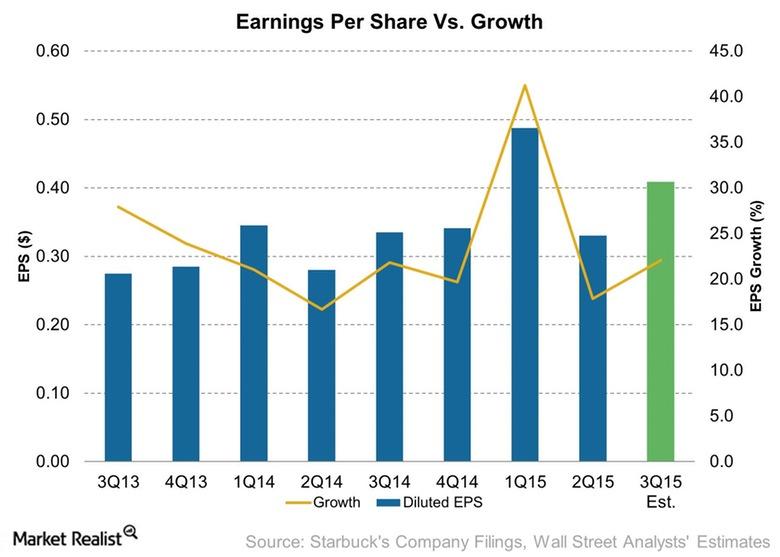
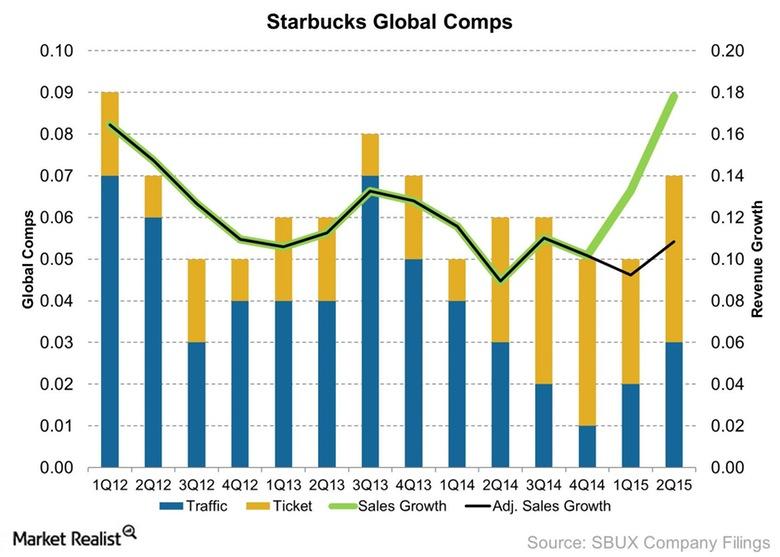
Starbuck’s share has been stable over the last three years. The company has experienced growth in terms of revenue, increased net income and solid financial position. Moreover, the company has a reasonable debt level that has enabled the company to pay dividends. In fact, Gibson noted that Starbucks revenue growth in 2014 was higher than the industrial average by about 6 percent (98). Starbucks reported a 9.1 percent increase in revenues that have trickled down leading to improved earnings per share. Net income grew by 9.4 percent compared to 2013, from $390.30 million to $426.9 in 2014. Net cash flow increased to $418.4 million which represents a 37.09 percent that was above the industrial average growth rate of -3.09 percent. However, the company has reported volatile earnings per share in the last three years. Earnings per share improved by 9.8 percent compared to the previous year. In 2013, Starbucks reported a net loss earning per share of -$0.01. However, investors are optimistic that the company will recover, and the market expects earnings per share to increase by $2.67 in 2015.

Financial statements of Starbucks
Financial ratio analysis
Ratio Analysis is a financial tool used by investors to compare the relationship between risk and return. It is a useful tool used for interpreting financial statements so as to measure the strength and weaknesses of a firm. It is used to measure the historic and future performance of a company to determine the long-term qualitative relationship between items in the financial statements. The relationship between balance sheet items can be expressed in terms of percentage or proportion of number to indicate the relationship between two variables. Typically, ratio analysis does not add any information inherent in the financial statements but reveals the relationship between financial statements in a more meaningful manner (Jury 58). The disclosure of such relationships helps investors to make sound investment decisions. Moreover, it makes the financial information comparable to establish the long-term profitability or liquidity of a firm. Financial statements on the balance sheet do not yield significant meaning by themselves, but when expressed in terms of related ratios can yield more inference. Comparison of ratios can be done using trend analysis, interim comparison or comparison with standards.
In this case study, we focus on trend analysis since it establishes the relationship between financial statements figures over a period by comparing ratios. These ratios indicate the direction of change in terms of deterioration, performance improvement or constancy. Investors are interested in knowing the liquidity, debt, return on equity and profitability of a Starbucks.
Liquidity ratios indicate the ability of a firm to meet its short and long-term financial obligation as and when they are due for payment. Mostly, liquidity ratios are used to measure the short-term financial solvency of Starbucks. In fact, short-term liquidity is a prerequisite for the survival of Starbucks. It measures the efficiency of utilization of current assets and current liability. We shall apply current ratio, and acid-test ratios to measure the short-term solvency of Starbucks.
Current ratios
Acid test ratio
Liquidity ratios measure the ability of a firm to meet it short-term obligations. The need to calculate the margin of safety in current ratios arises from the unevenness in the flow of money through current assets and current liability. Therefore, Starbucks must maintain sufficient current assets to be assured of being able to meet its short-term obligations. Starbuck’s current ratios have improved over the last five years. However, it remains volatile as a result of changes in current liability. Fridson and Alvarez argue that the higher the ratio, the better the firm’s performance (36). However, high current ratios may be an indicator of inventories and debtors’ mismanagement in terms of the long debtor’s collection period. In 2014, a current ratio of 1.37 indicated that for every dollar of current liability Starbucks has, 1.37 current assets are available to pay short-term liability. The liquidity of Starbuck is stable since the firm can be able to meet its short-term maturing obligation as and when they fall due. According to the conventional norm, a current ratio of 2:1 is taken to be sufficient to meet the short-term liquidity. However, what is assumed to be a satisfactory ratio might differ depending on the industry in which a company falls and development in the capital market. Moreover, the major drawback of the acid test ratio is that some business decision that favors acid test ratios may not necessarily lead to future profitability. In summary, Starbuck’s solvency in the short term is stable. However, a convention ratio of 2:1 does not guarantee that a firm will be able to meet its short-term obligations. In fact, Khan and Jain argue that some company encounters challenges in paying short-term bills although they have a ratio of 2:1(164). Therefore, liquidity ratios are not a conclusive answer to the real solvency of Starbucks in the short run.
Debt ratios
Debt to equity ratio
Debt ratio
The relationship between owner’s claims and outsiders can be expressed in debt to equity ratio and debt ratio. Debt to equity ratios measures the relationship between borrowed money and shareholders’ capital. In simple terms, it establishes the link between the amount invested by outsiders and owners of Starbucks. Starbucks ‘ debt to equity ratio indicates that the firm owners (equity) are higher than outsiders’ investment in the company. Shareholders are investing more in the business which implies that investors have confidence in the future profitability of the enterprise. However, high ratios indicate the firm is high in debt which would affect capital structure leading to inflexibility in management operation (Helfert 18).
The debt ratio measures the number of times total assets can cover total liability. The debt ratio measures the long-term solvency of Starbucks and also identifies the level of the total asset financed by debt. In the above ratios, Starbucks has increased debt capital over the last five years. In fact, the debt to equity ratio was high in 2013 at 61.1 percent. The ratios indicate that 61.1 percent of Starbucks assets are financed by debt. However, the rate of debt-financed declined in 2014 to 51 percent.
Stock exchange ratios
Earning per share
Earning per share ratios indicate the profitability attach to each share held by an individual investor. The conventional rule is that the higher the ratio, the better the performance. Starbucks ‘ earnings per share increased in the last five years from 0.62 in 2010 to 1.36 in 2014. This is a positive indicator that the company is making enough profits to be distributed to investors as dividends.
Forecast free cash flow
A firm’s value is treated as an interest rate derivative based upon underlying business risk. This means that a company is structured to maximize shareholders’ value. A companies’ value can then be determined by discounting its free cash flow to obtain the actual value metrics (Mulford and Comiskey 125). Free cash flow represents money available for distribution to investors after capital expenditure deduction. A forecasted free cash flow can be obtained by subtracting capital expenditure from operating income.
Calculating the cost of capital
The cost of capital represents the minimum required rate of return by providers of long-term capital. Typically, a firm finances its long-term project from various sources of capital such as equity, debentures, long-term loans and preference share capital.
Calculated weighted cost of debt
The weighted cost of debt = D/ (E+D) = 84328.12/ (8432.12+1673.85) = 0.0195
By using interest expense divided by average debt
64.1/1673.85 = 3.8295
Cost of equity
Cost of equity = RF + (RM-RF) Beta
Beta =0.82
Risk-free rate =2.34
Market portfolio return = 7.5
2.34+ (7.5-2.34)0.82= 6.57%
Weighted average cost of capital
WACC = E/ (E+D) *cost of equity + D/ (E+D)*cost of debt*(1-tax rate)
0.9805*6.57%+0.0195*3.8295 %*( 1-68.2%) = 6.5 %
Valuation of equity
Intrinsic value of a share using discounted free cash flow method
Value of Starbucks – value of debt
Intrinsic value of Starbucks = 56.46
Starbucks value – value of debt
56.46-3.829 = 52.771
Price earning ratio (P/E)
P/E ratio = value of a share /earning per share
Price earning ratio =33.3
Earning per share =1.58
Intrinsic value of equity = 1.58*33.3 = 52.614
Conclusion
Starbuck has a sound financial position indicated by positive current ratios. The firm has diversified its business operations by adding food to its menu. Recently, Starbucks launched a mobile phone app that allows customers to place orders and pay online conveniently. The innovative technology is expected to drive sales higher in the coming three years. Starbucks has reported increased revenues in the last four years that have tricked down and been reflected in the rising earning per share. Stock prices have risen in the last three years based on the fact that investors believe Starbuck has numerous opportunities to expand its future profitability.
Recommendation
After a critical evaluation of Starbucks Corporation (SBUX), it is rated as a BUY. This is driven by a number of strengths that outweighs weakness, and thus should give investors good returns than other stocks in this industry. Starbucks has reported growing revenues over the last three years and is expected to continue in the foreseeable future. The net income has increased significantly. In fact, Starbucks has a stable current ratio indicating the firm is stable in the short term. Moreover, Starbuck’s debt to equity ratio indicates that the firm owners (equity) are higher than outsiders’ investment in the company. Shareholders are investing more in the company which implies that investors have confidence in the future profitability of the enterprise. Starbuck has diversified its business operation to include mobile phone apps that allow a customer to order and pay online. It is expected that the app will increase future profitability that will be reflected in stock prices. Therefore, investors should buy Starbucks shares.
Works Cited
Fridson, Martin S., and Fernando Alvarez. Financial statement analysis a practitioner’s guide, fourth edition. Hoboken, N.J: John Wiley & Sons, 2011. Print.
Gibson, Charles H. Financial reporting & analysis: using financial accounting information. Mason, OH: South-Western Cengage Learning, 2009. Print.
Helfert, Erich A. Techniques of financial analysis: a guide to value creation. Boston: McGraw-Hill/Irwin, 2003. Print.
Jury, Timothy D. Cash flow analysis and forecasting the definitive guide to understanding and using published cash flow data. West Sussex England: John Wiley & Sons, 2012. Print.
Khan, M. Y., and P. K. Jain. Financial management. New Delhi: Tata McGraw-Hill, 2007. Print.
Mulford, Charles W., and Eugene E. Comiskey. Creative cash flow reporting uncovering sustainable financial performance. Hoboken, N.J: J. Wiley, 2005. Print.
Appendixes


