History of the company
Netflix Inc. is an American based publicly traded. Marc Randolph founded the company in 1997. At the end of 2012, the company had engaged 2,045 employees on a full-time basis. The company also engages part-time employees, especially in the DVD fulfillment operations. It is due to the seasonality of the business segment. The total number of part-time employees at the end of 2012 was 384. The company operates in several geographic regions such as the USA, Canada, Mexico, South America, Republic of Ireland, United Kingdom and Nordic countries apart from Iceland. The company has grown extensively.
Management of the company has strived to expand the market region. For instance, the company opened markets in regions such as Norway, Denmark, Finland, and Sweden. Further, the growth of the company is attributed to partnerships. The company has entered into several partnerships with companies such as Paramount Pictures, Sony Pictures, and 20th Century Fox (Netflix Inc., 2013).
Products and customers of the company
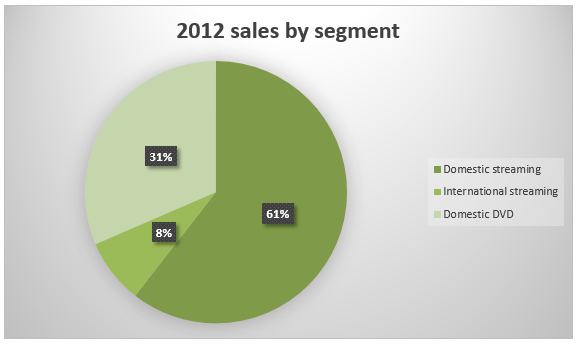
The company is a world leader in the provision of an internet television network. The company has an extensive customer base of 33 million. Further, it serves customers in over 40 countries. The customers enjoy over one billion hours of TV shows, movies and internet-connected screens per month. In return, the customers pay a monthly subscription fee. The products offered to customers are divided into three segments these are domestic streaming, international streaming, and domestic DVD. Domestic streaming serves the highest number of customers these are, 27 million members (Netflix Inc., 2013). The size of the market grew by 25% in 2011. The international streaming segment captures sales to other regions which are outside the USA. The table below summarizes the number of sales generated from each segment.
From the table, it is clear that over 92% of sales generate in 2012 emanated from the domestic streaming and DVD segment. International streaming generated only 7.97% of total sales. The management of the company is implementing strategies to expand the international streaming segment. The pie chart below shows the proportion of sales generated by each segment.
Financial analysis – financial ratios
The reported financial statements of the company do not give an in-depth analysis of the financial health of the company. Therefore, it is necessary to carry out an in-depth analysis of the financial statements to have a better view of the company. Further, analysis of the company helps in making an informed decision. Ratio analysis is a common tool used to carry out a financial analysis. It breaks down the financial data into various components for a better understanding of the financial strengths and weaknesses of the company. Ratio analysis will focus on the profitability, liquidity and gearing level of the company.
Profitability
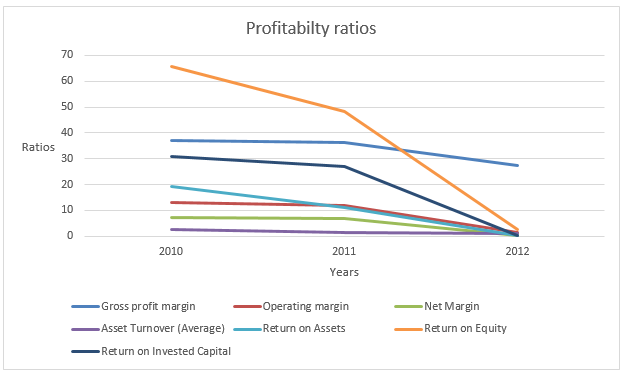
Profitability ratios indicate the earning capacity of an entity. The ratios measure the effectiveness of a company in meeting the profit objectives both in the long run and short run. The ratios show how well a company employs its resources to generate returns. Commonly used profitability ratios comprise gross profit margin, operating profit margin, net profit margin, the return on asset ratio, and the return on equity. The table below summarizes the profitability ratios of the company for the past three years.
The results in the table above show a declining trend of the profitability ratios. The gross profit margin declined from 37.24% in 2010 to 27.25% in 2012. Similarly, the operating profit margin declined by a large margin that is, from 13.12% in 2010 to 1.39% in 2012. Similarly, the net margin declined from 7.44% in 2010 to 0.48% in 2012. There was also a sharp decline in return on equity. The value declined from 65.75% in 2010 to 2.47%in 2012.
Return on assets also declined by a large margin that is 19.36%in 2010 to 0.49% in 2012. The decline in profitability is a soaring trend. The sharp decline in profitability in 2012 is attributed to the increased cost of revenue and cost of operation with no subsequent revenue offset the increase in cost. This was attributed to an increase in the cost of licenses. The results above show the inability of the management to control costs to sustain a given profitability threshold. The graph below shows the trend of profitability ratios for the three years.
Liquidity
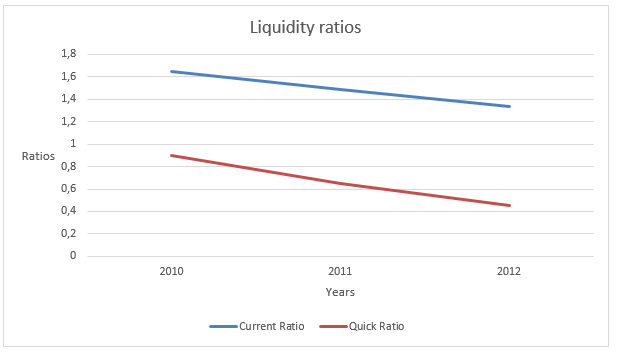
Liquidity ratios show the ability of an organization to maintain positive cash flow while satisfying immediate obligations that is, the availability of cash to pay current debt. It is necessary to maintain optimal liquidity ratios since either low or very high ratios are not favorable. The table below summarizes the liquidity ratios of the company for the past three years.
The declining trend in the financial performance of the company can also be in the liquidity ratios. Both current and quick ratios declined during the three years. The current ratio declined from 1.65 in 2010 to 1.34 in 2012. Similarly, the quick ratio declined from 0.9 in 2010 to 0.45 in 2012. The ratios show that the company is experiencing difficulties in meeting current obligations. It is a bad indication to both current and potential debt providers. The graph below shows the trend of liquidity ratios for the three years.
Efficiency
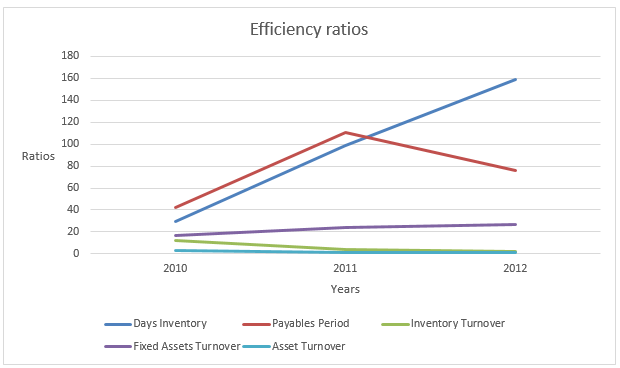
Efficiency ratios focus on the internal operations of the company. These ratios show the level of activity in a company. It focuses on efficiency in the allocation of resources to maximize output and sales from the resources available. Efficiency ratios majorly focus effectiveness of the company in paying creditors, how long the company takes to replace inventory and finally how long it takes the company to collect money from debtors. The efficiency of a company contributes immensely to the profitability of a company. The table below summarizes the efficiency of the company.
Day’s inventory, payables period, inventory turnover, and assets turnover worsened over the period. The payables period declined over the period. This shows that the company took longer to pay creditors. It is also clear in the declining liquidity ratios. The company is also taking a longer number of days to replenish stock. However, the fixed assets turnover ratio increased over the period by a small margin. Generally, is clear that the efficiency of the company declined over the period. The graph below shows the trend of efficiency ratios for the three years.
Gearing and solvency
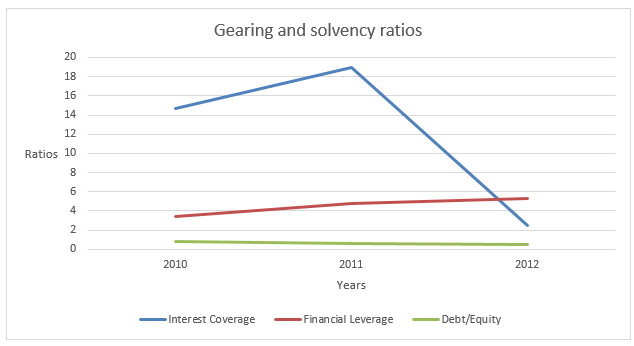
A company’s leverage is explained by the amount of debt financing it holds. The ratios are vital since they show the investor the extent of exposure to equity financing. A commonly used ratio is the debt to equity ratio. A high leverage ratio is not favorable since it scares away capital providers. It is because high ratios imply an increase in interest expense. This reduces the income attributable to shareholders. On the other hand, very low ratios are not favorable since it shows that the management of the company is not willing to exploit the potential of the company. Solvency ratios measure the ability of the company to repay the long term debts. A common ratio that is used to measure the solvency of a company is the time’s interest earned ratio. The table below summarizes the gearing and solvency ratios of the company for the past three years.
The interest coverage ratio shows the number of times the interest expense can be paid from earnings before interest and taxes. A high ratio is suitable since it shows the increased ability of the company to pay interest expenses. The ratio for the company declined from 14.64 in 2010 to 2.53 in 2012. The debt to equity ratio declined from 0.81 in 2010 to 0.54 in 2011. It is a good indication to a potential investor. The overall financial leverage increased from 3.38 in 2010 to 5.33 in 2012. The graph below shows the trend of gearing and solvency ratios for the three years.
Analysis of valuation of inventory
The company does not deal directly with the purchase and sale of inventory. However, the inventory of the company is in the form of a content library. It is a term that is used to describe streaming license fees for specific titles. These titles are first made available to subscribers. The inventory of the company is treated just like noncurrent assets. Titles that are expected to run for more than one year are classified under non-current assets. They are amortized and the amount is included in the cost of revenue in the income statement.
Competitors
The company operates in a quite competitive industry. Besides, the industry experiences a constant metamorphosis due to rapid changes in technology. The competitors of the company are divided into several categories such as multichannel video programming distributors, over–the–top internet movie and TV content providers, transactional content providers, DVD rental outlets ad kiosk services and entertainment video retailers.
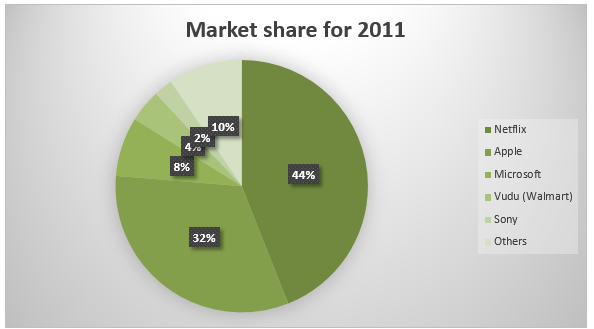
Some of the key companies in these categories are Amazon.com Inc., Blockbuster L.L.C, Redbox Automated Retail, and Wal-Mart Inc. (Netflix Inc., 2013). The revenue from the digital music industry in the US has grown from $1.9 billion in 2006 to $5.7 billion in 2011. Similarly, the worldwide revenue grew from $60.7 billion in 2006 to $67.6 billion in 2011. Thus, there has been an expansion in the industry thus giving companies in the industry an opportunity to earn more revenue. The table below summarizes the market share of the company.
The pie chart below shows the market share for online movies in the US.
The company has been able to stand out in the industry due to several factors. The first factor is the large scale of production. The company has a leading scale advantage, unlike its competitors. This can be attributed to a well-built library. Further, the outstanding services offered by the company helps in attracting and retaining customers. Finally, the company has innovative products that match the pace of changing technology. It is also coupled with brand clarity which gives customers a memorable experience when consuming products of the company. The company has also massively invested in major business segments. Besides, the company has endeavored to improve customer services. The table below compares the results of the company and its key competitor, Amazon.com Inc.
In the table above, it is clear that Amazon is larger than Netflix. However, despite operating in the same business environment, Netflix reported profits unlike its competitor Amazon. This can be a sign that the company is in a sound financial position than its competitors.
Conclusion
The analysis above shows that Netflix Inc. is a young company that is at a growth stage. The company is expanding its market to new regions. This results in high capital expenditure costs and low profitability. The analysis above shows a declining trend in the financial performance of the company. This can be attributed to the aggressive expansion and marketing strategy undertaken by the company. A potential investor should only expect future benefits once the company enters the maturity stage.
References
ABC News Network. (2013). Netflix Inc. (NTFX). Web.
Netflix Inc. (2013). 2012 financial statement. Web.