Analysis of variance (ANOVA) is a statistical test that is used to evaluate differences between the means of entities in different groups. ANOVA is a valid statistical test when three or more independent means need to be compared. Additionally, several assumptions should be fulfilled before ANOVA can be considered for data analysis. This paper describes data analysis by ANOVA using the variables quiz 3 and section.
Data File Description
The data file contains demographic data and students’ scores in 5 different quizzes. The variables used in this analysis are section and quiz 3 scores. “Section” is a categorical (nominal) variable, whereas “quiz 3” is a scale variable. A sample size of 105 was used in the collection of data. The goal of the analysis is to compare the mean scores for quiz 3 across different sections. The research question is “Is there a difference between quiz 3 scores for different sections?” The null hypothesis related to this research question is “There is no difference in quiz 3 scores for different sections.”
Conversely, the alternate hypothesis is “There is a difference in quiz 3 scores for different sections.” Section is an independent (predictor) variable with 3 levels, whereas quiz 3 score is the outcome (dependent) variable that ranges from 0 to 10. An alpha level of 0.05 is used for the data analysis process. ANOVA is an appropriate statistical test because it compares means across three groups.
Testing Assumptions
The first assumption of ANOVA is that the samples should be obtained from a population with a normal distribution. The second presumption is that each distribution should have the same variance (Chen et al., 2016). In contrast, the third assumption requires all samples to be selected randomly and be independent of each other.
Figure 1 shows a histogram for quiz 3, which can be described as bell-shaped. There is a distinct mound towards the center, showing that most data sets are within this peak. The overall distribution of the data sets is symmetrical.
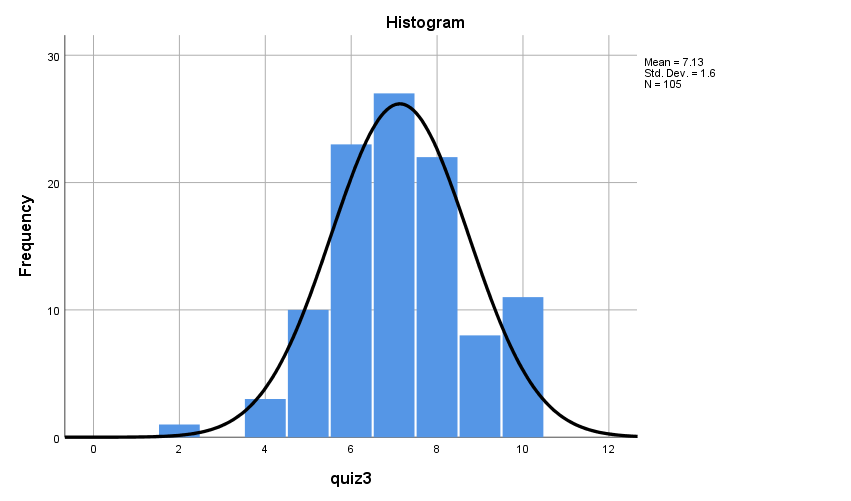
Table 1 shows the descriptive statistics for quiz 3. The mean is 7.13 (SD= ±1.6). Quiz 3 has a skewness of -0.078, which is less than -1 and implies that the distribution is skewed to the left. The kurtosis is 0.149, which is close to 0 (mesokurtic) and shows that the data follows a normal distribution. Given that skewness and kurtosis are less than +1, the distribution of the quiz 3 scores can be considered normal.
Table 2 shows the Shapiro-Wilk output. P-values that are less than the level of significance (0.05) indicate that the data are not normally distributed. From Table 2, the p-value is 0.000, implying that the data deviate significantly from the normal distribution.
Table 3 shows the results of the Levene test of homogeneity of variance. The p-value is less than 0.05, necessitating the rejection of the null hypothesis of equal variances. Therefore, the variances of quiz 3 scores are unequal.
The first assumption of ANOVA was met as shown by the bell-shaped histogram. However, the test of normality by the Shapiro-Wilk test indicated that the sample data were not normally distributed (p= 0.000). Similarly, Levene test of homogeneity of variance indicated that the variances were unequal. The violations of ANOVA assumptions could be ameliorated by transforming the data, using non-parametric tests, or employing substitute F-tests such as Welch’s or Brown-Forsythe tests.
Research Question, Hypotheses, and Alpha Level
Table 4 shows the descriptive statistics of quiz 3 for each section. Section 1 had a mean of 7.27 (±1.153) while section 2 had a mean of 6.33(±1.611). Section 3 had a mean of 7.94 (±1.560)
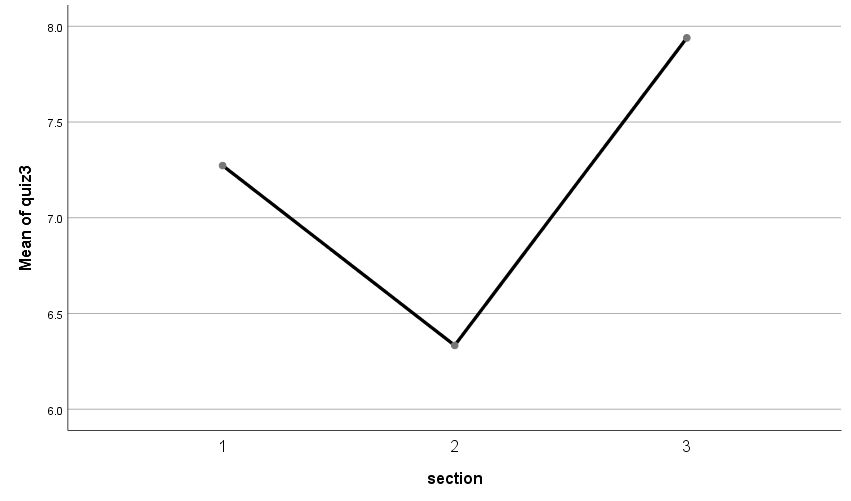
Figure 2 shows a means plot for the 3 sections. The highest mean was recorded in section 3 followed by section 1 and finally section 2.
Table 5 shows the conventional ANOVA output when the assumption of equal variance is met. However, previous tests indicate unequal variances, meaning that the ANOVA findings are invalid. Therefore, the Brown-Forsythe test is used instead because 3 means are compared.
Table 6 shows the adjusted ANOVA results according to the Brown-Forsythe test. There is a significant difference in quiz 3 scores across the three sections ([F(2, 96.918)= 11.167, p= 0.000). The calculated effect size is 0.177, which signifies a small effect size. Section has a small effect on quiz 3 scores.
Table 7 shows the Tukey HSD findings for significant pairs. There was a significant difference between quiz 3 scores for sections 1 and 2 (p=0.021) as well as between sections 2 and 3 (p= 0.000). The statistical findings show that there is a significant difference between section and quiz 3 scores. Therefore, the null hypothesis is rejected.
Conclusion
The analysis sought to determine whether quiz 3 scores differed across three sections. A one-way ANOVA was performed at the p=0.05 level of significance. The data failed to meet the requirements of the homogeneity of variance. Therefore, the Brown-Forsythe test was used. There was a significant difference in quiz 3 scores in different sections ([F(2, 96.918)= 11.167, p= 0.000) with a small effect size of 0.177. Therefore, the null hypothesis was rejected. Differences in quiz 3 scores were noted between sections 1 and 2 (p=0.021) as well as between sections 2 and 3 (p= 0.000).
The strengths of ANOVA include a robust design and increased statistical power. Its main limitation is the need to fulfill assumptions and difficulties determining precise differences between groups, necessitating post-hoc tests. This statistical approach may be used in social sciences to find the effect of different learning conditions on academic performance. The potential implication of such a study is the identification of optimal learning conditions, thereby leading to enhanced academic performance.
Reference
Chen, D-G., Chen, J., Lu, X., Yi, G. Y., & Yu, H. (Eds). (2016). Advanced statistical methods in data science. Springer.